Greater Vancouver Market Report Infographics
INFOGRAPHICS: June 2026 GVR Greater Vancouver Market Reports

Greater Vancouver home sales pick up at the start of summer
Demand for all home types in Metro Vancouver increased to start the summer, with home sales up nearly ten per cent year-over-year in June.
The Greater Vancouver REALTORS® (GVR) reports that residential sales in the region totalled 2,390 in June 2026, a 9.6 per cent increase from the 2,181 sales recorded in June 2025. This was 12.4 per cent below the 10-year seasonal average (2,728).
“June saw a pattern of broad gains in home sales across all home types relative to the same time last year, which has been a rare occurrence in recent years. June’s data could be an early sign of a shift in the market. In recent years, sales trends have usually been mixed across home types, which is typical of a sideways trending market. But with all housing types posting gains in June, the data indicate demand may be returning to the market more broadly.” Andrew Lis, GVR chief economist and vice-president data analytics
Read the full report on the REBGV website!
The following data is a comparison between June 2026 and June 2025 numbers, and is current as of July of 2026. For last month’s update, you can check out our previous post!
Or follow this link for all our GVR Infographics!
These infographics cover current trends in several areas within the Greater Vancouver region. Click on the images for a larger view!
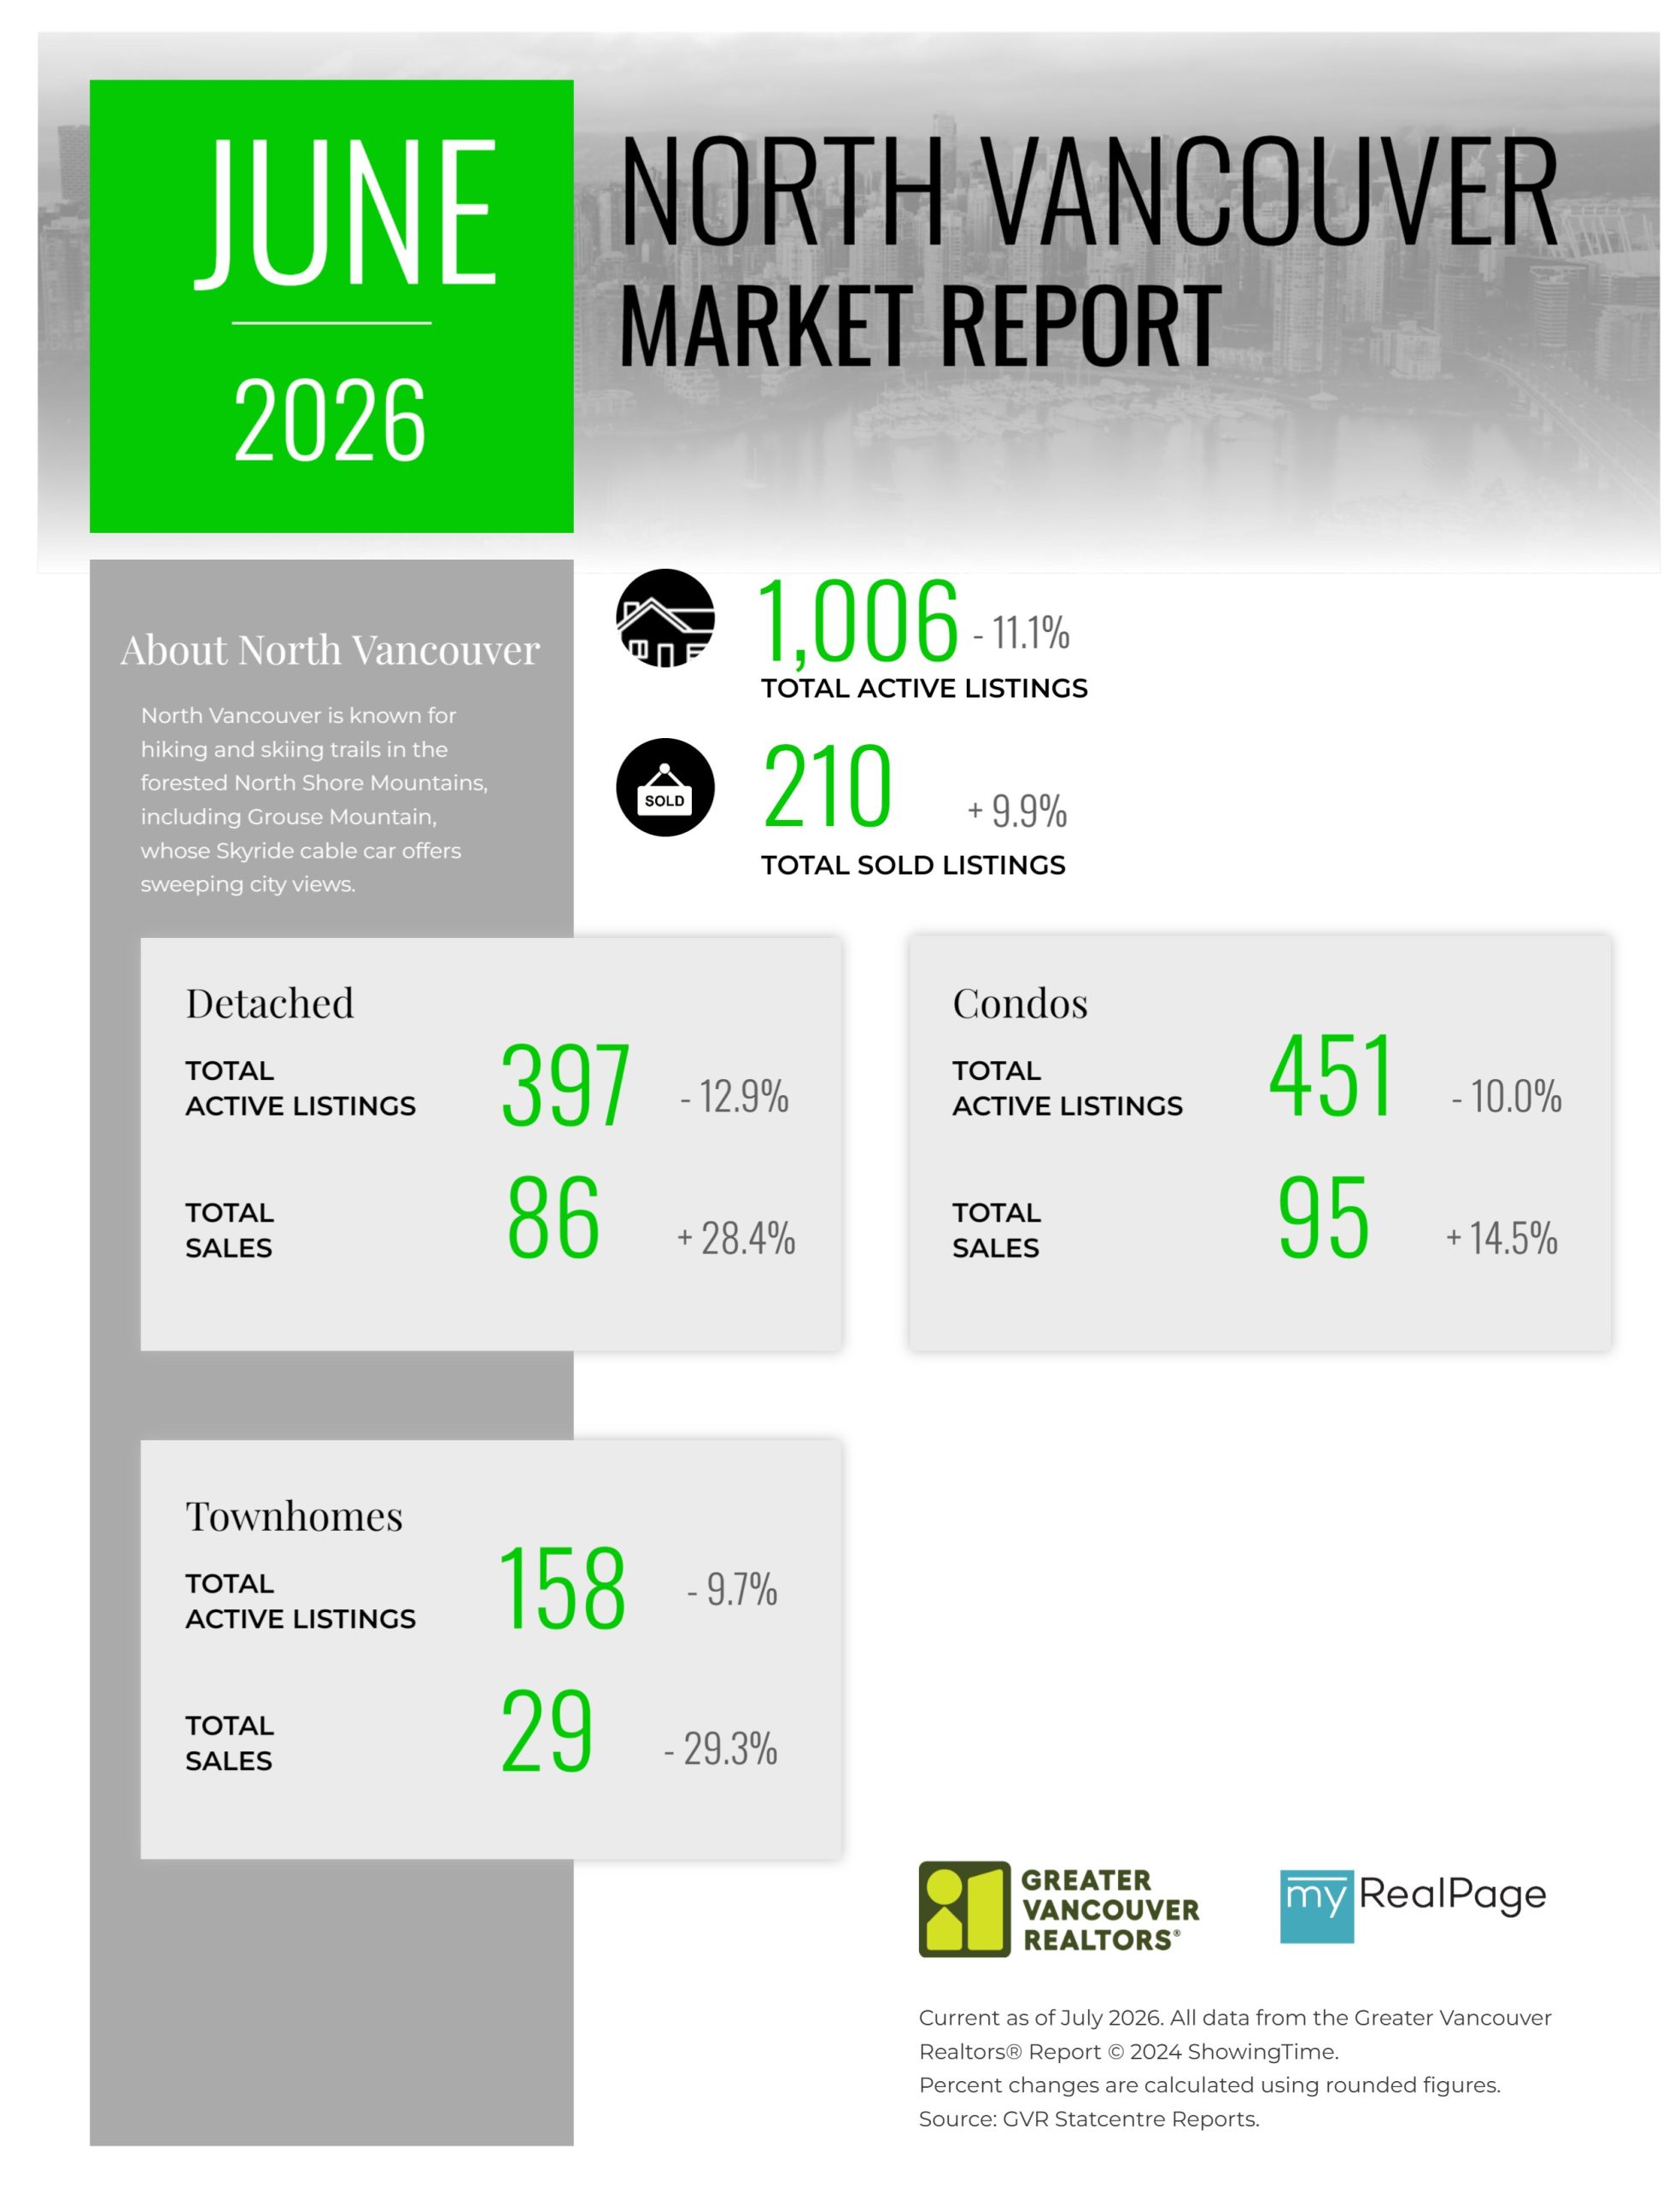
Printable Version – GVR June 2026 Data Infographic Report North Vancouver
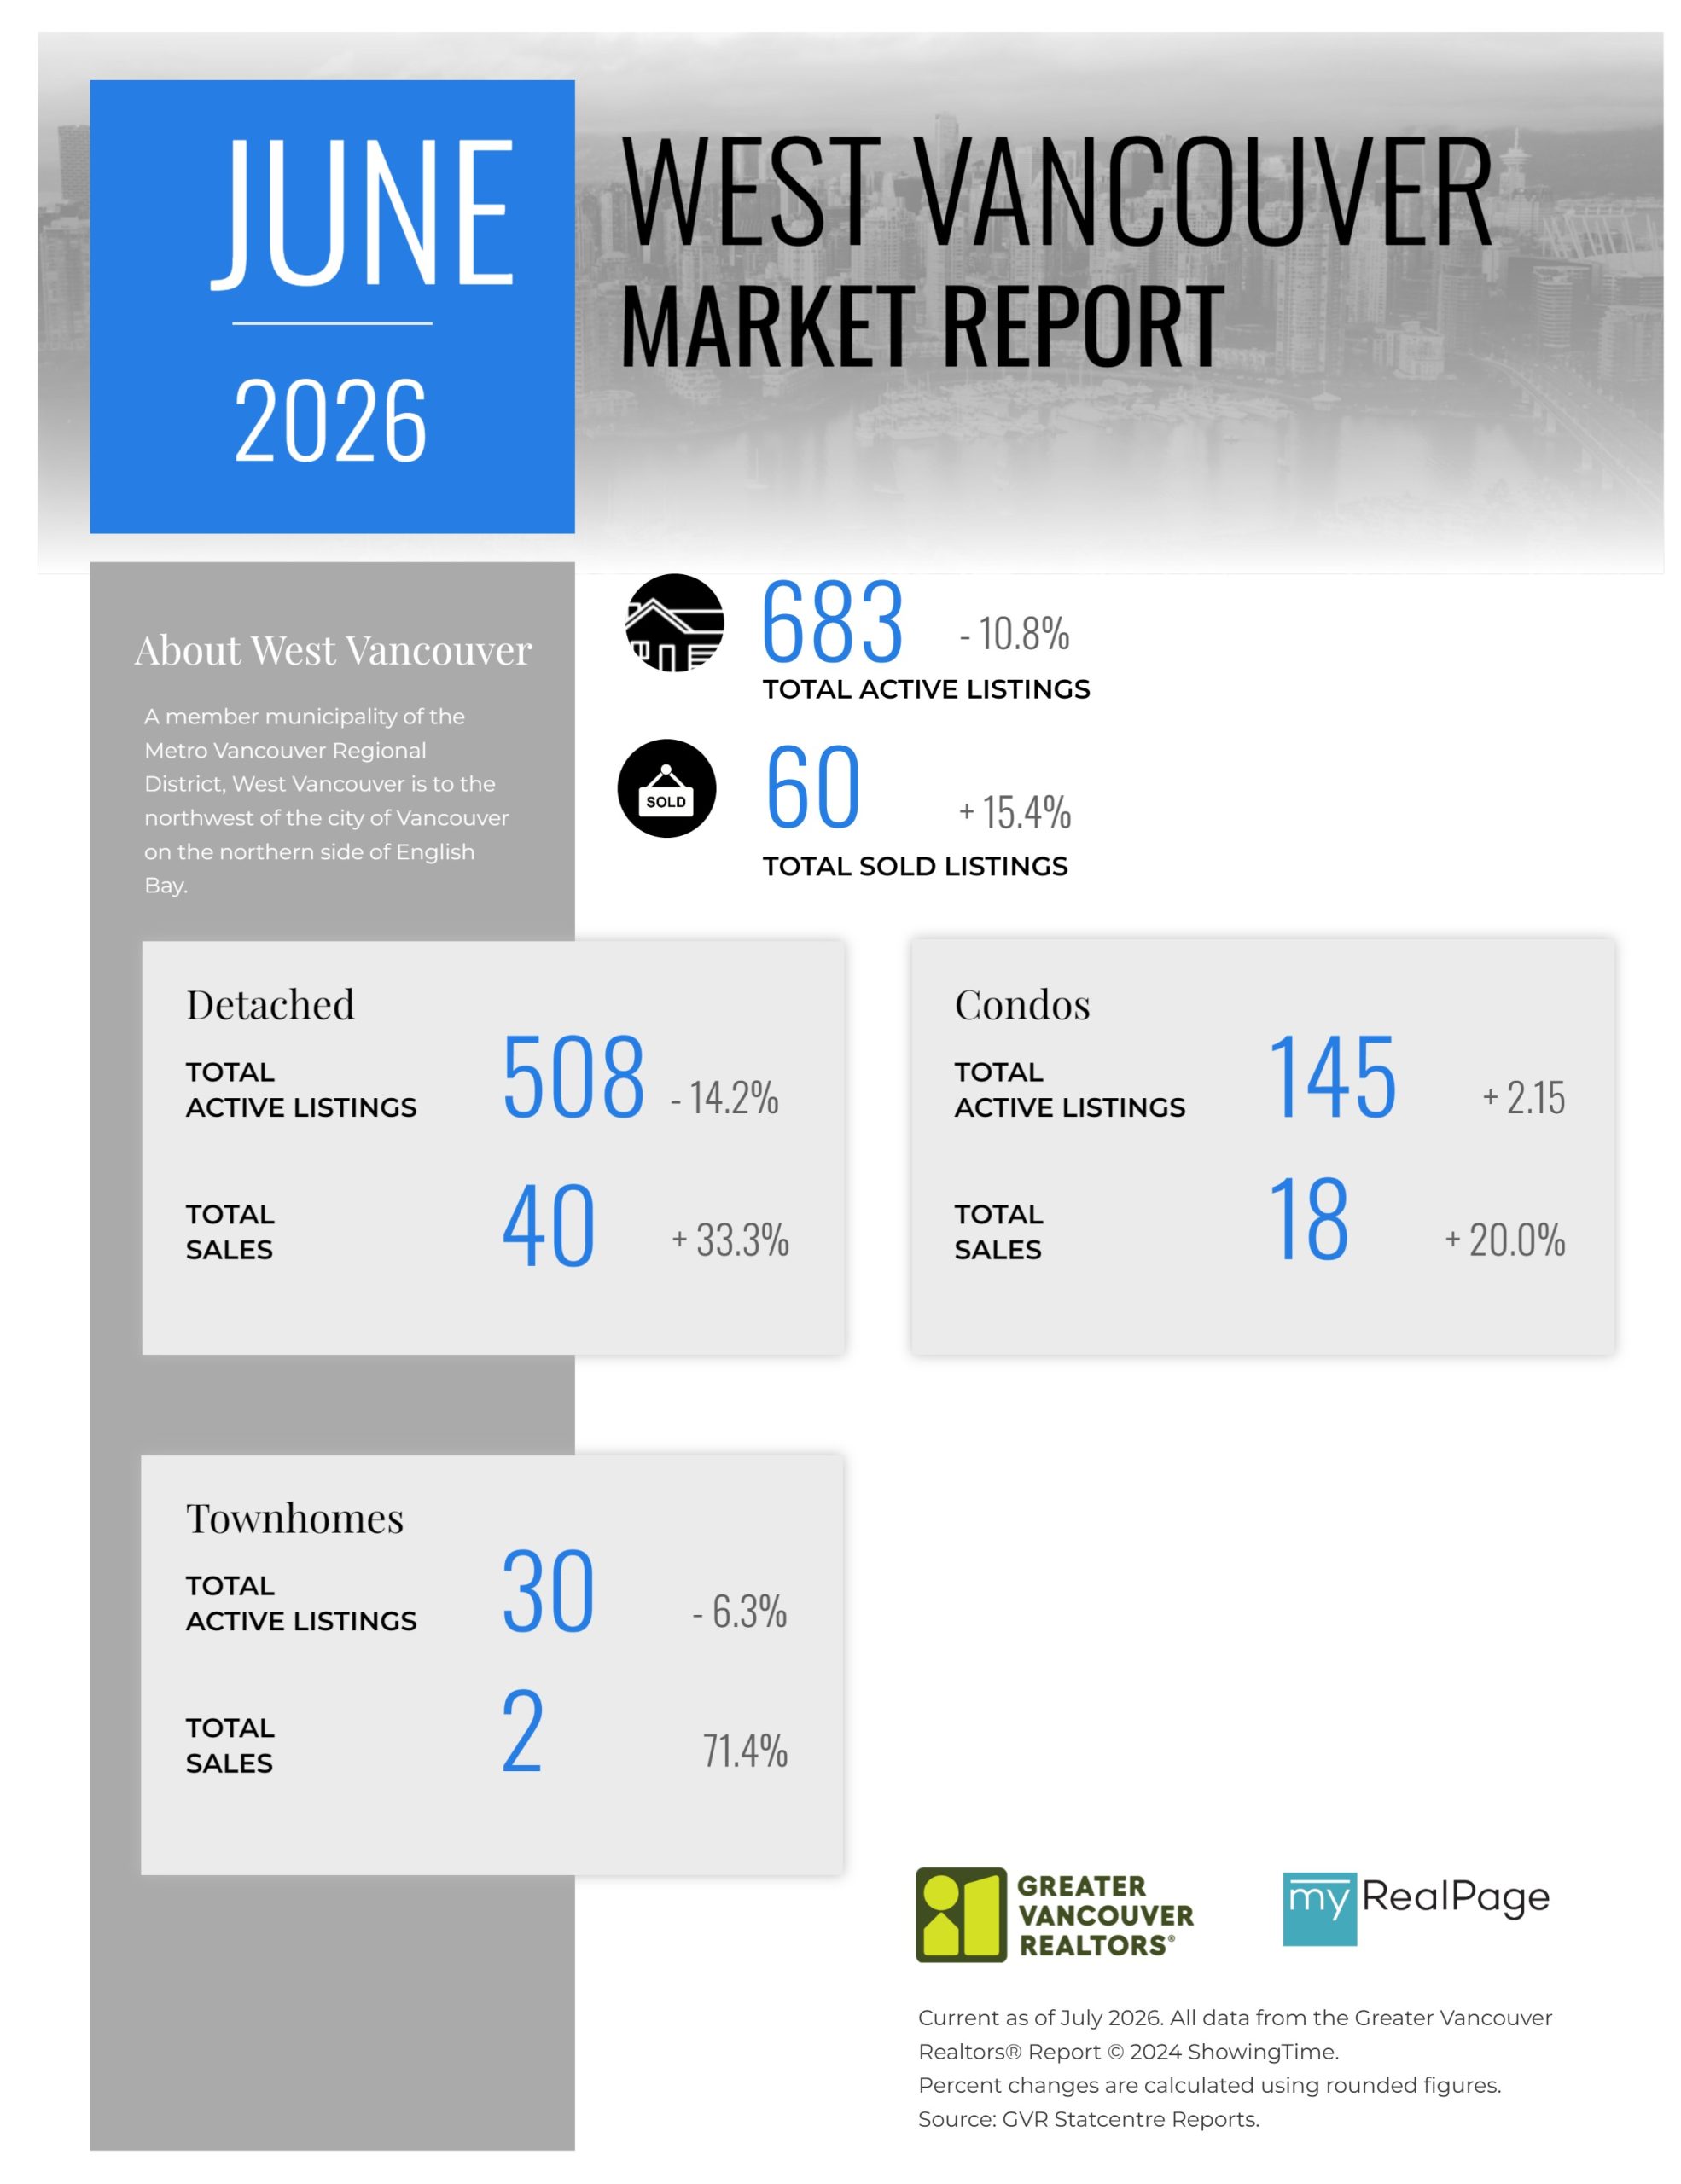
Printable Version – GVR June 2026 Data Infographics Report West Vancouver
Printable Version – GVR June 2026 Data Infographics Report Vancouver West
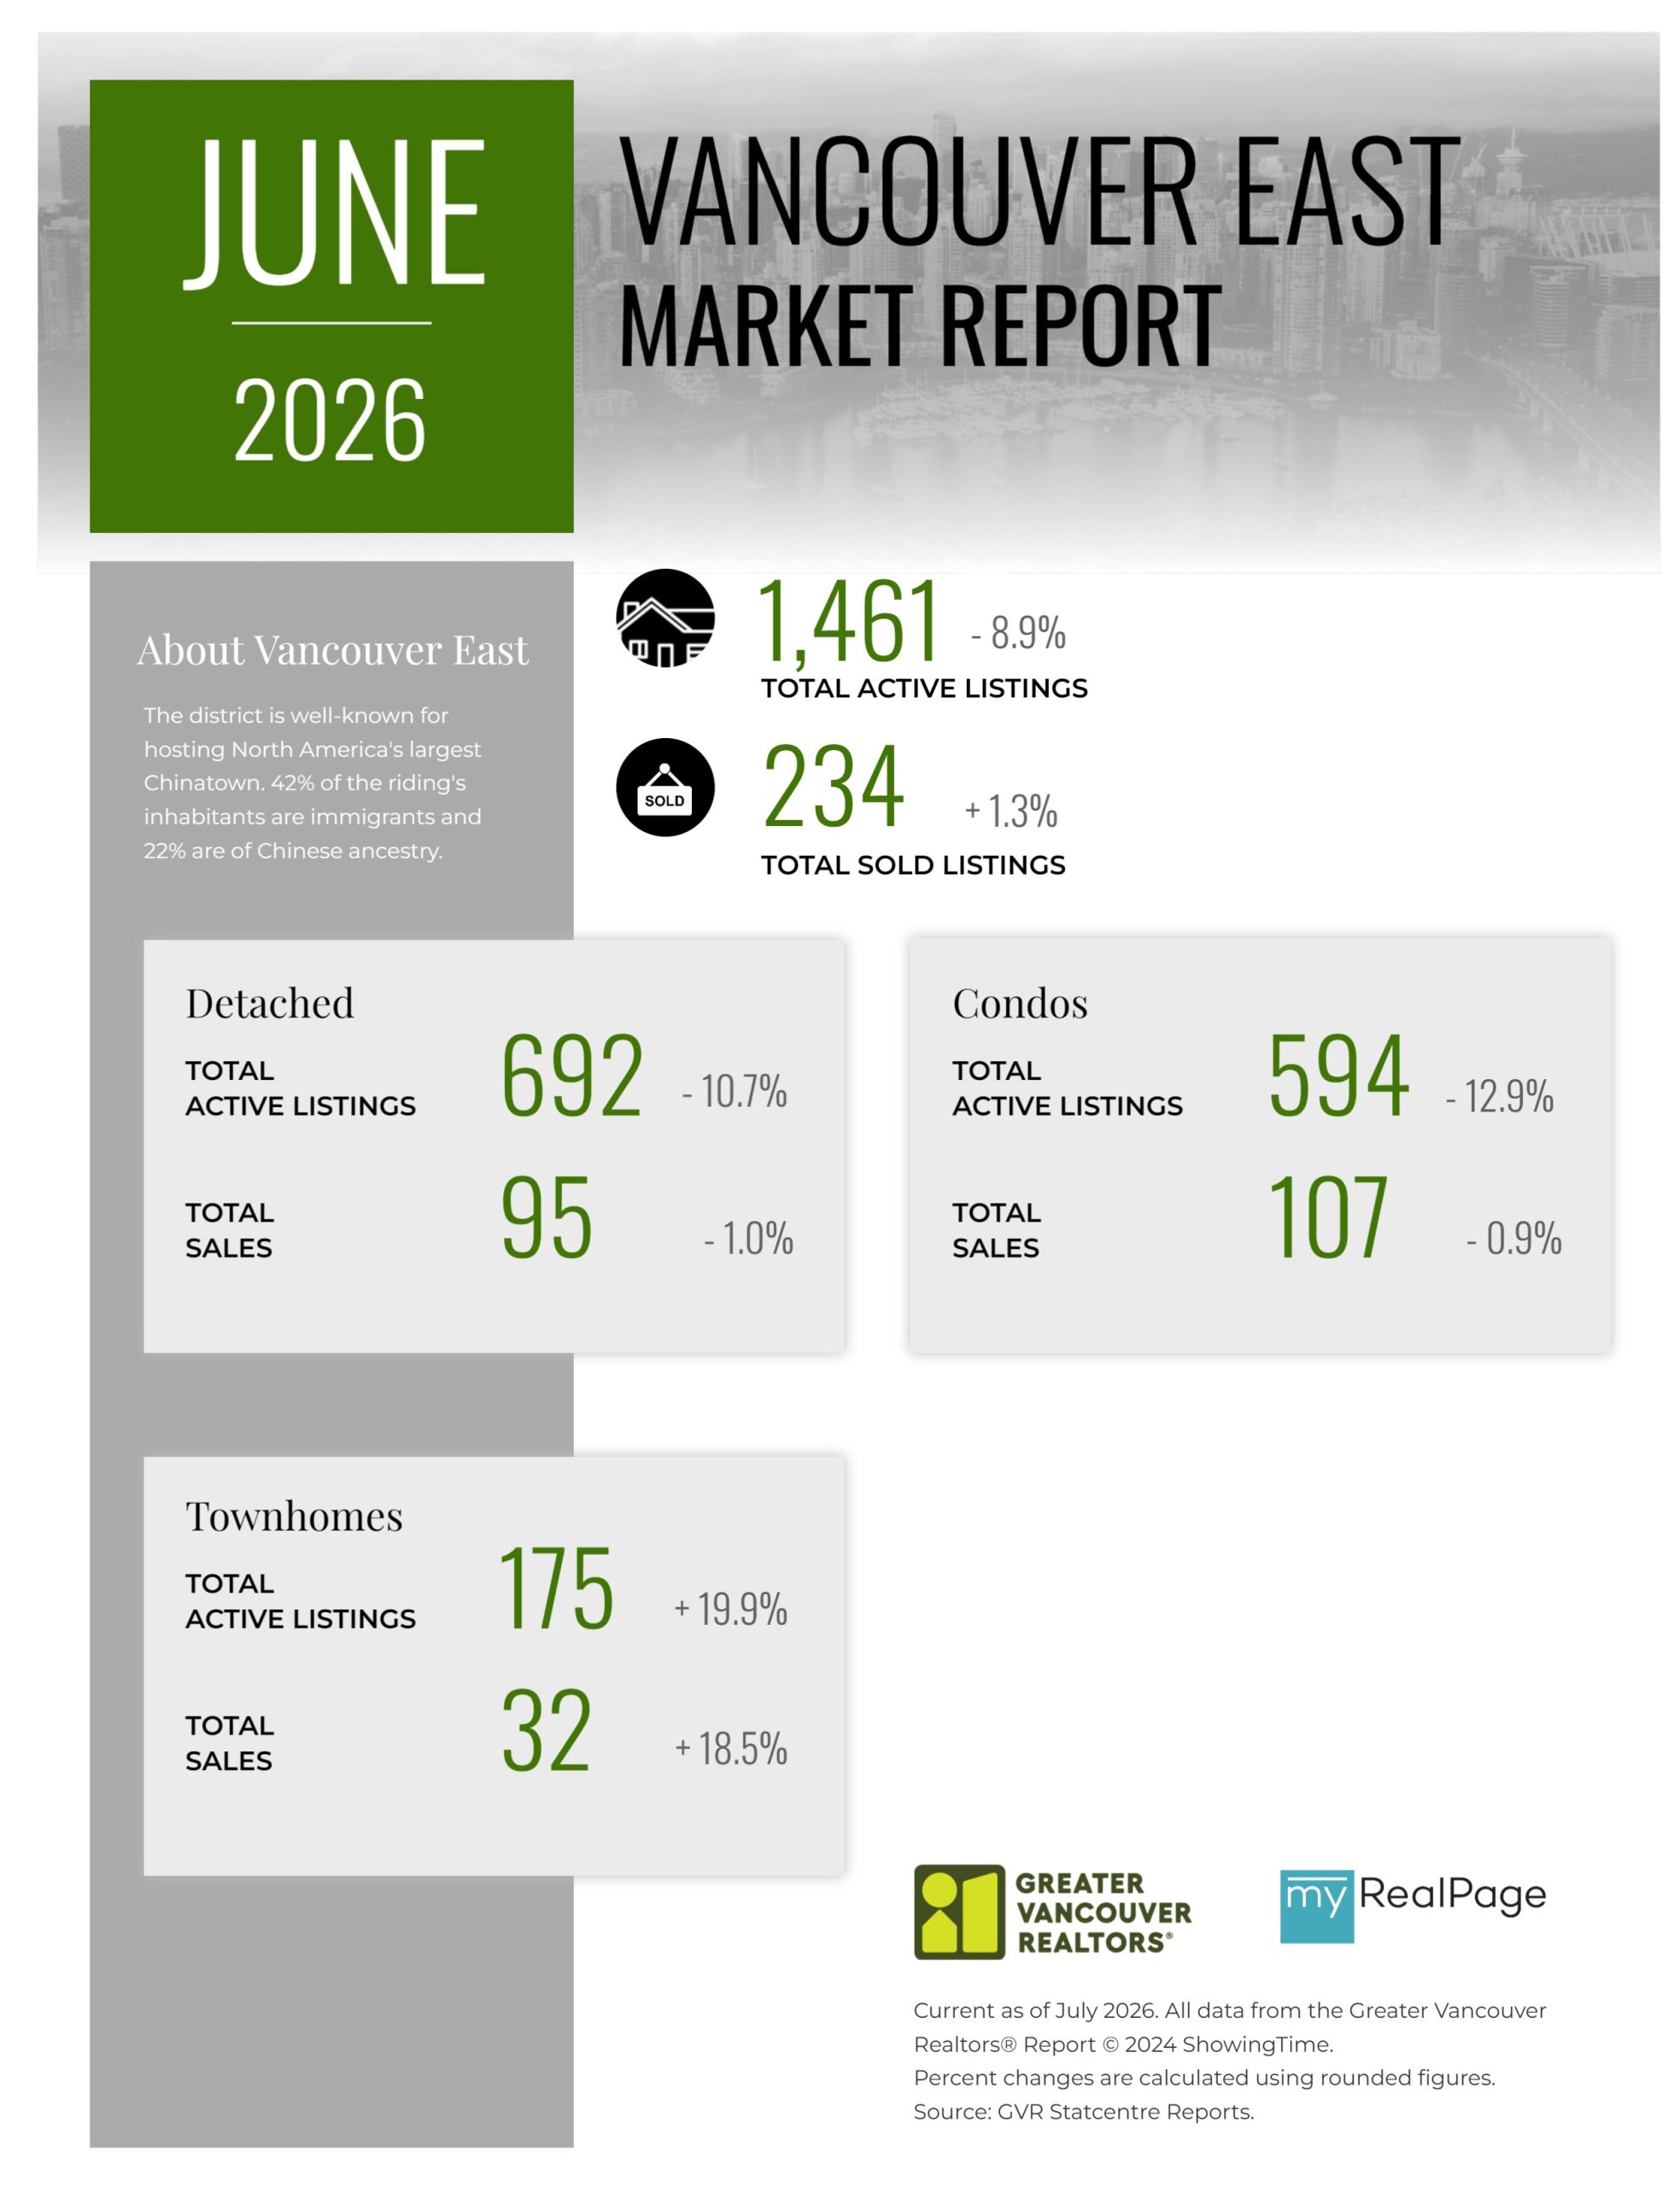
Printable Version – GVR June 2026 Data Infographics Report Vancouver East
Printable Version – GVR June 2026 Data Infographic Report Maple Ridge
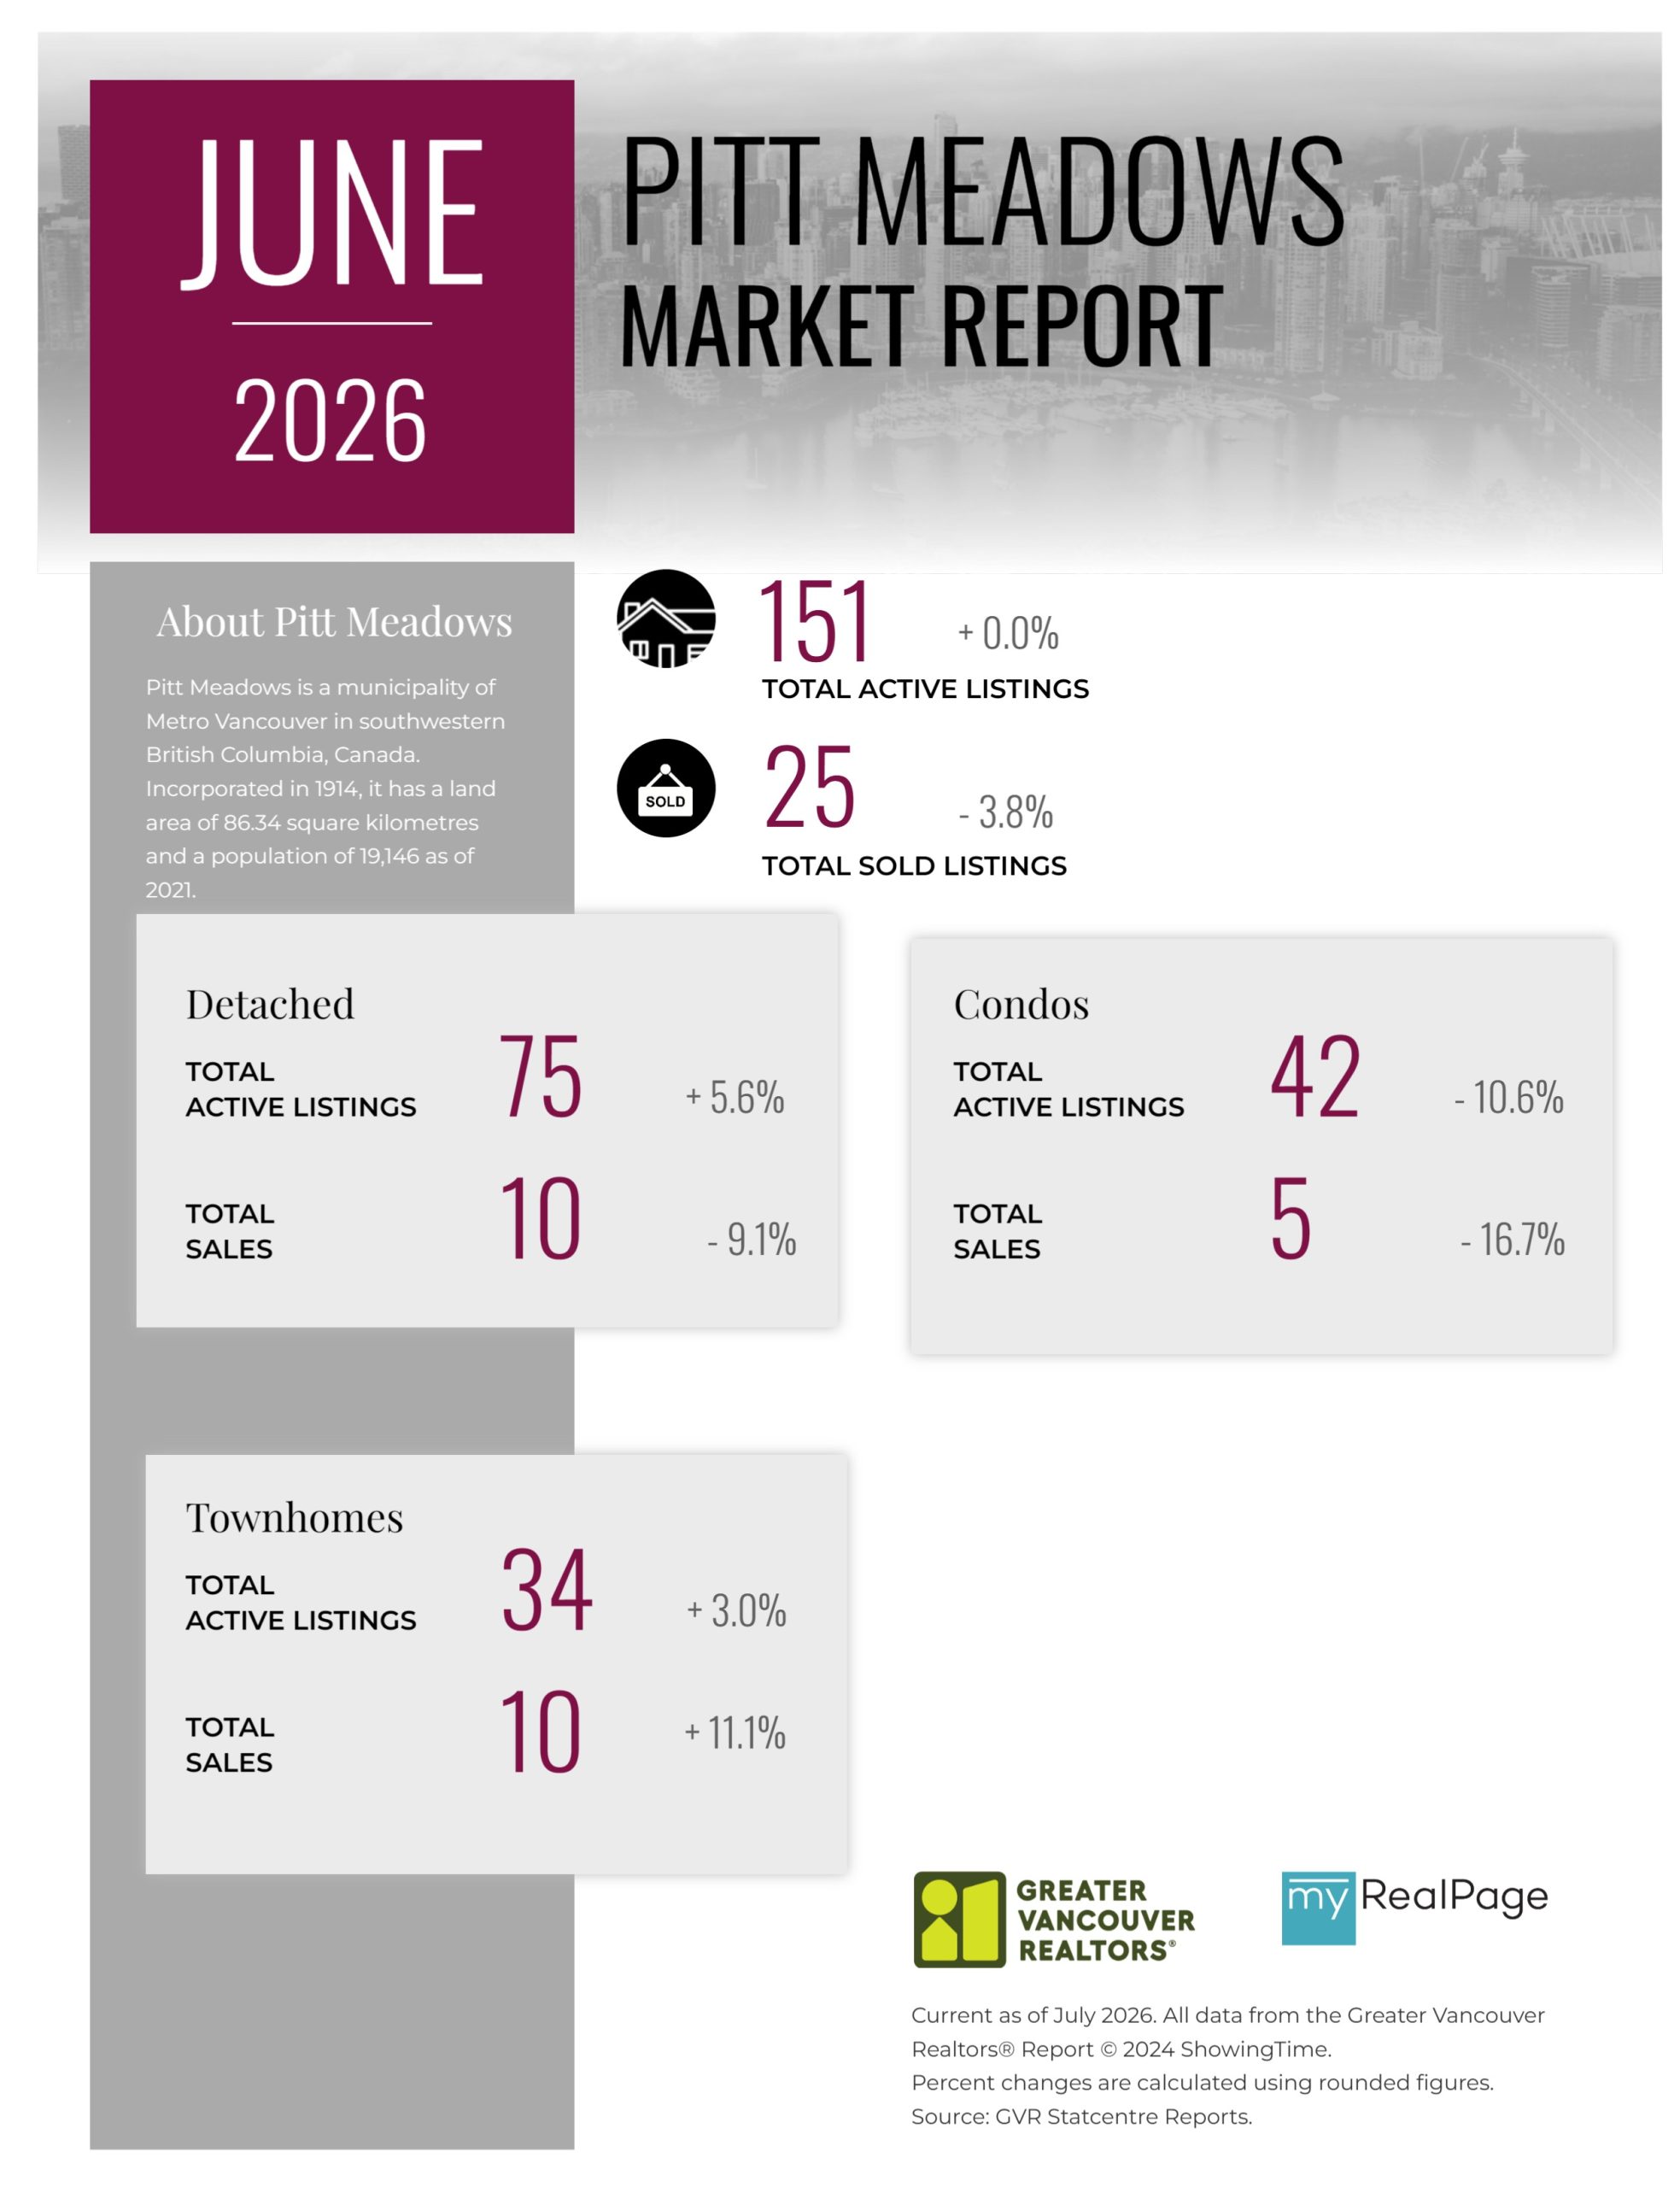
Printable Version – GVR June 2026 Data Infographics Report Pitt Meadows
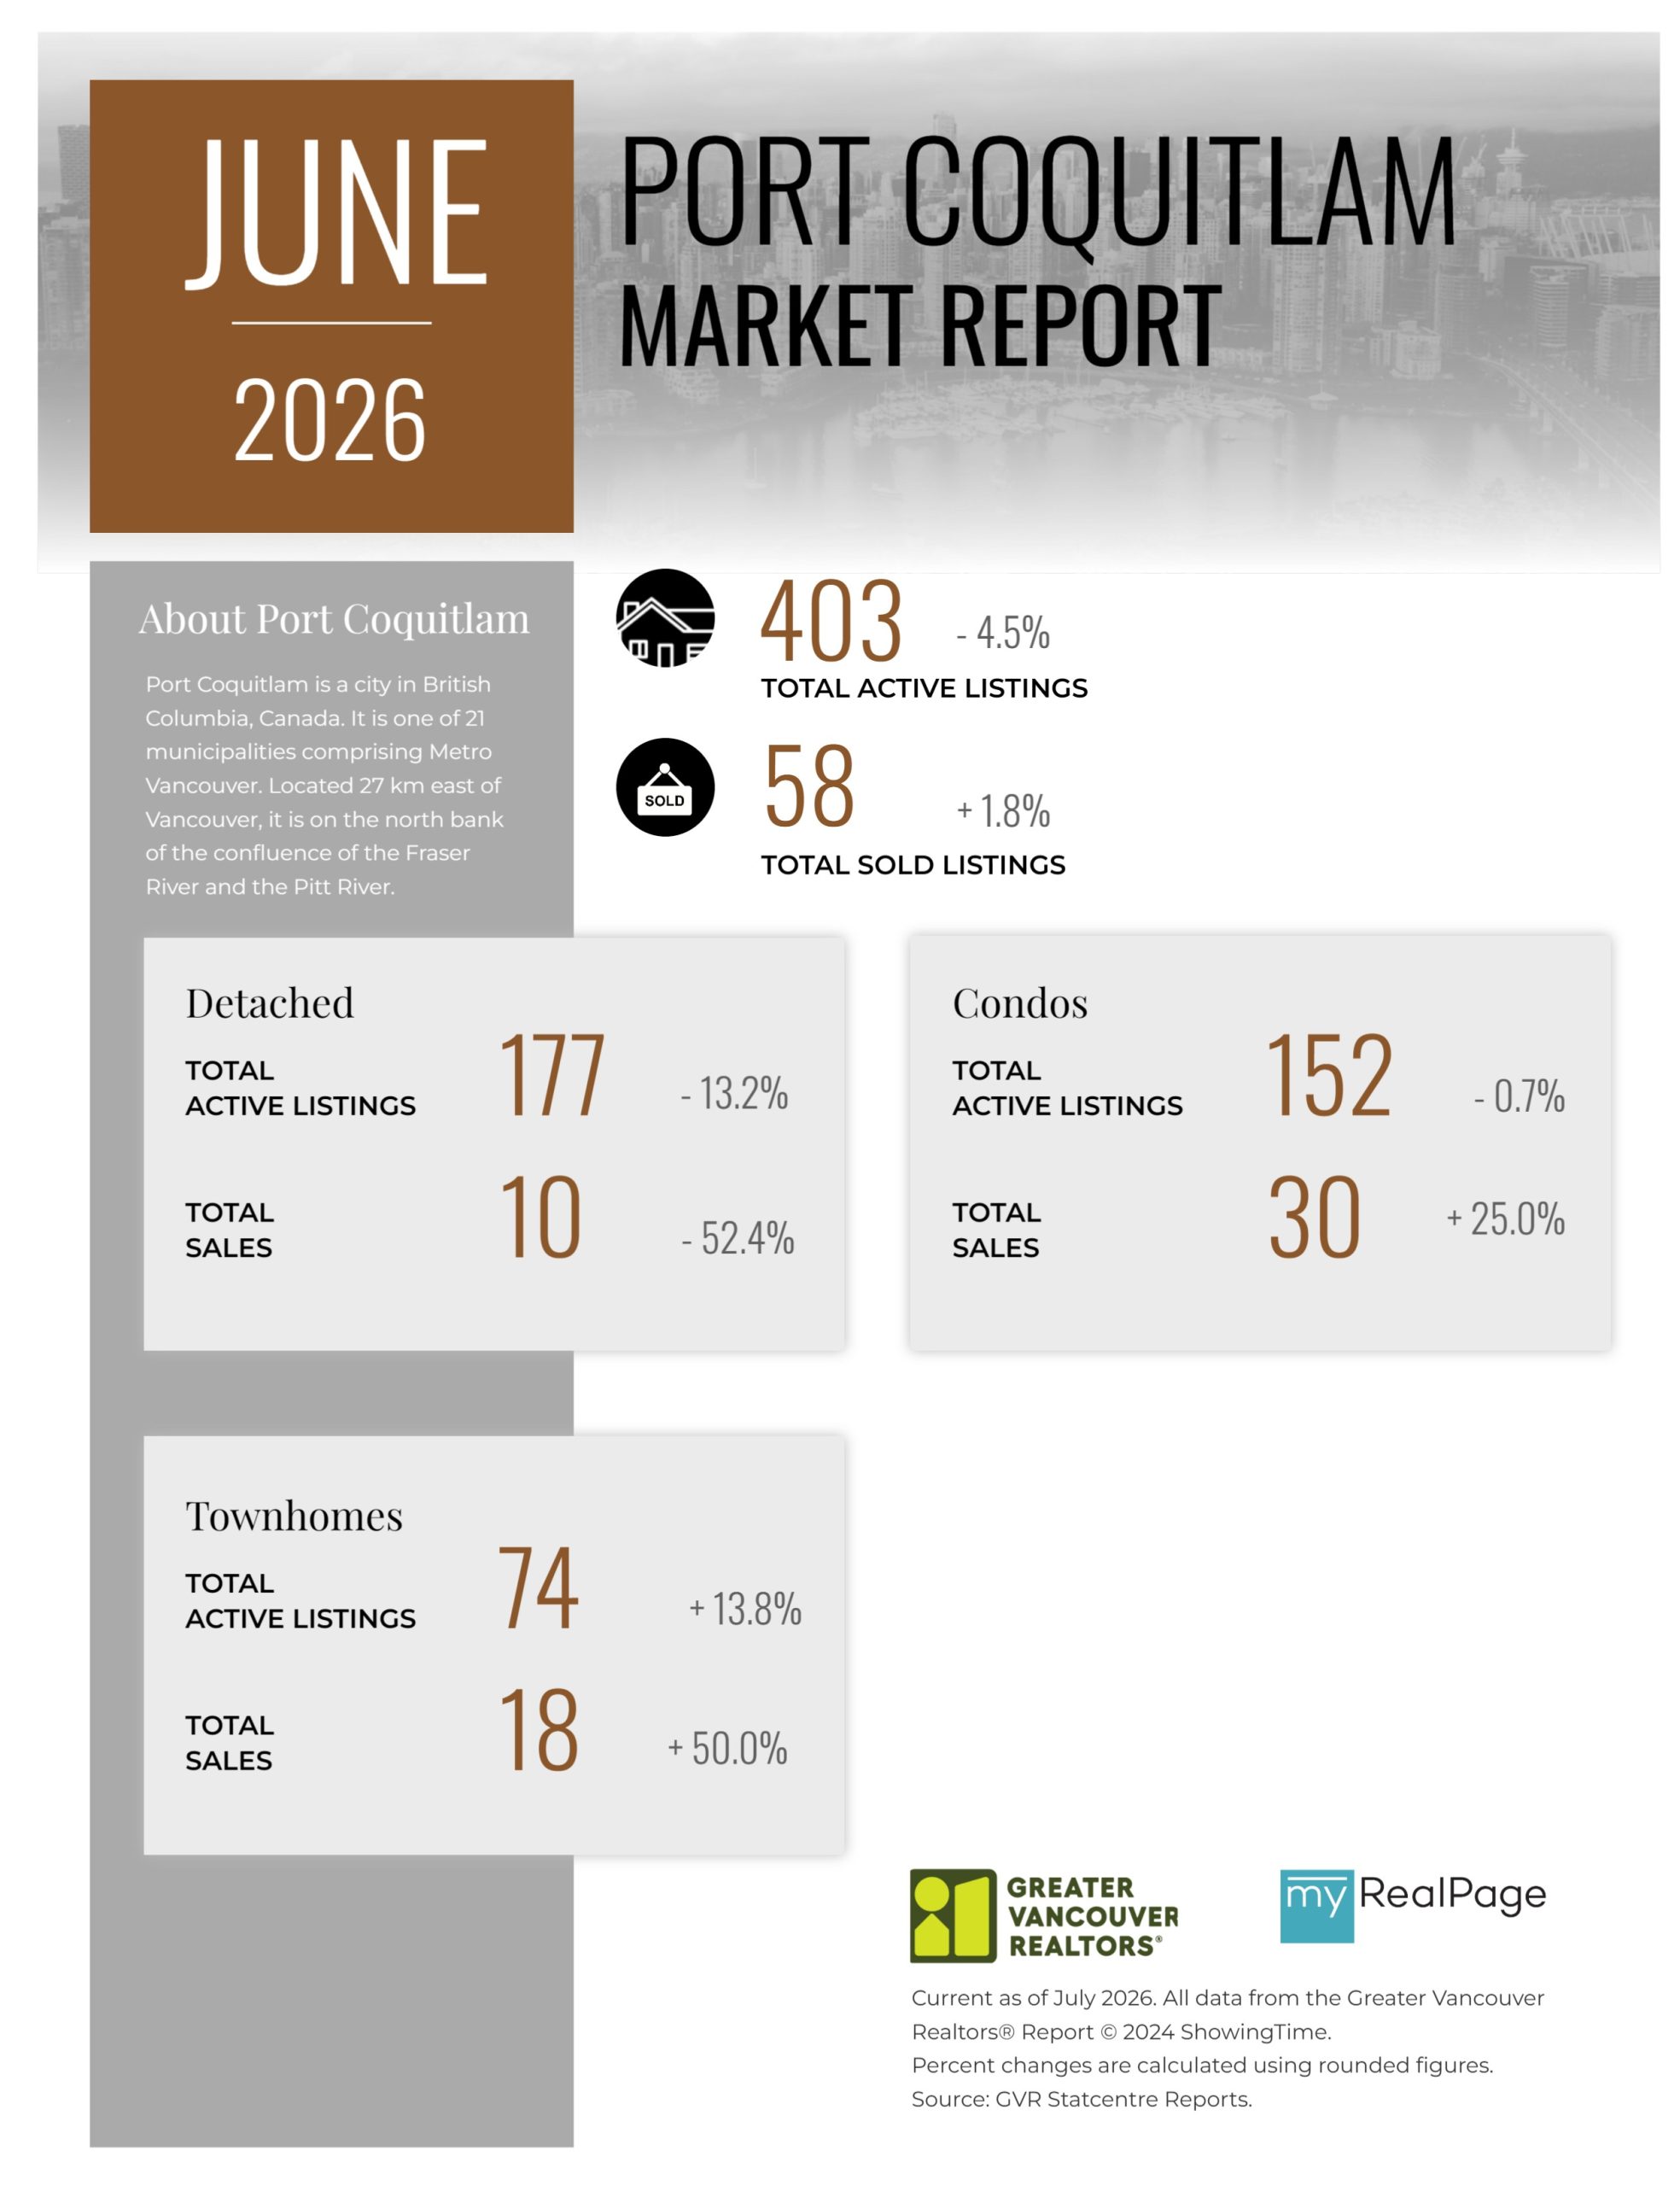
Printable Version – GVR June 2026 Data Infographics Report Port Coquitlam
Printable Version – GVR June 2026 Data Infographics Report Coquitlam
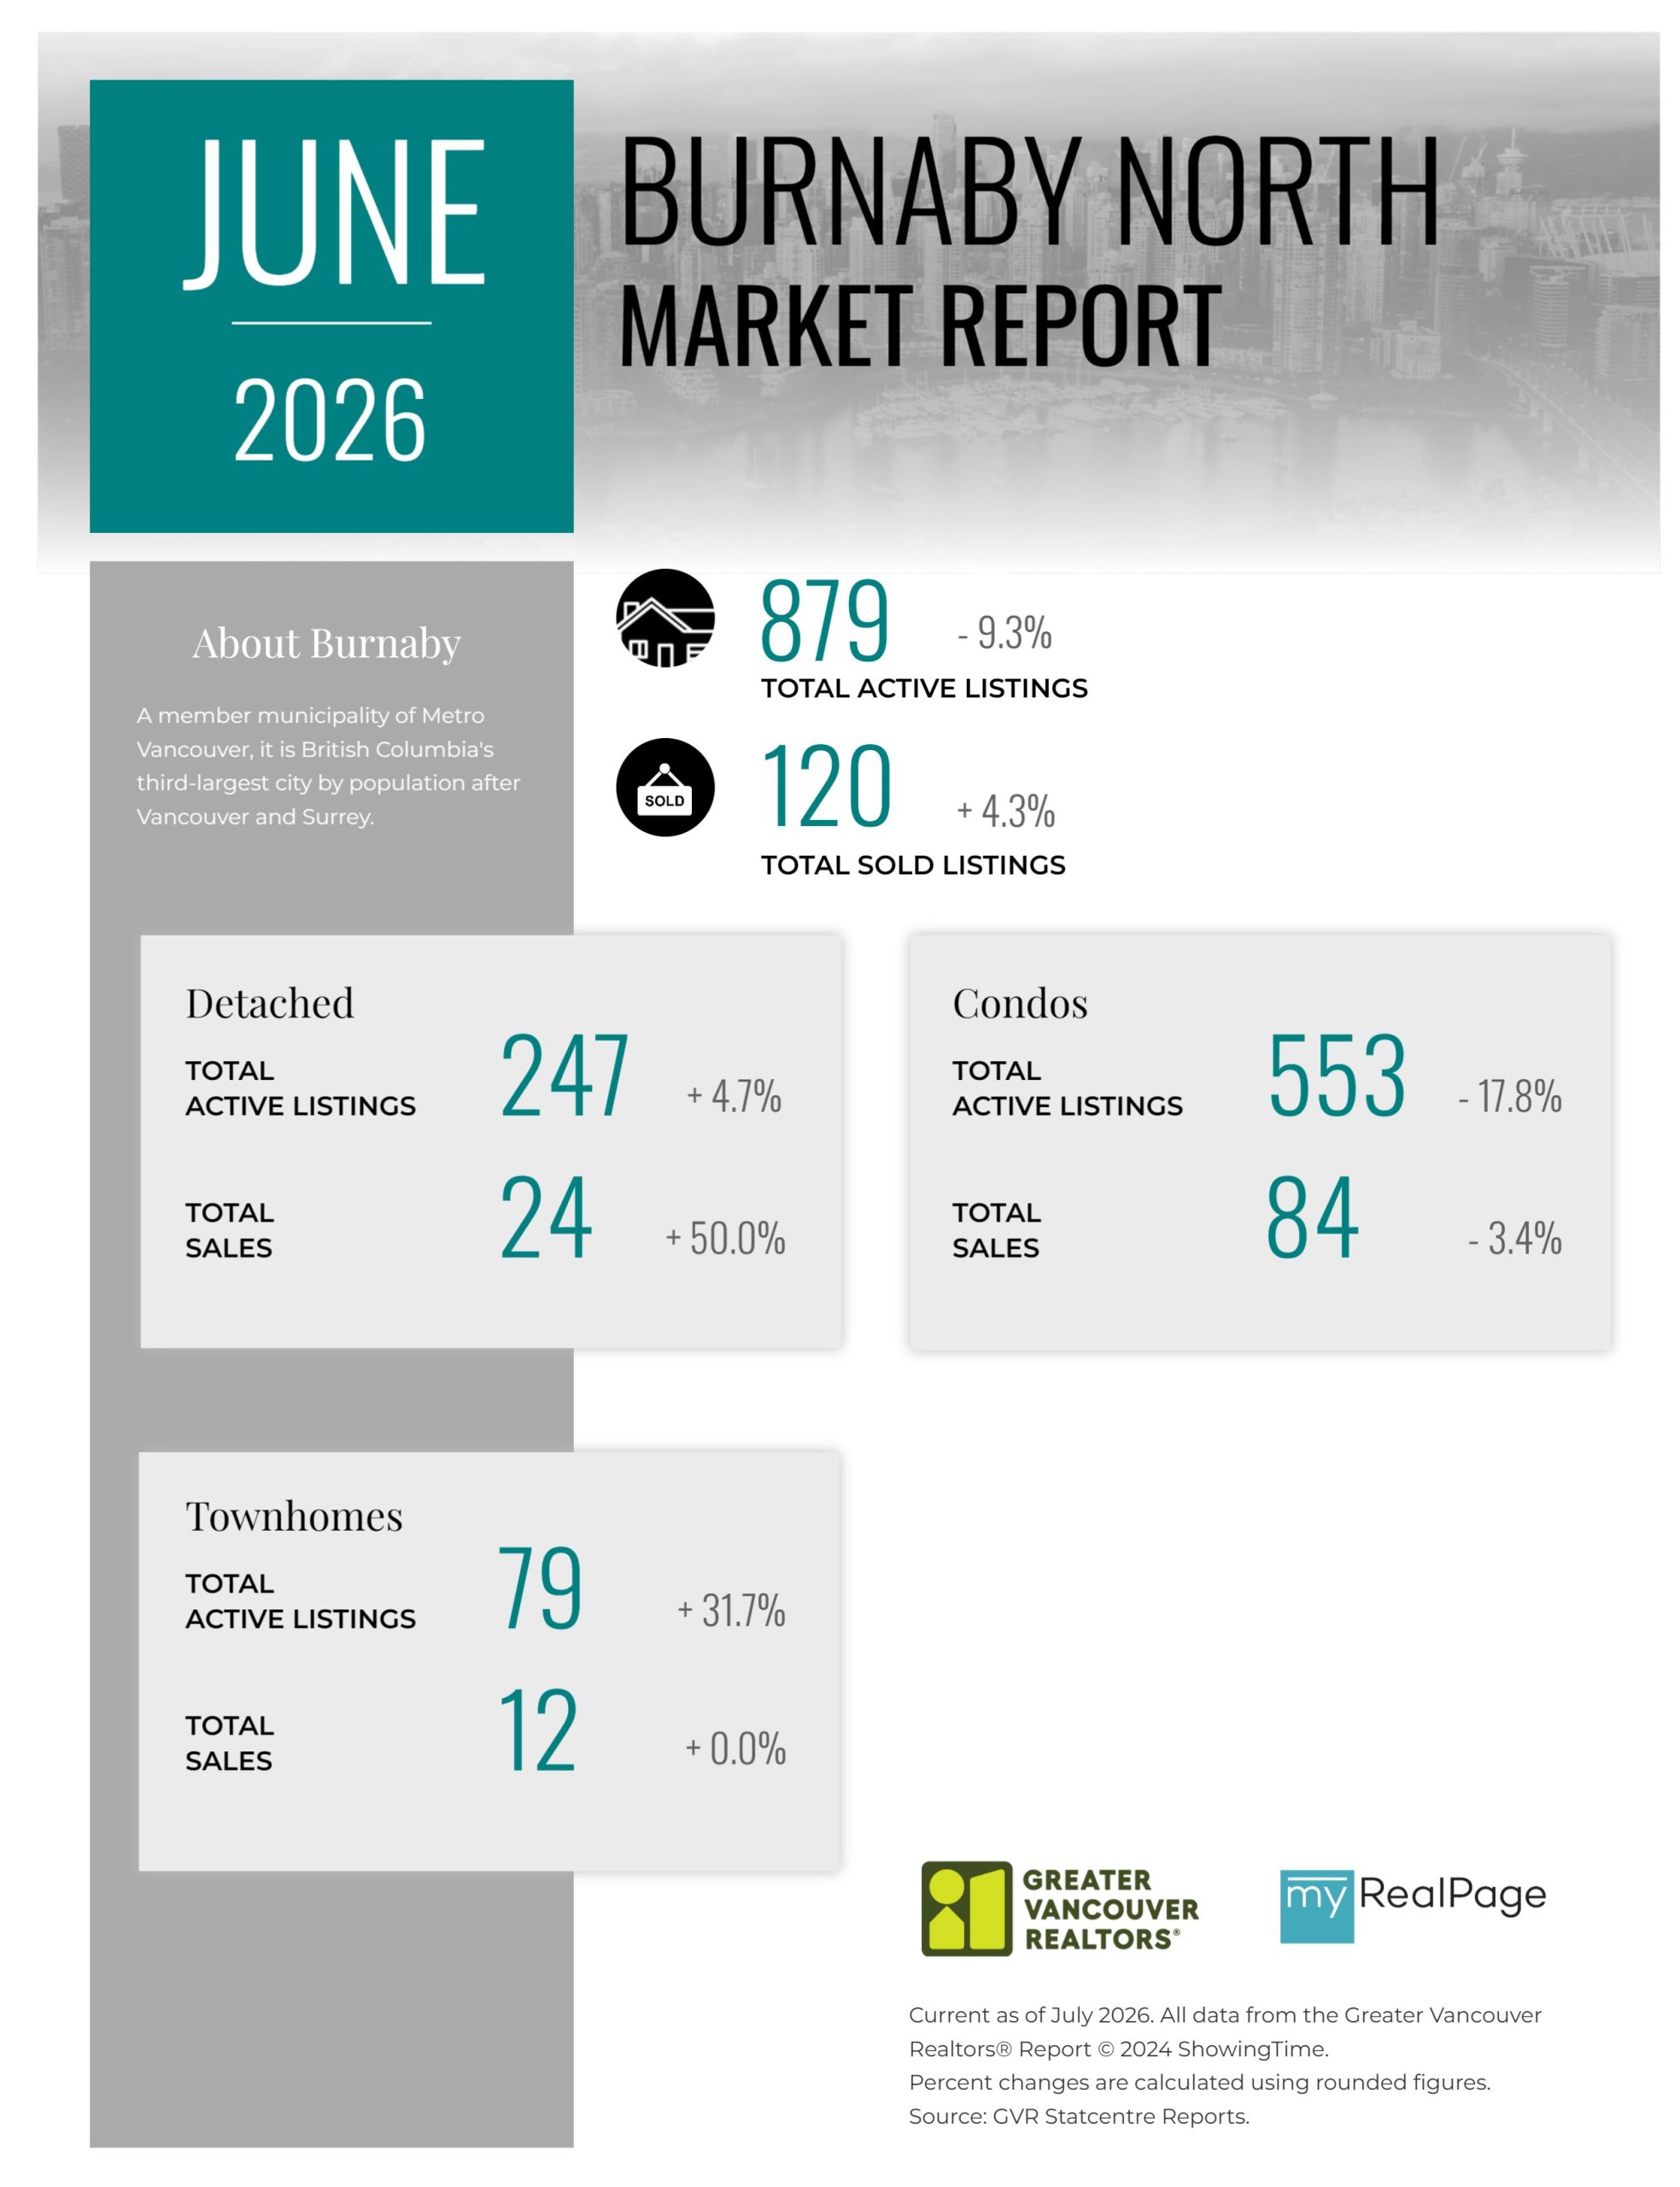
Printable Version – GVR June 2026 Data Infographic Report Burnaby North
Printable Version – GVR June 2026 Data Infographics Report Burnaby South
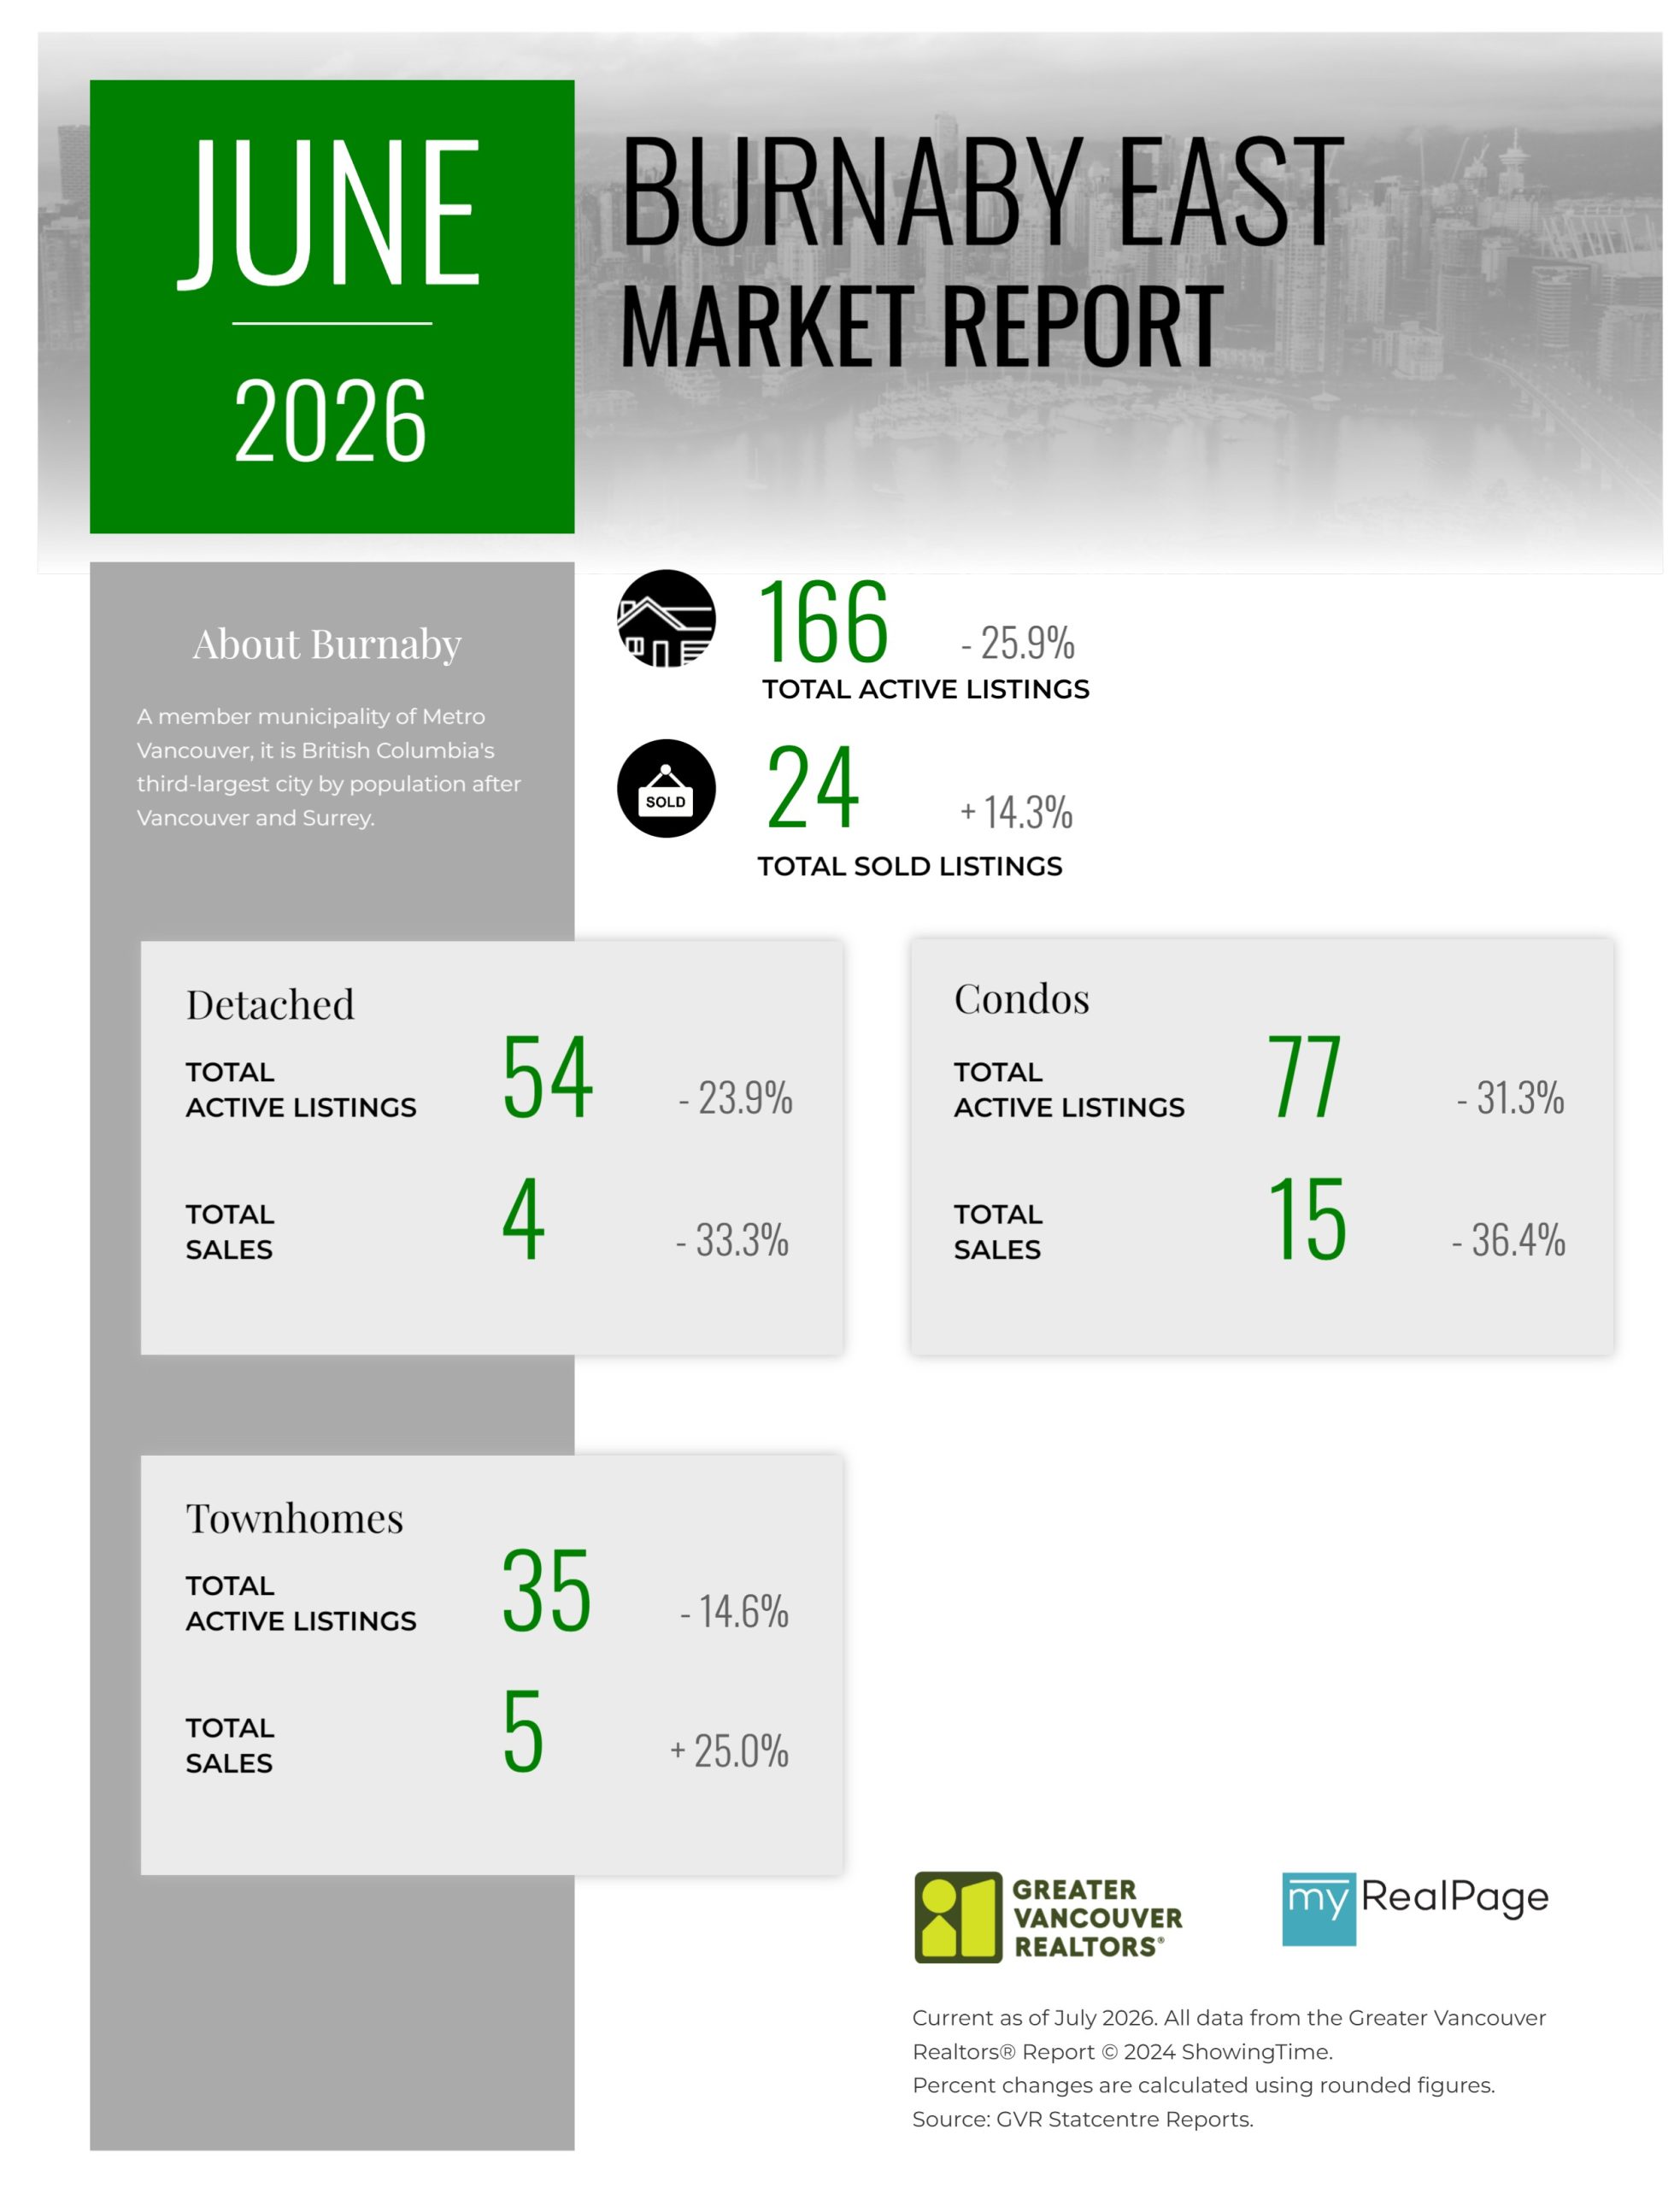
Printable Version – GVR June 2026 Data Infographics Report Burnaby East
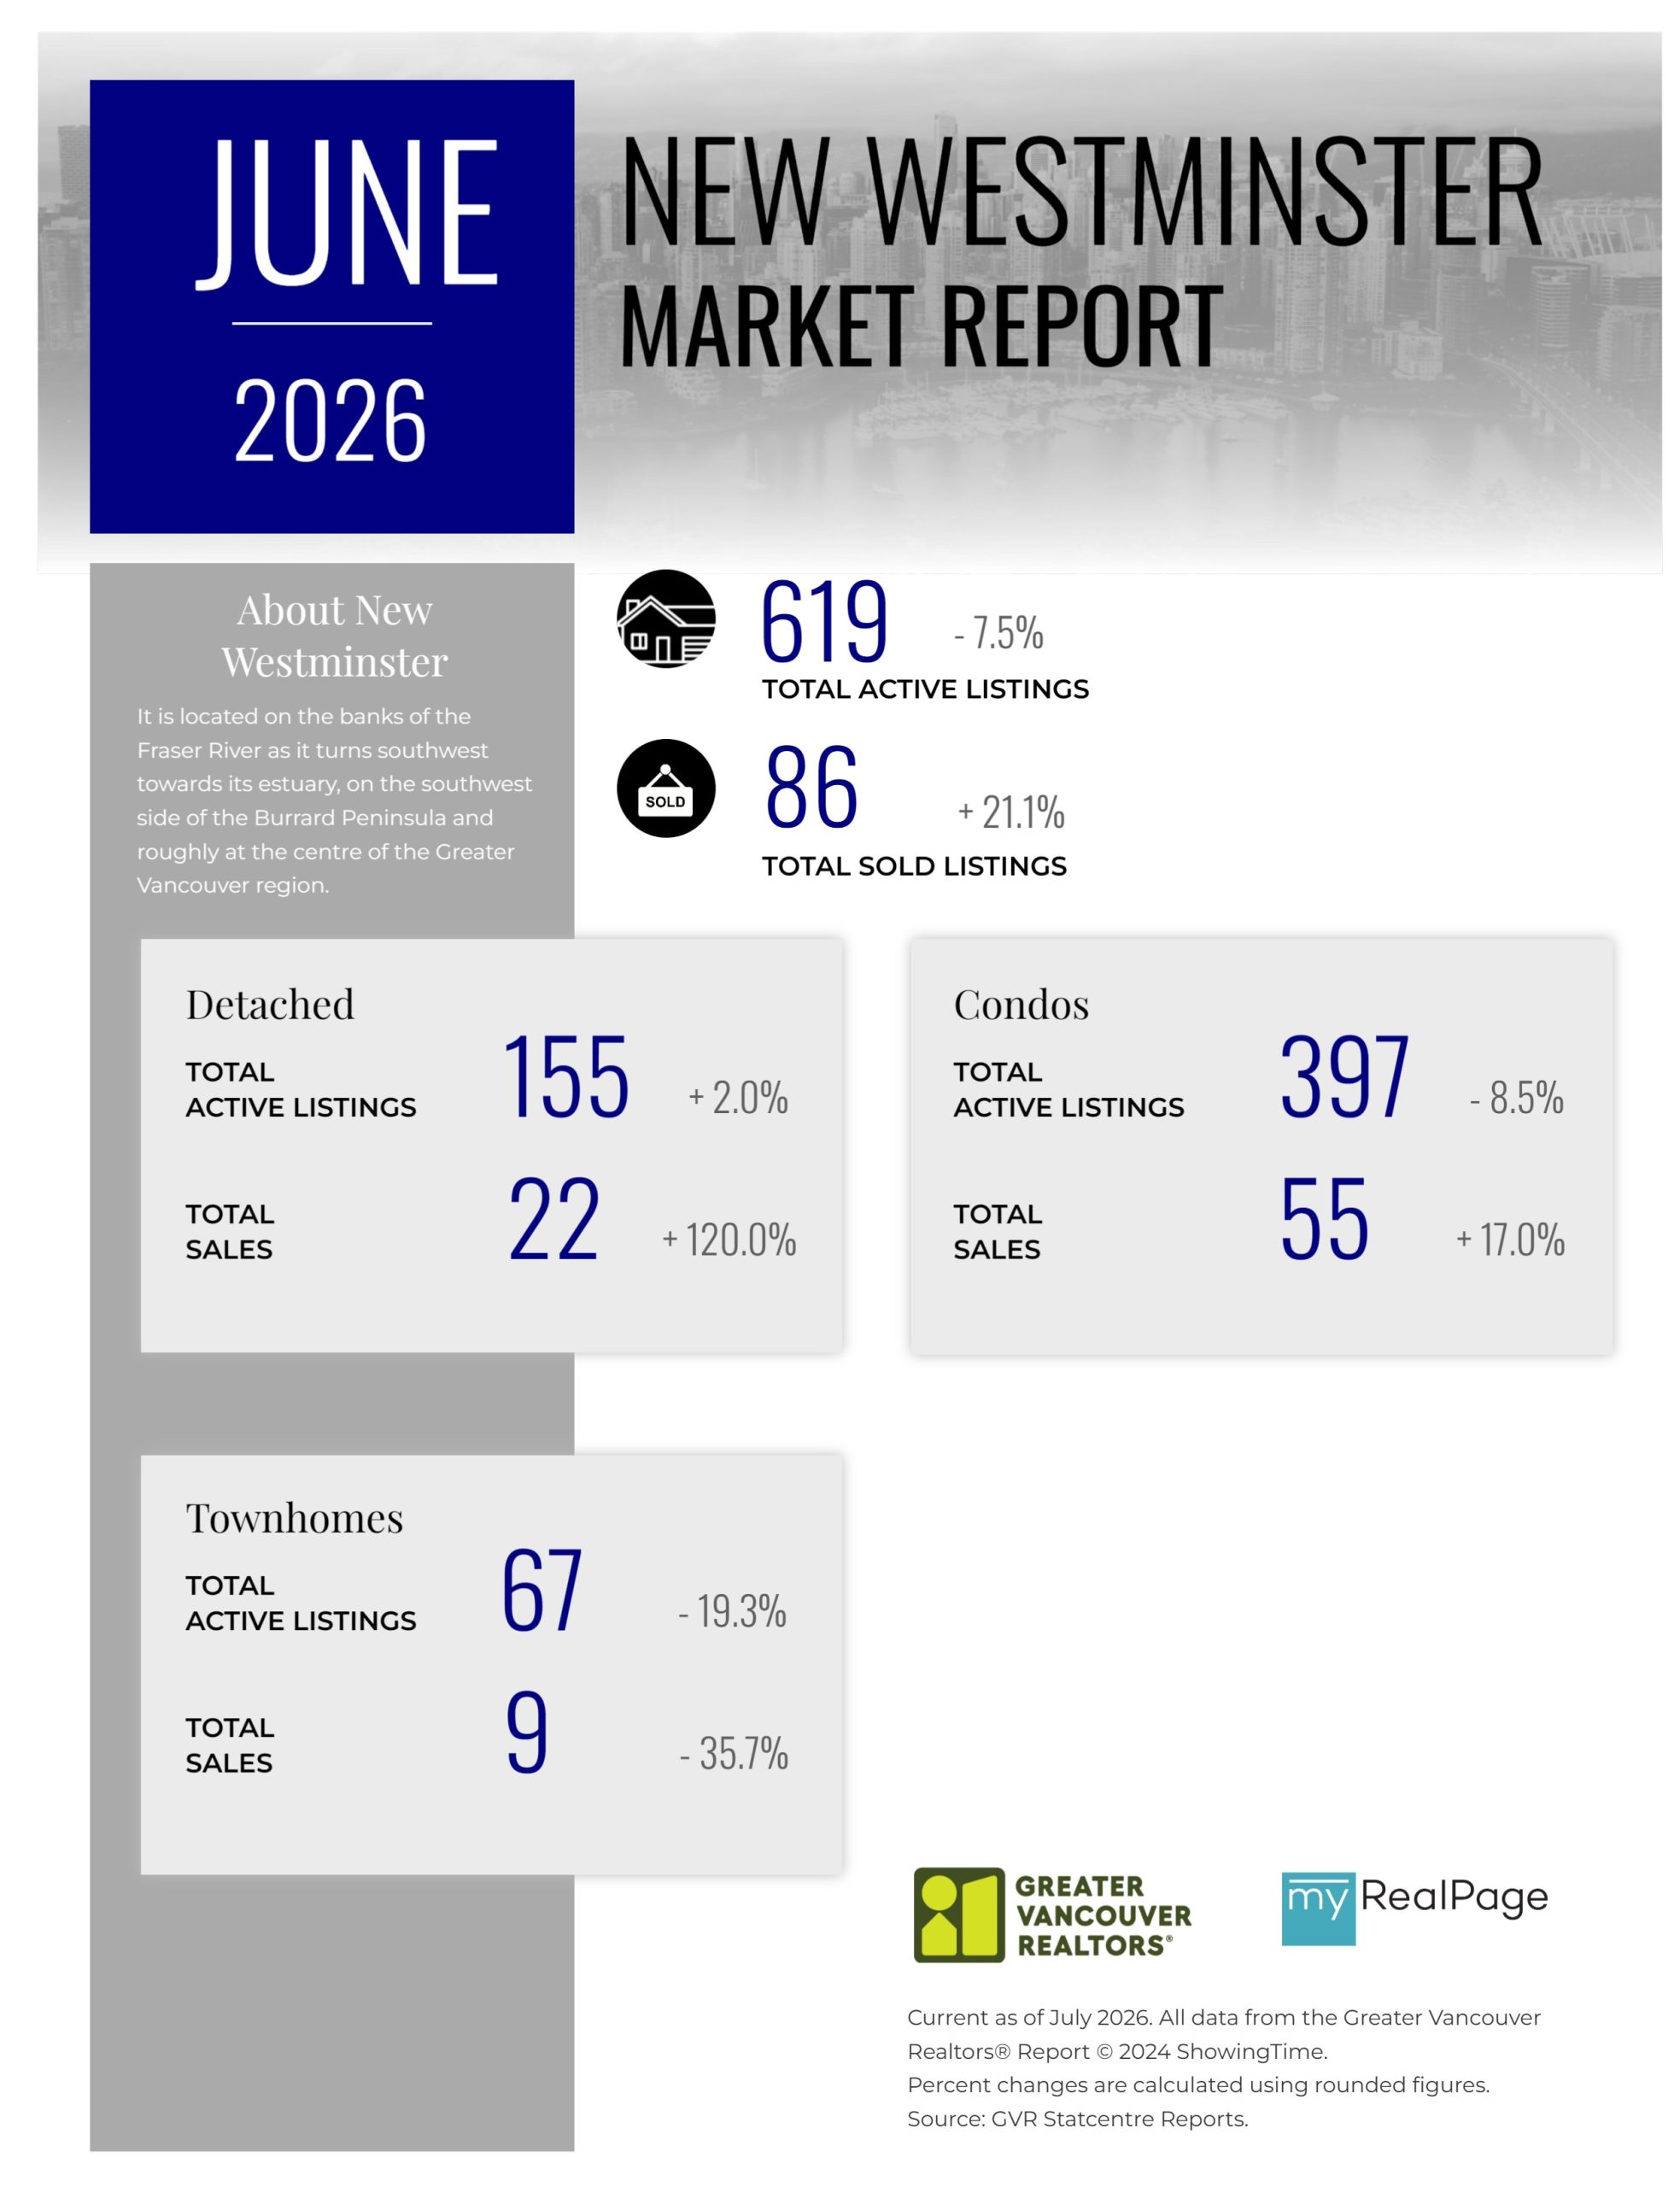
Printable Version – GVR June 2026 Data Infographics Report New Westminster
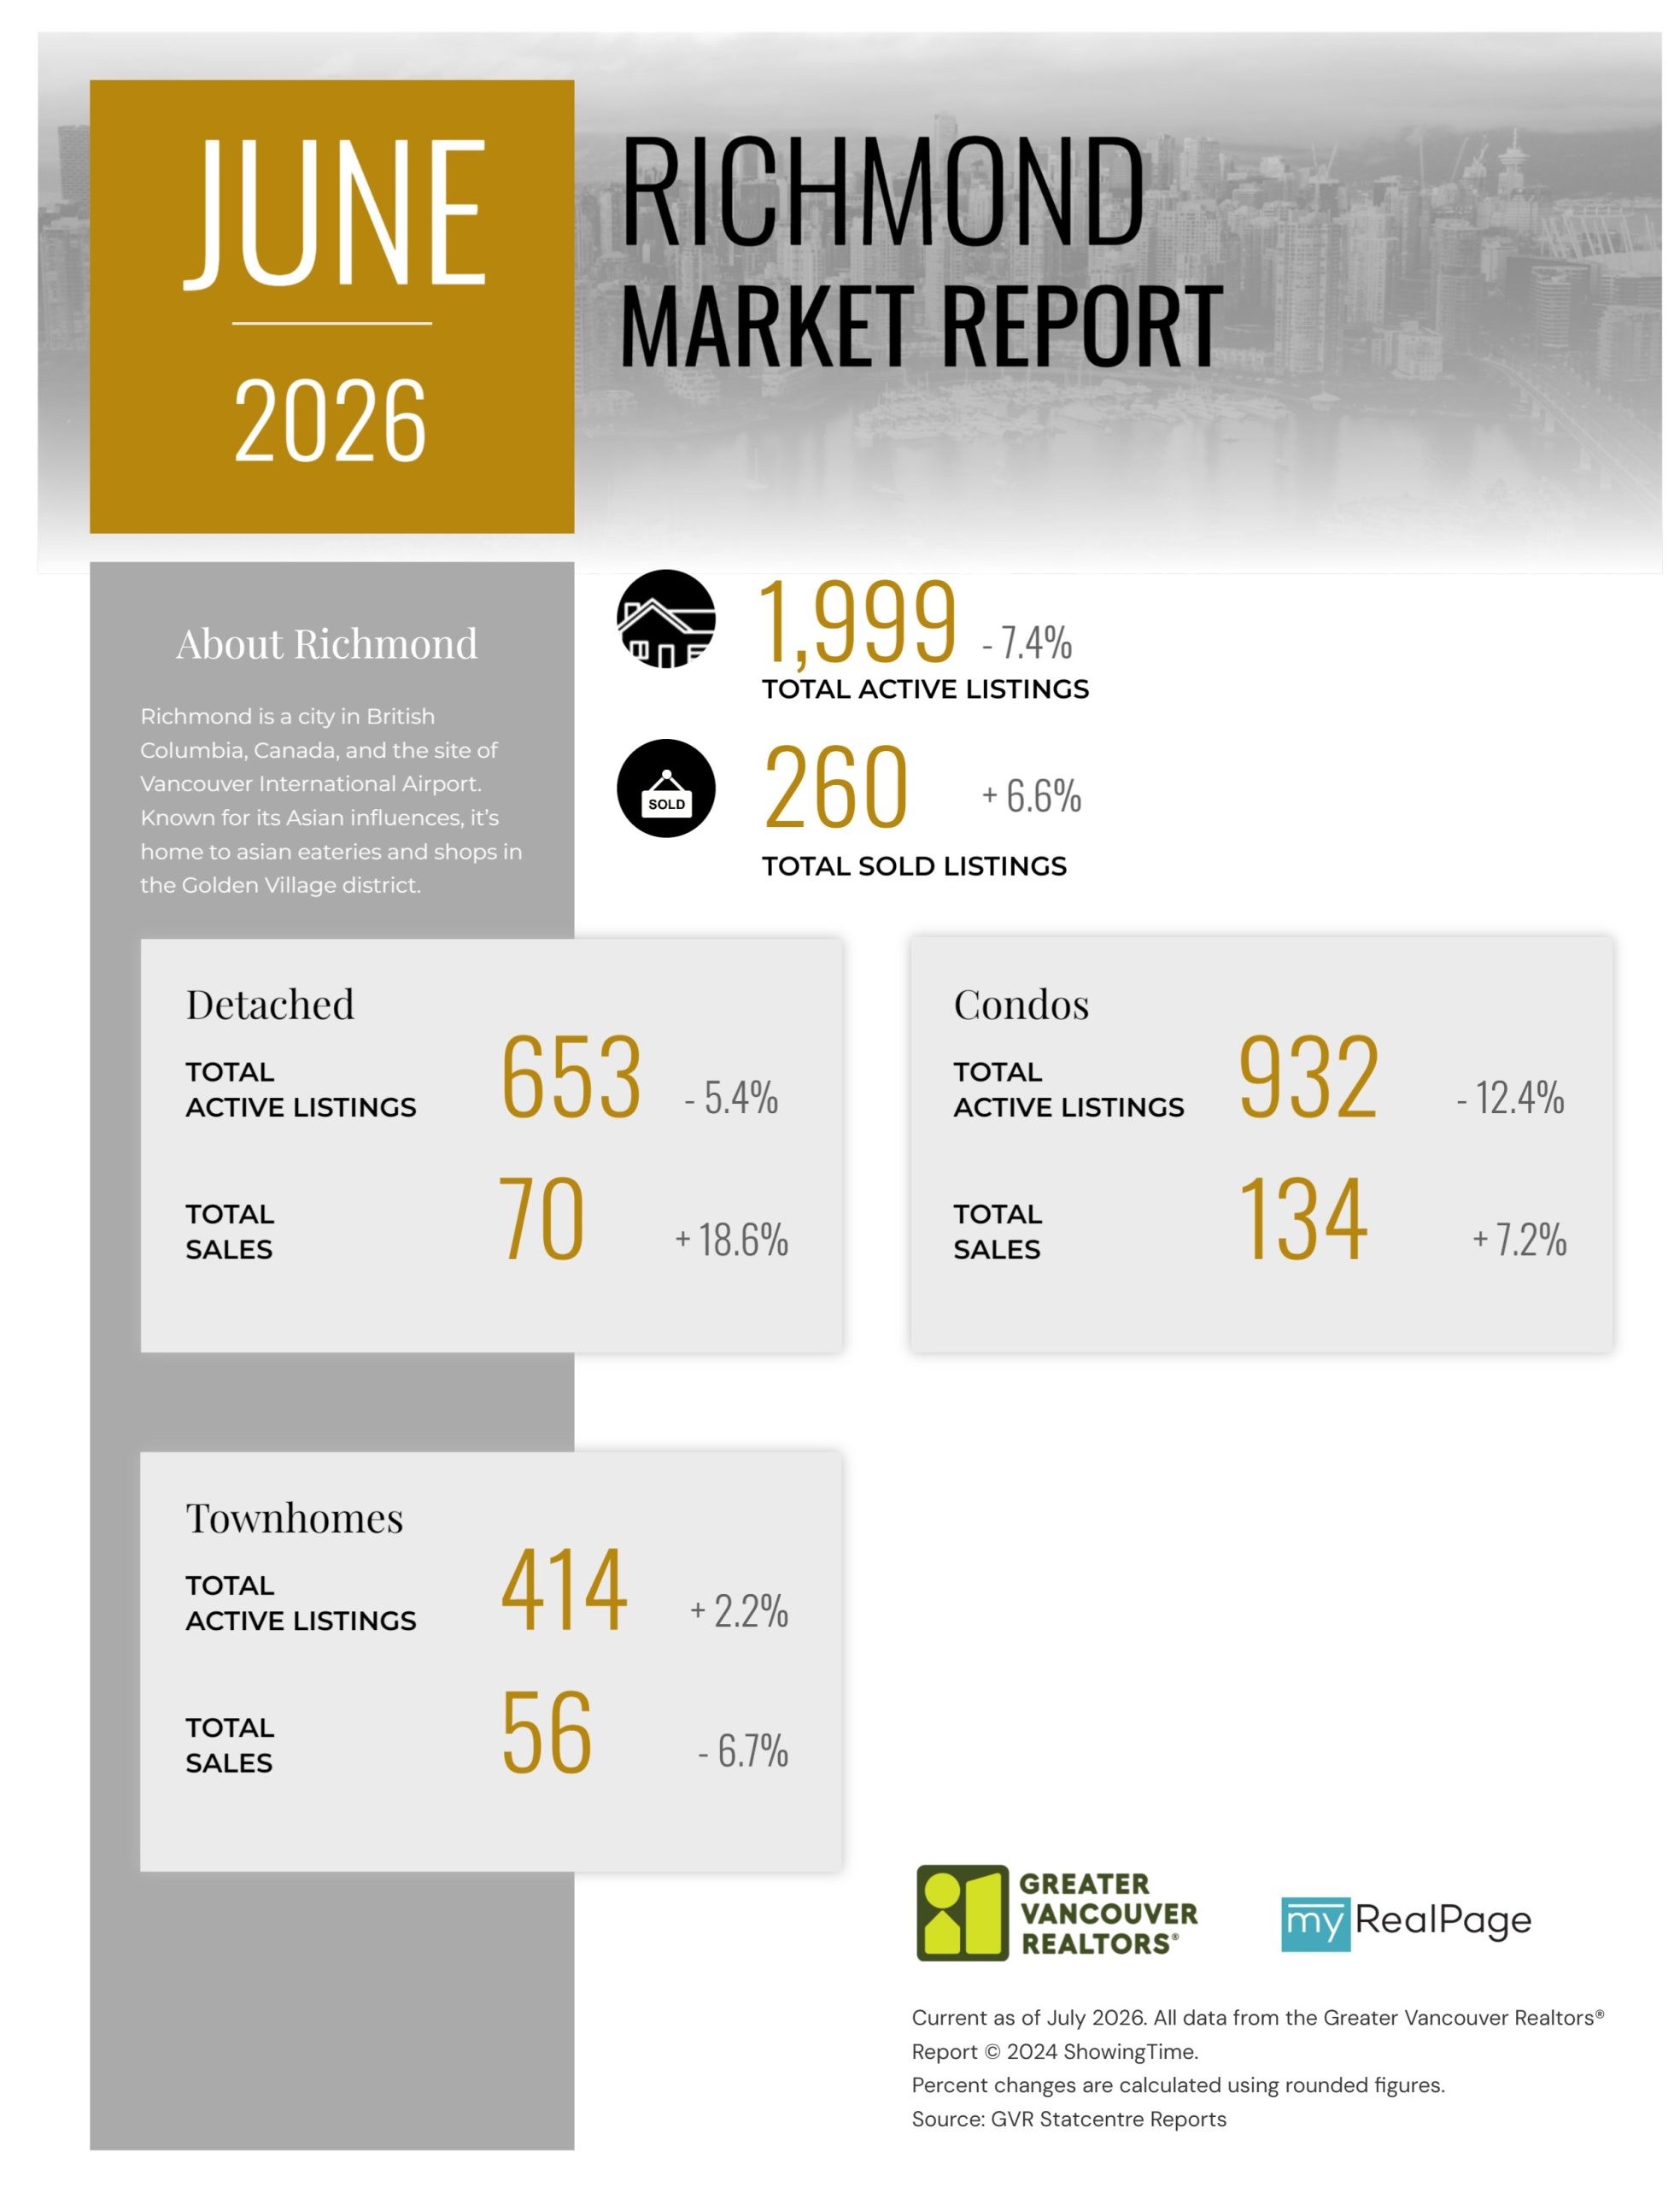
Printable Version – GVR June 2026 Data Infographics Report Richmond
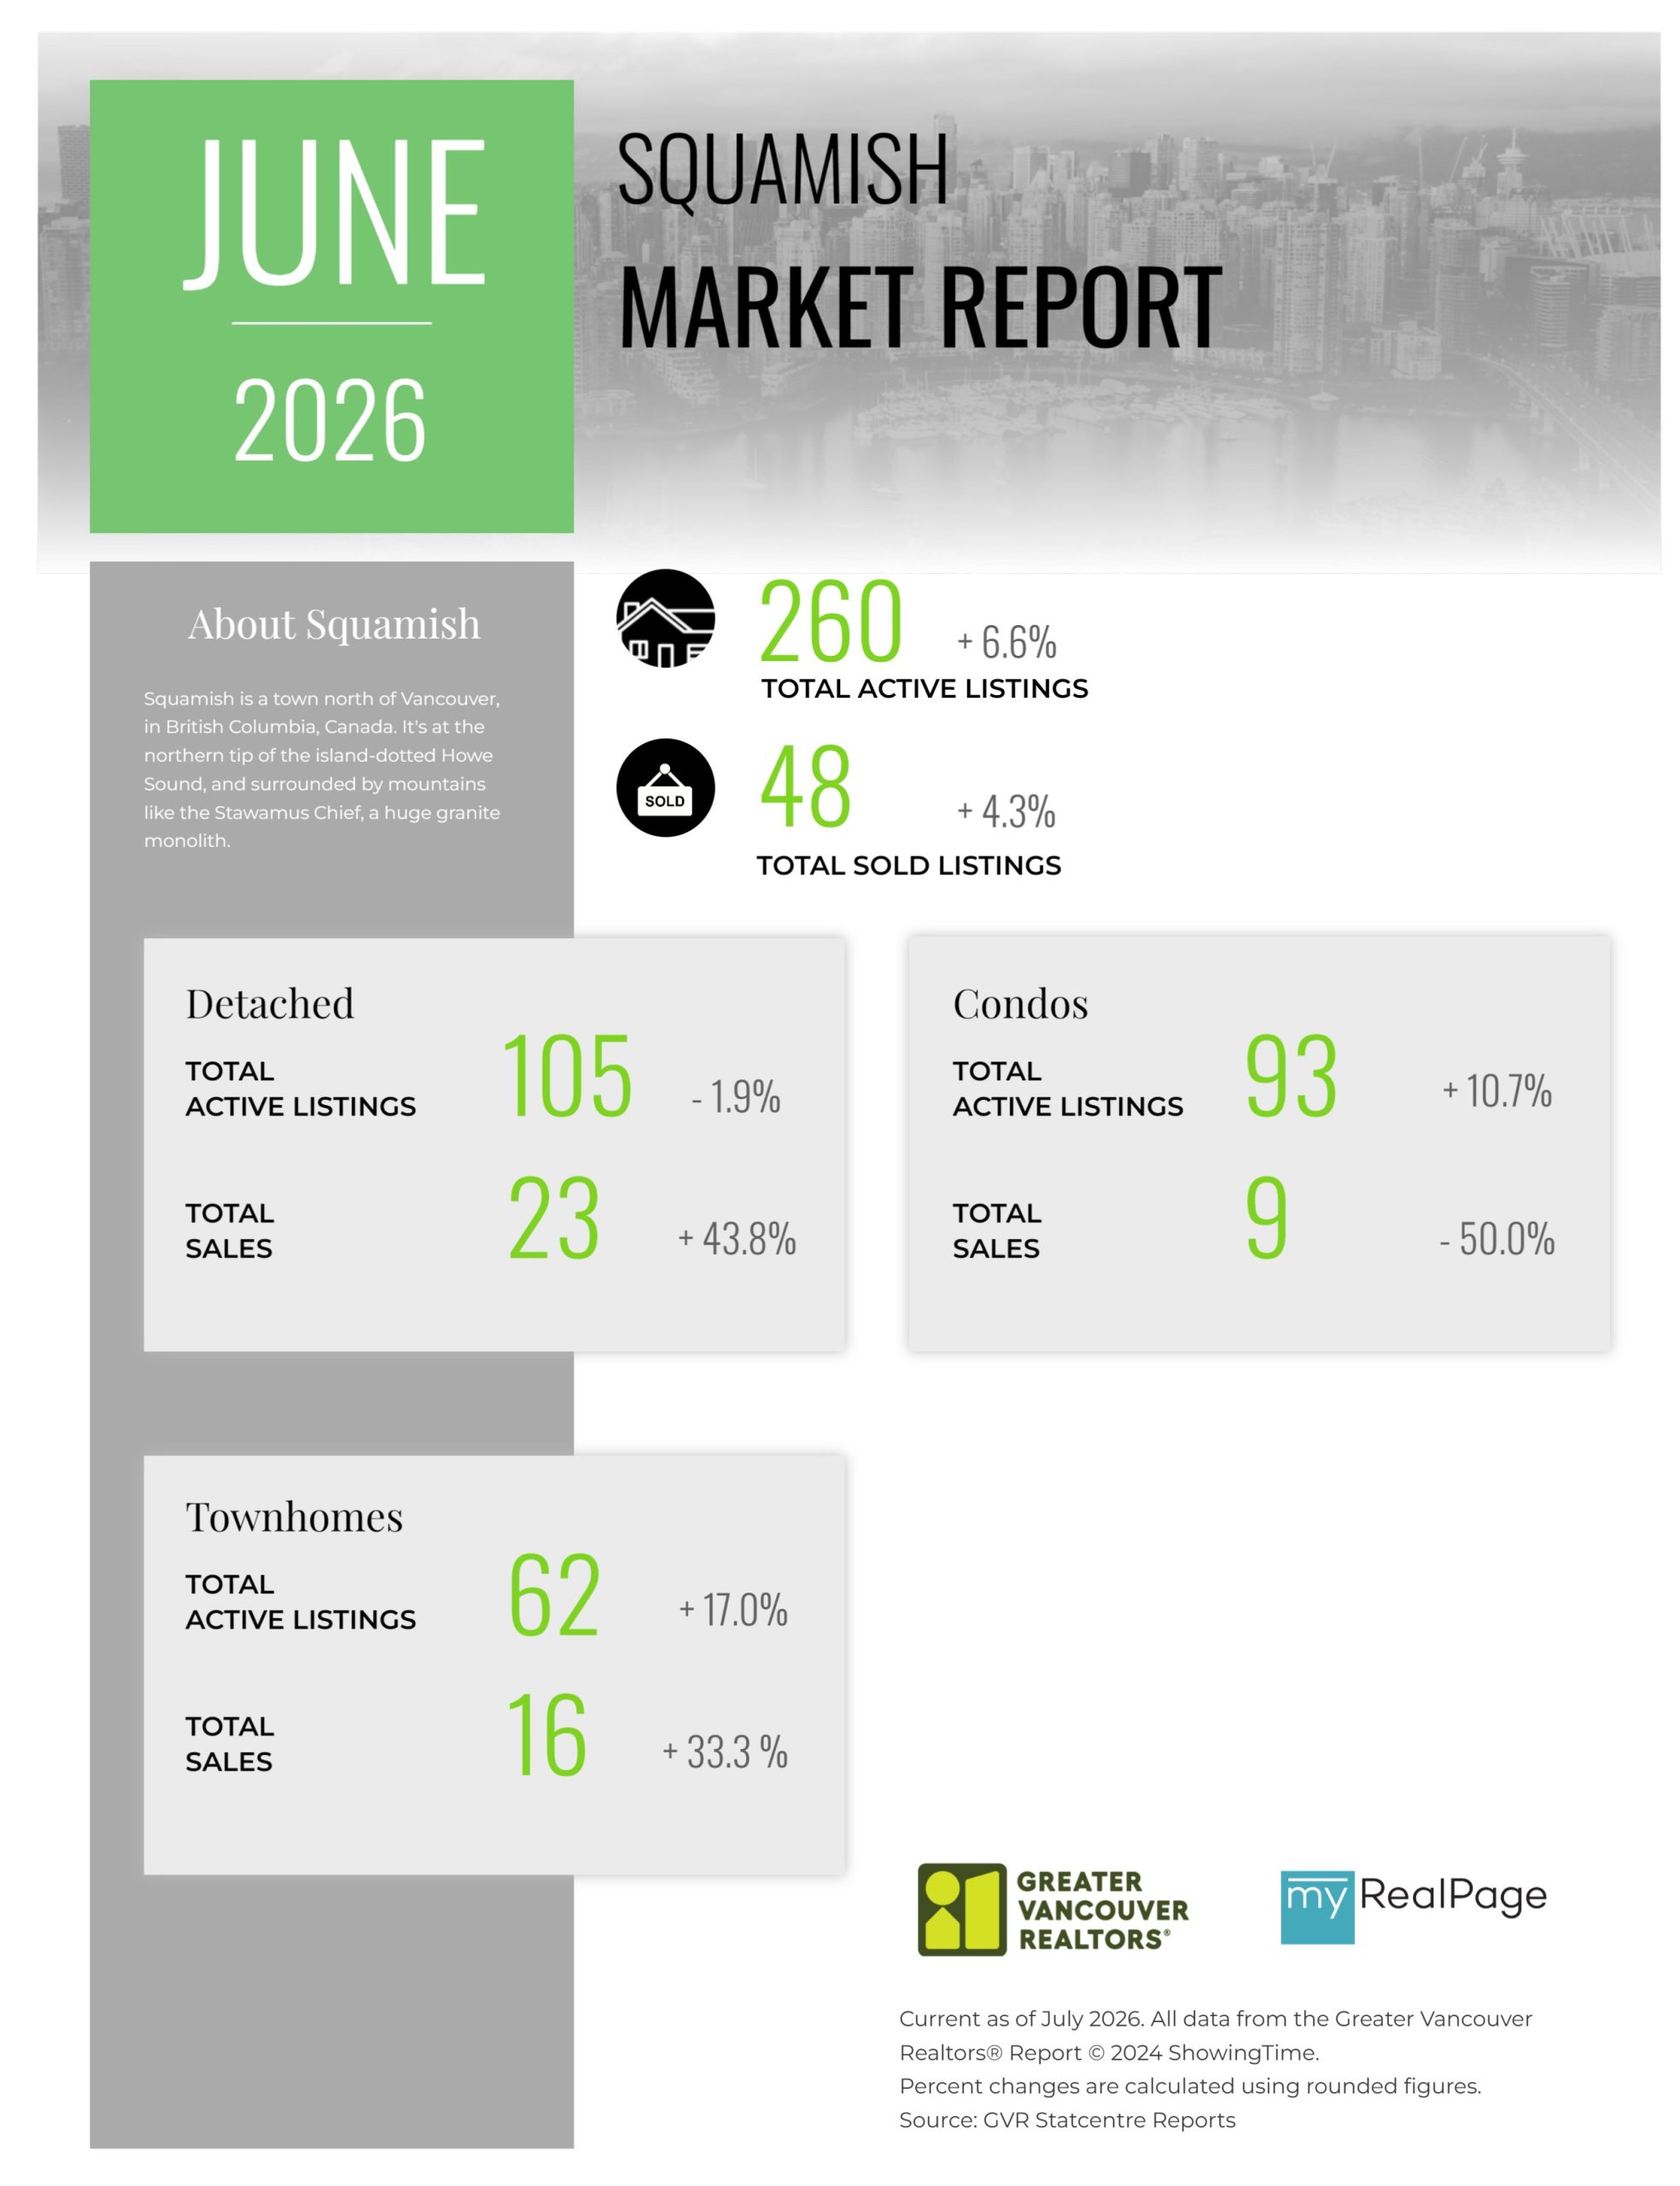
Printable Version – GVR June 2026 Data Infographics Report Squamish
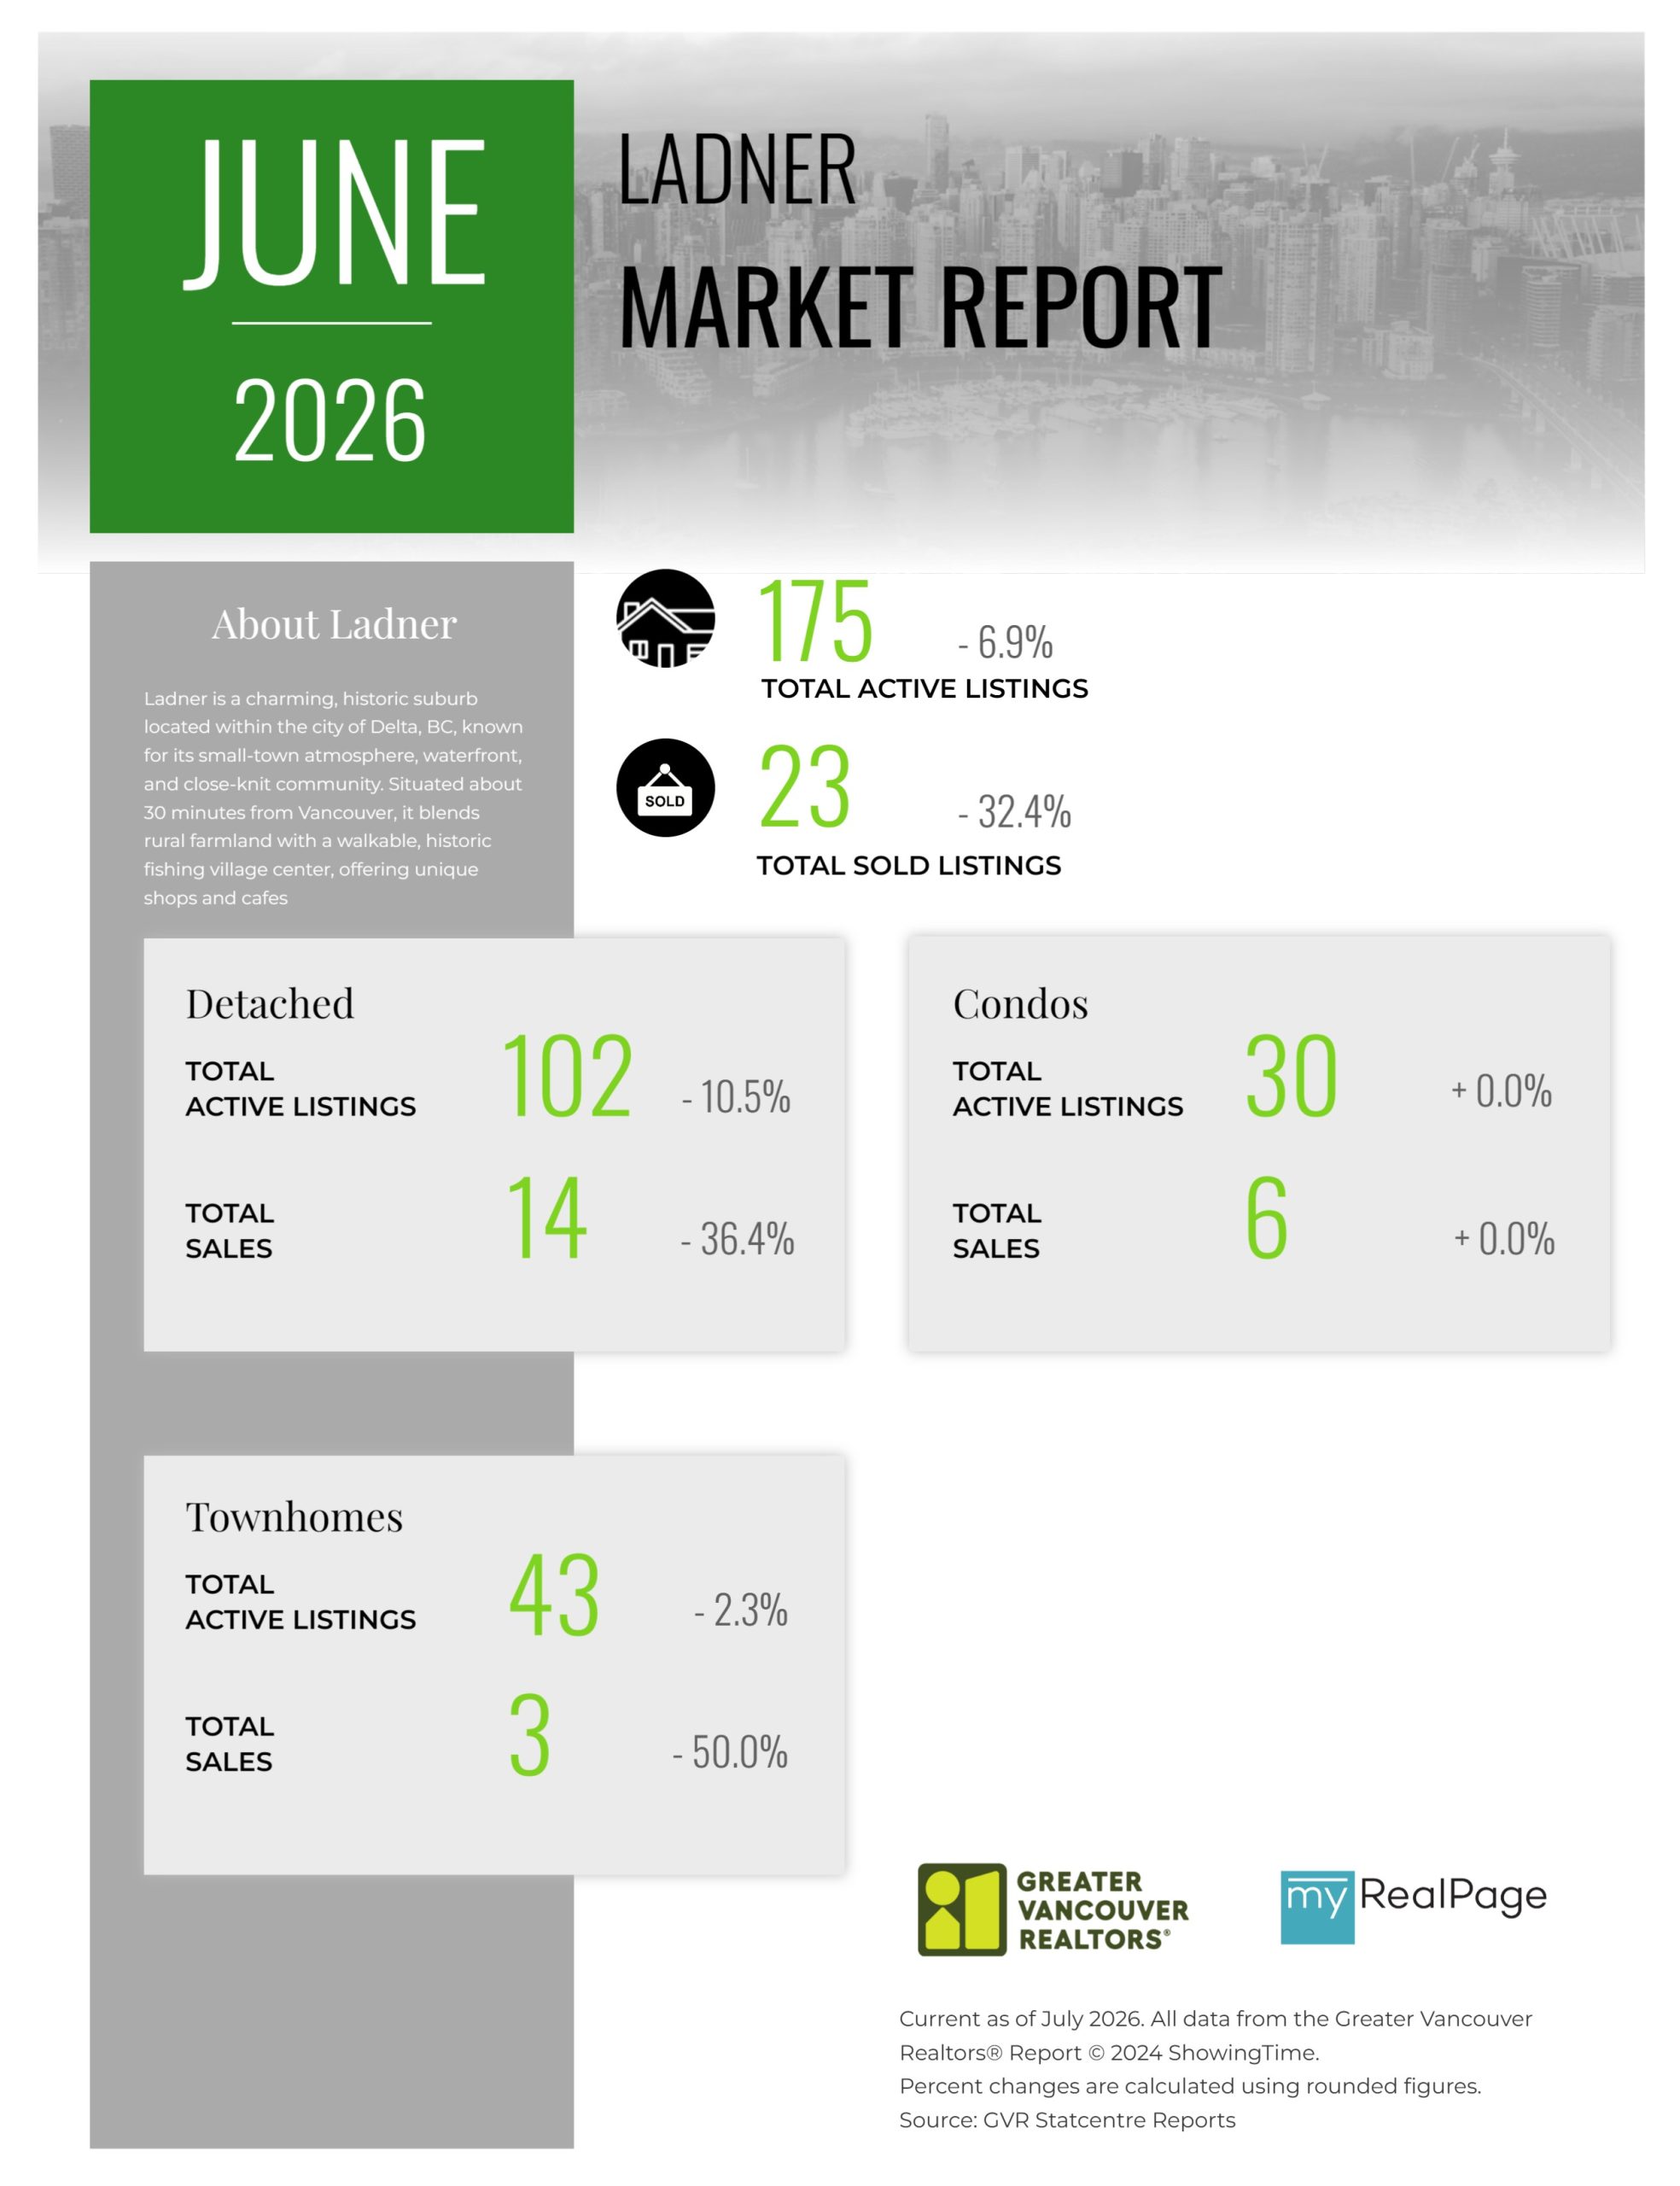
Printable Version – GVR June 2026 Data Infographics Report Ladner
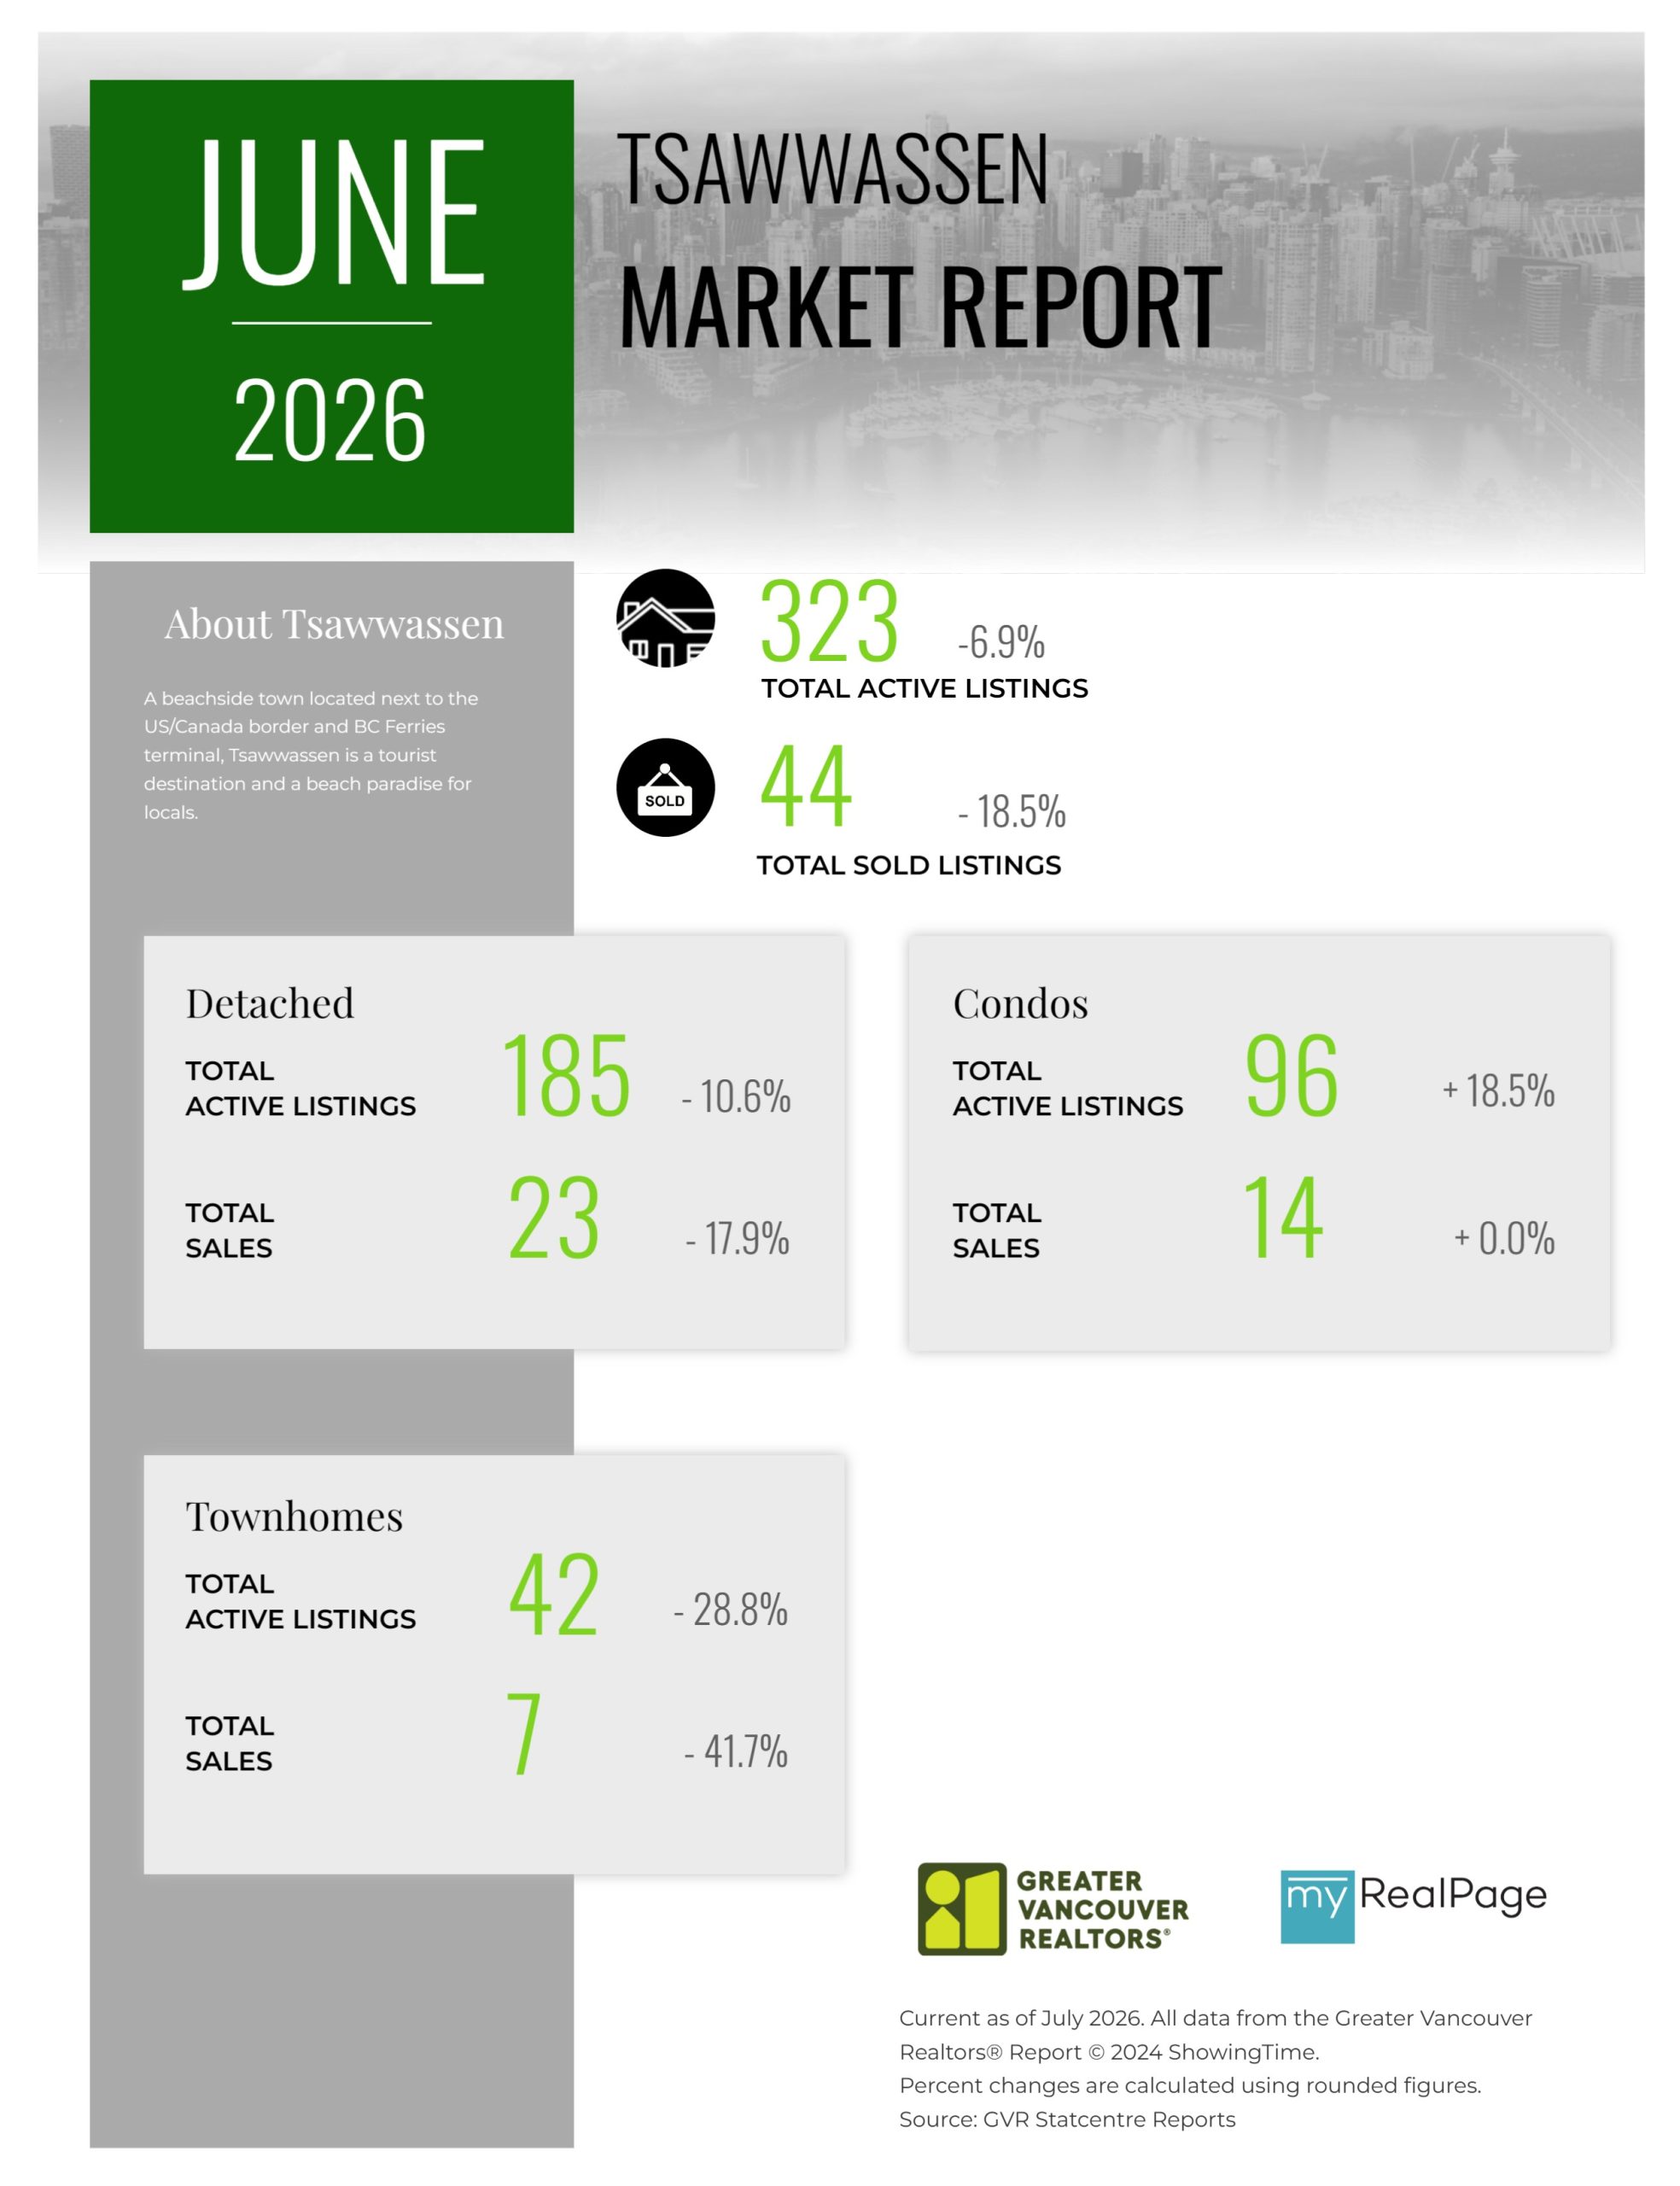
Printable Version – GVR June 2026 Data Infographics Report Tsawwassen


INFOGRAPHICS: May 2026 GVR Greater Vancouver Market Reports
Apartment sales lag, other housing segments steady
Led by slow sales in the apartment segment, home sales registered on the MLS® in Metro Vancouver were down nearly four per cent in May compared to last year.
The Greater Vancouver REALTORS® (GVR) reports that residential sales in the region totalled 2,150 in May 2026, a 3.5 per cent decrease from the 2,228 sales recorded in May 2025. This was 26.6 per cent below the 10-year seasonal average (2,930).
“While attached sales held relatively steady and detached sales edged up roughly one per cent in May, apartment sales were down about seven per cent year-over-year, which weighed down the overall sales total. Even then, apartment sales were not down uniformly across all regions – some of the larger areas such as North and East Vancouver saw increases relative to last year.” said Andrew Lis, GVR chief economist and vice-president data analytics
Read the full report on the REBGV website!
The following data is a comparison between May 2026 and May 2025 numbers, and is current as of June of 2026. For last month’s update, you can check out our previous post!
Or follow this link for all our GVR Infographics!
These infographics cover current trends in several areas within the Greater Vancouver region. Click on the images for a larger view!
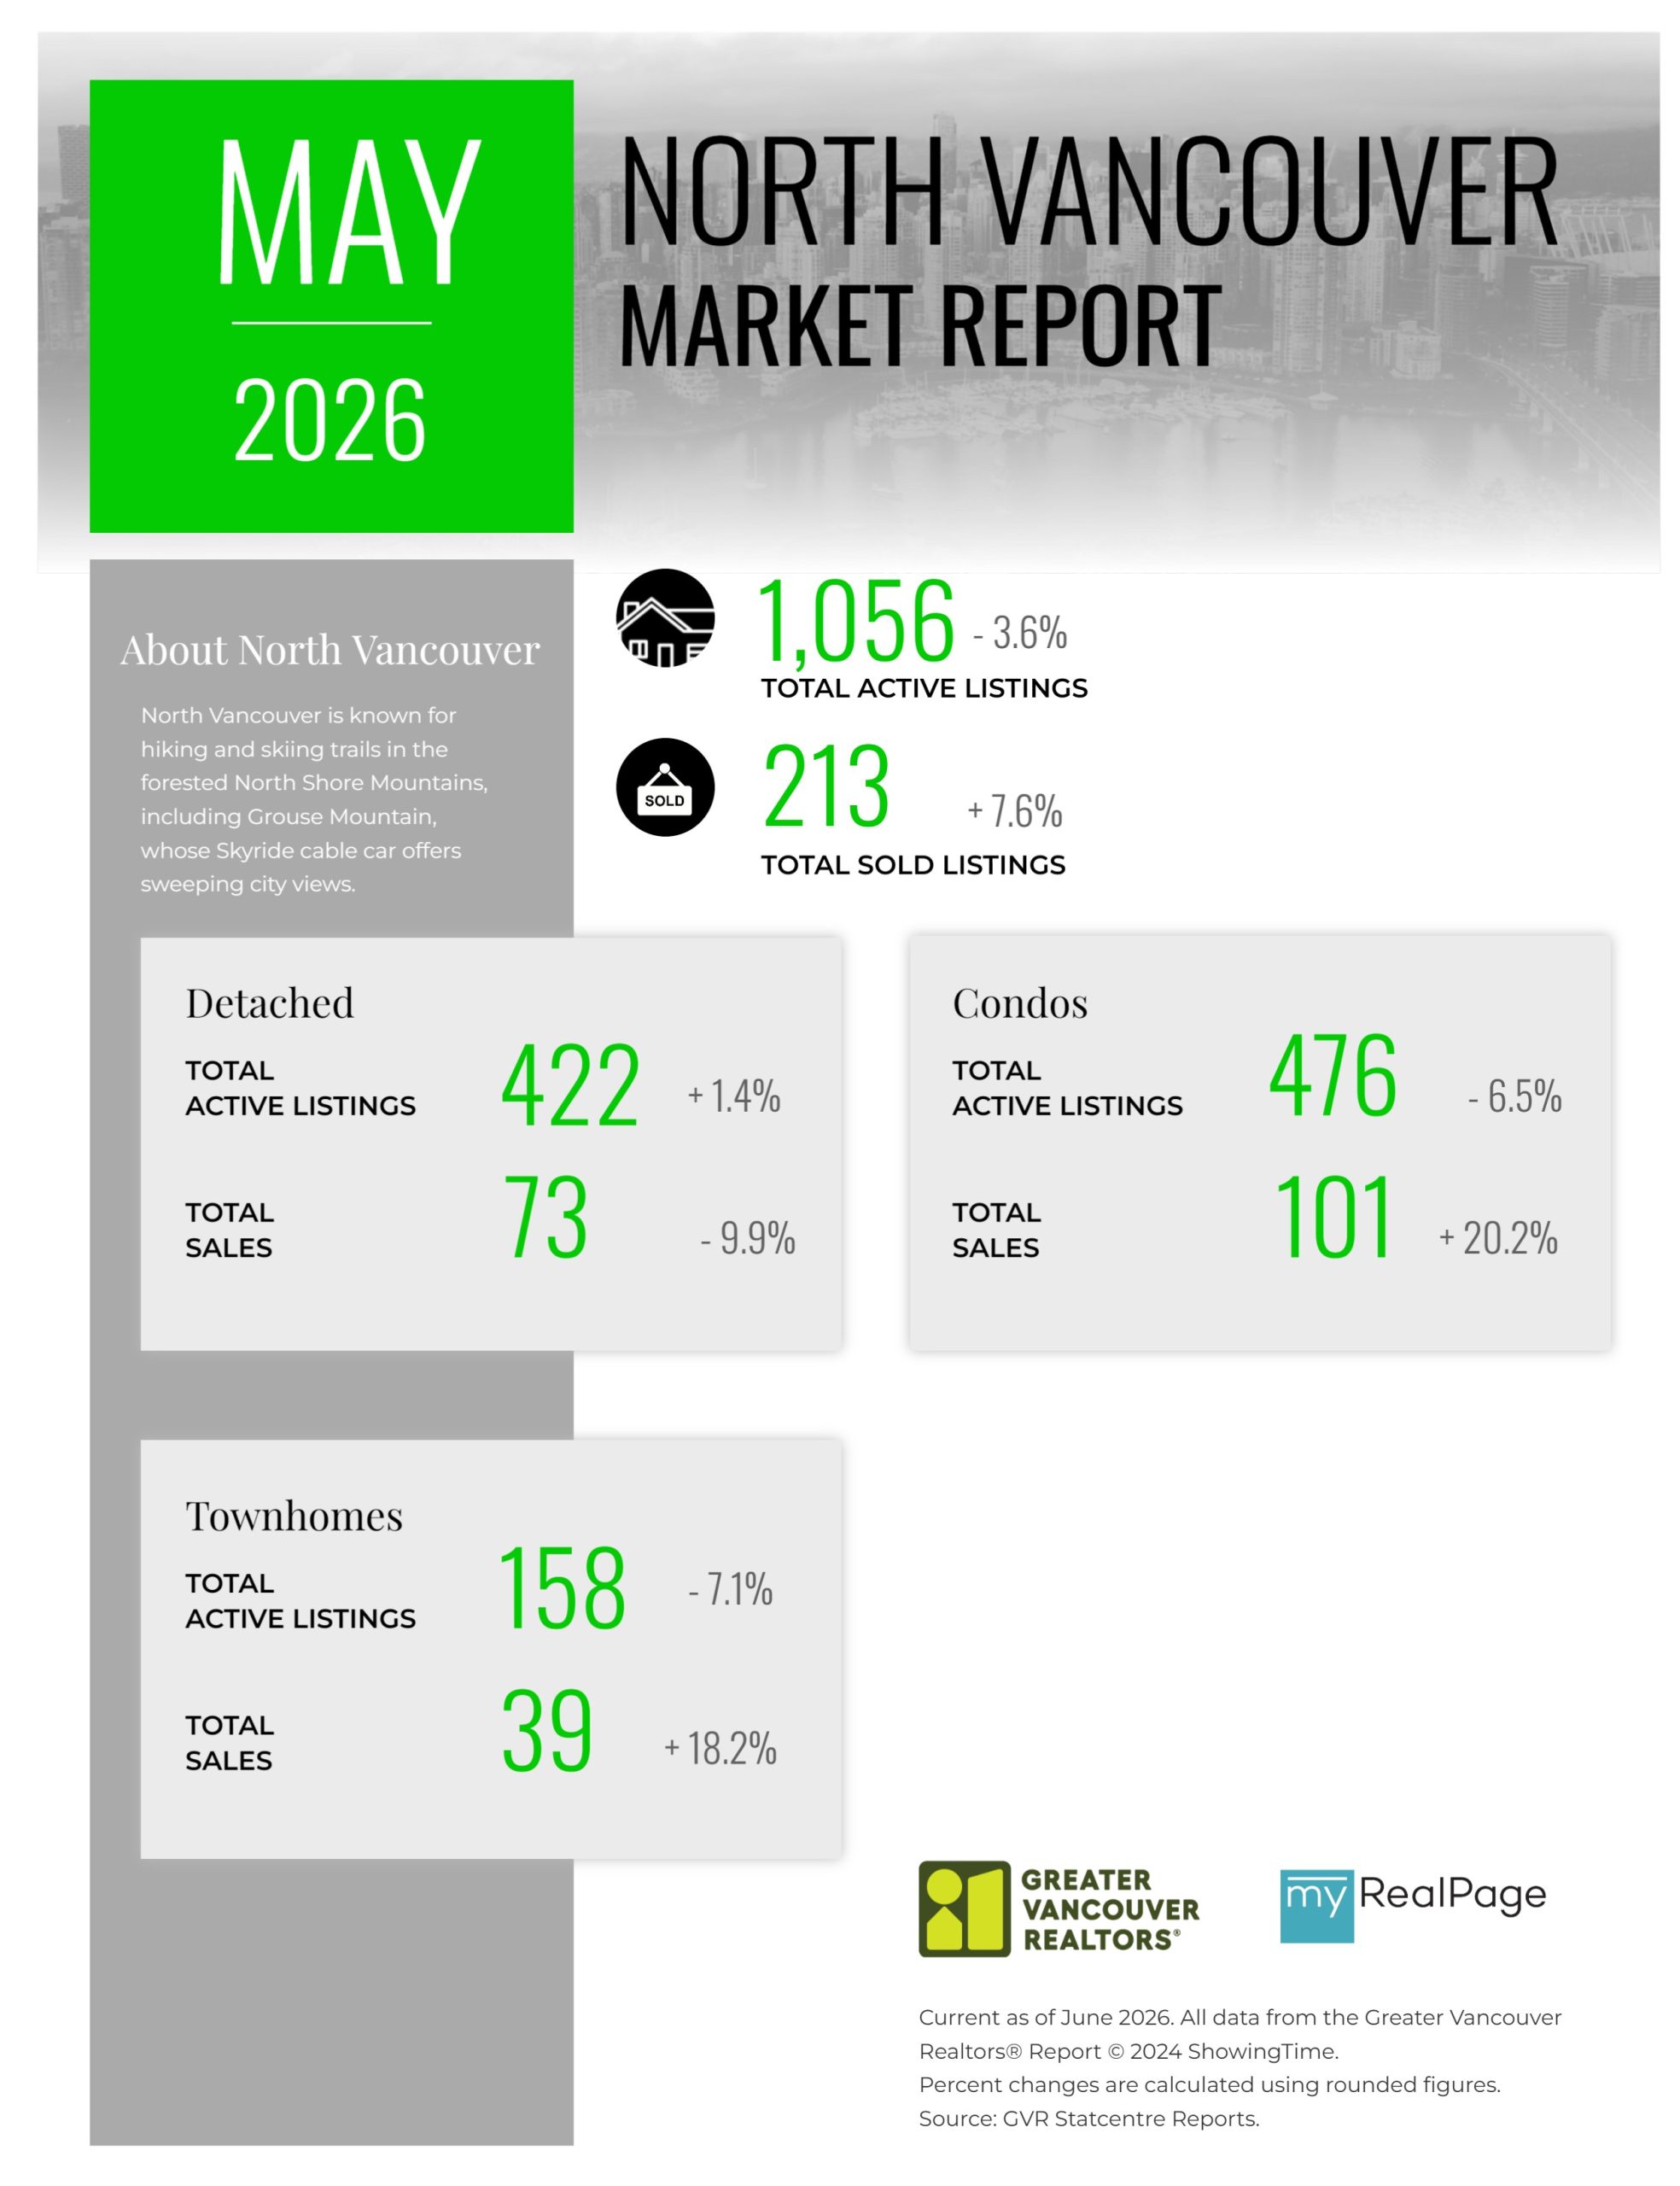
Printable Version – GVR May 2026 Data Infographic Report North Vancouver
Printable Version – GVR May 2026 Data Infographics Report West Vancouver
Printable Version – GVR May 2026 Data Infographics Report Vancouver West
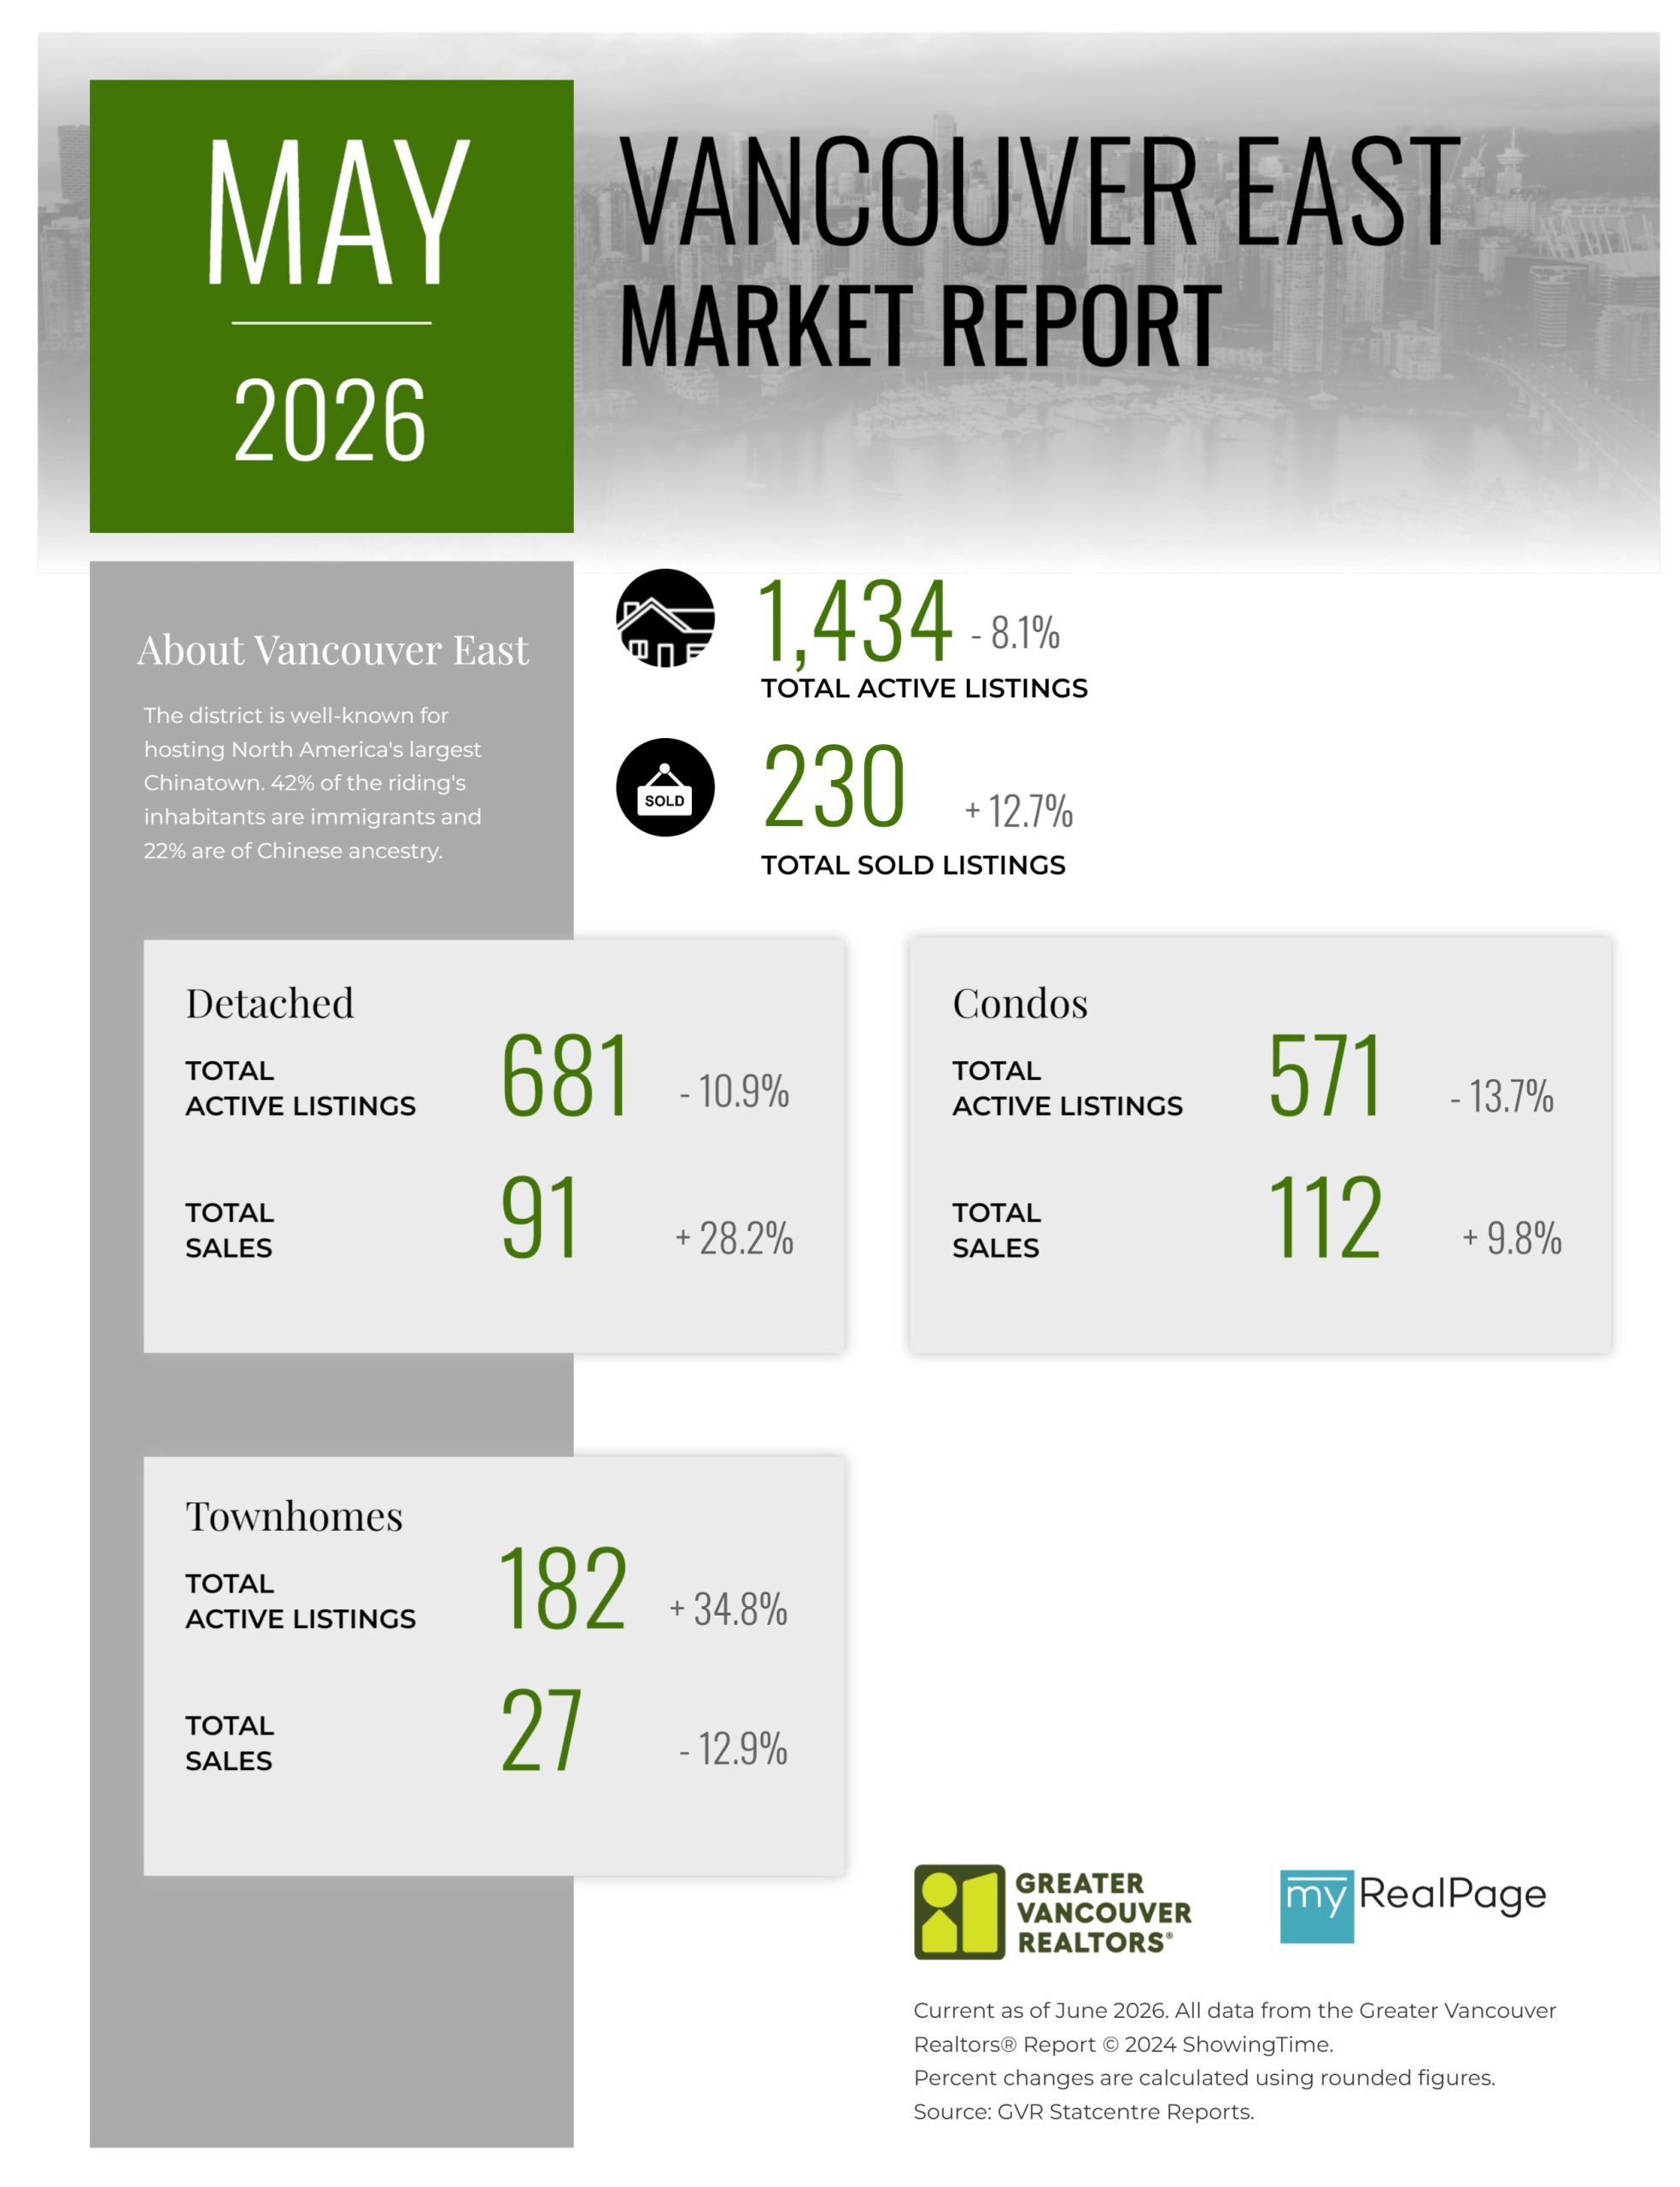
Printable Version – GVR May 2026 Data Infographics Report Vancouver East
Printable Version – GVR May 2026 Data Infographic Report Maple Ridge
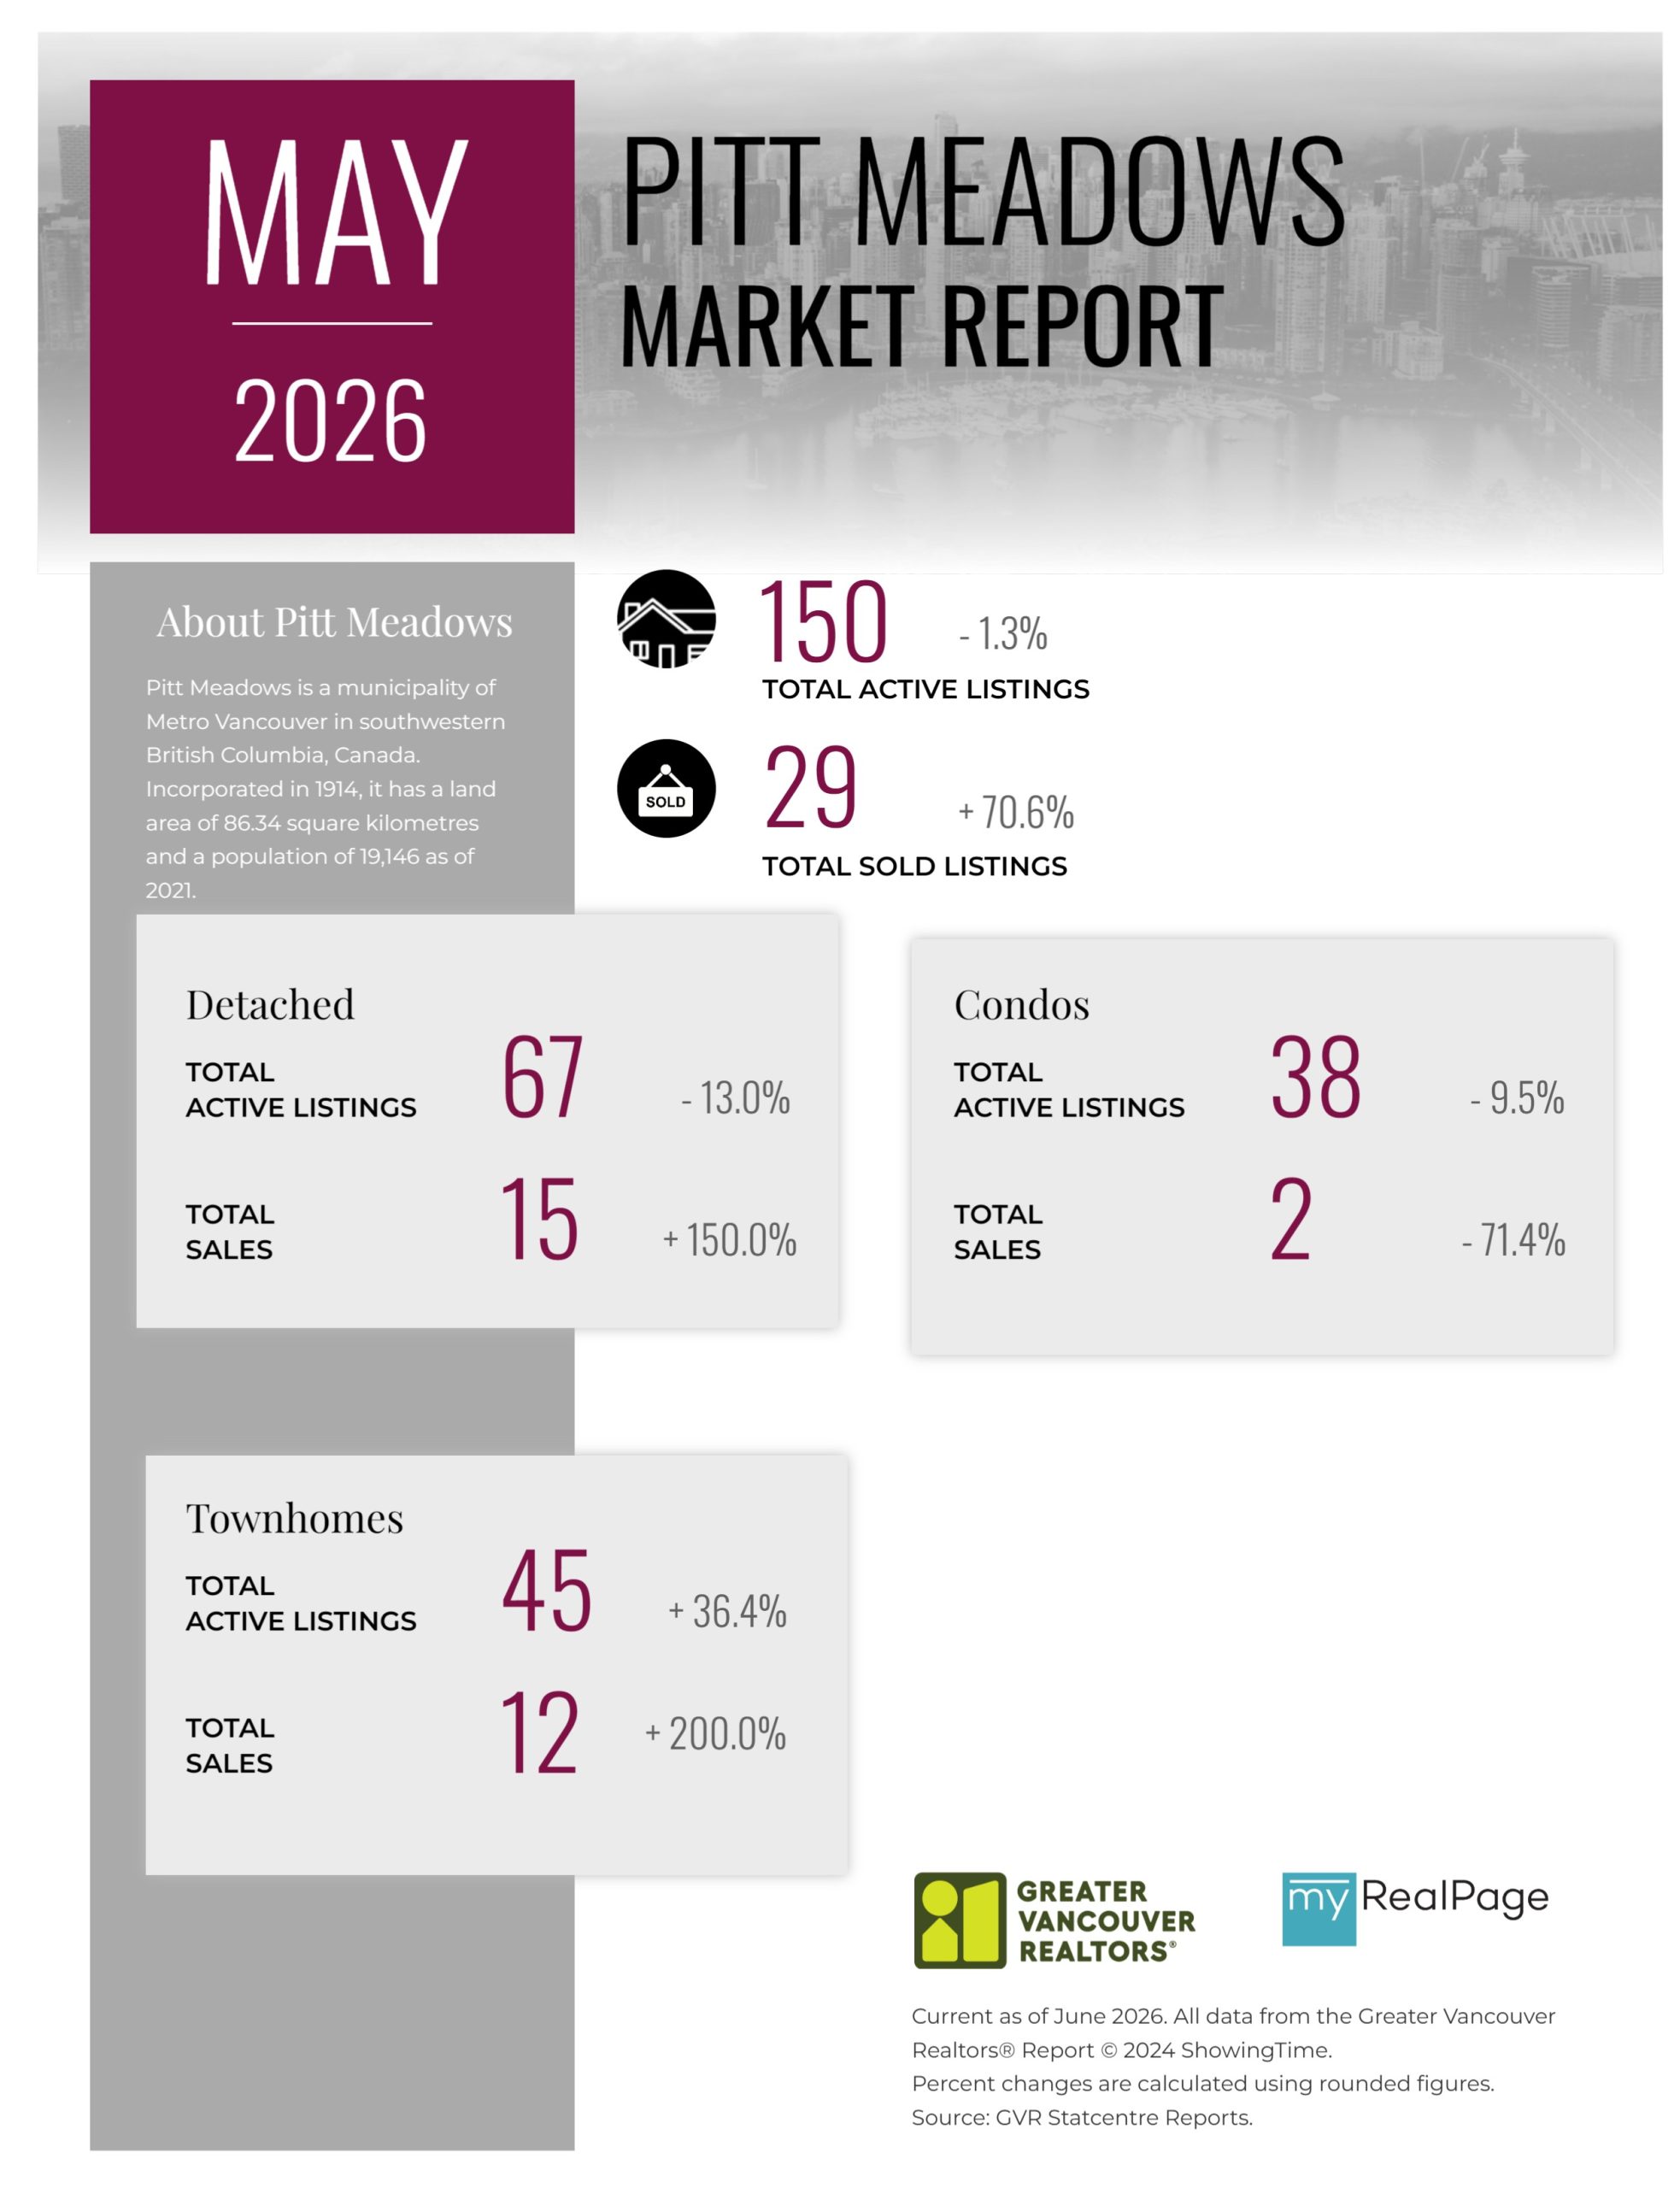
Printable Version – GVR May 2026 Data Infographics Report Pitt Meadows
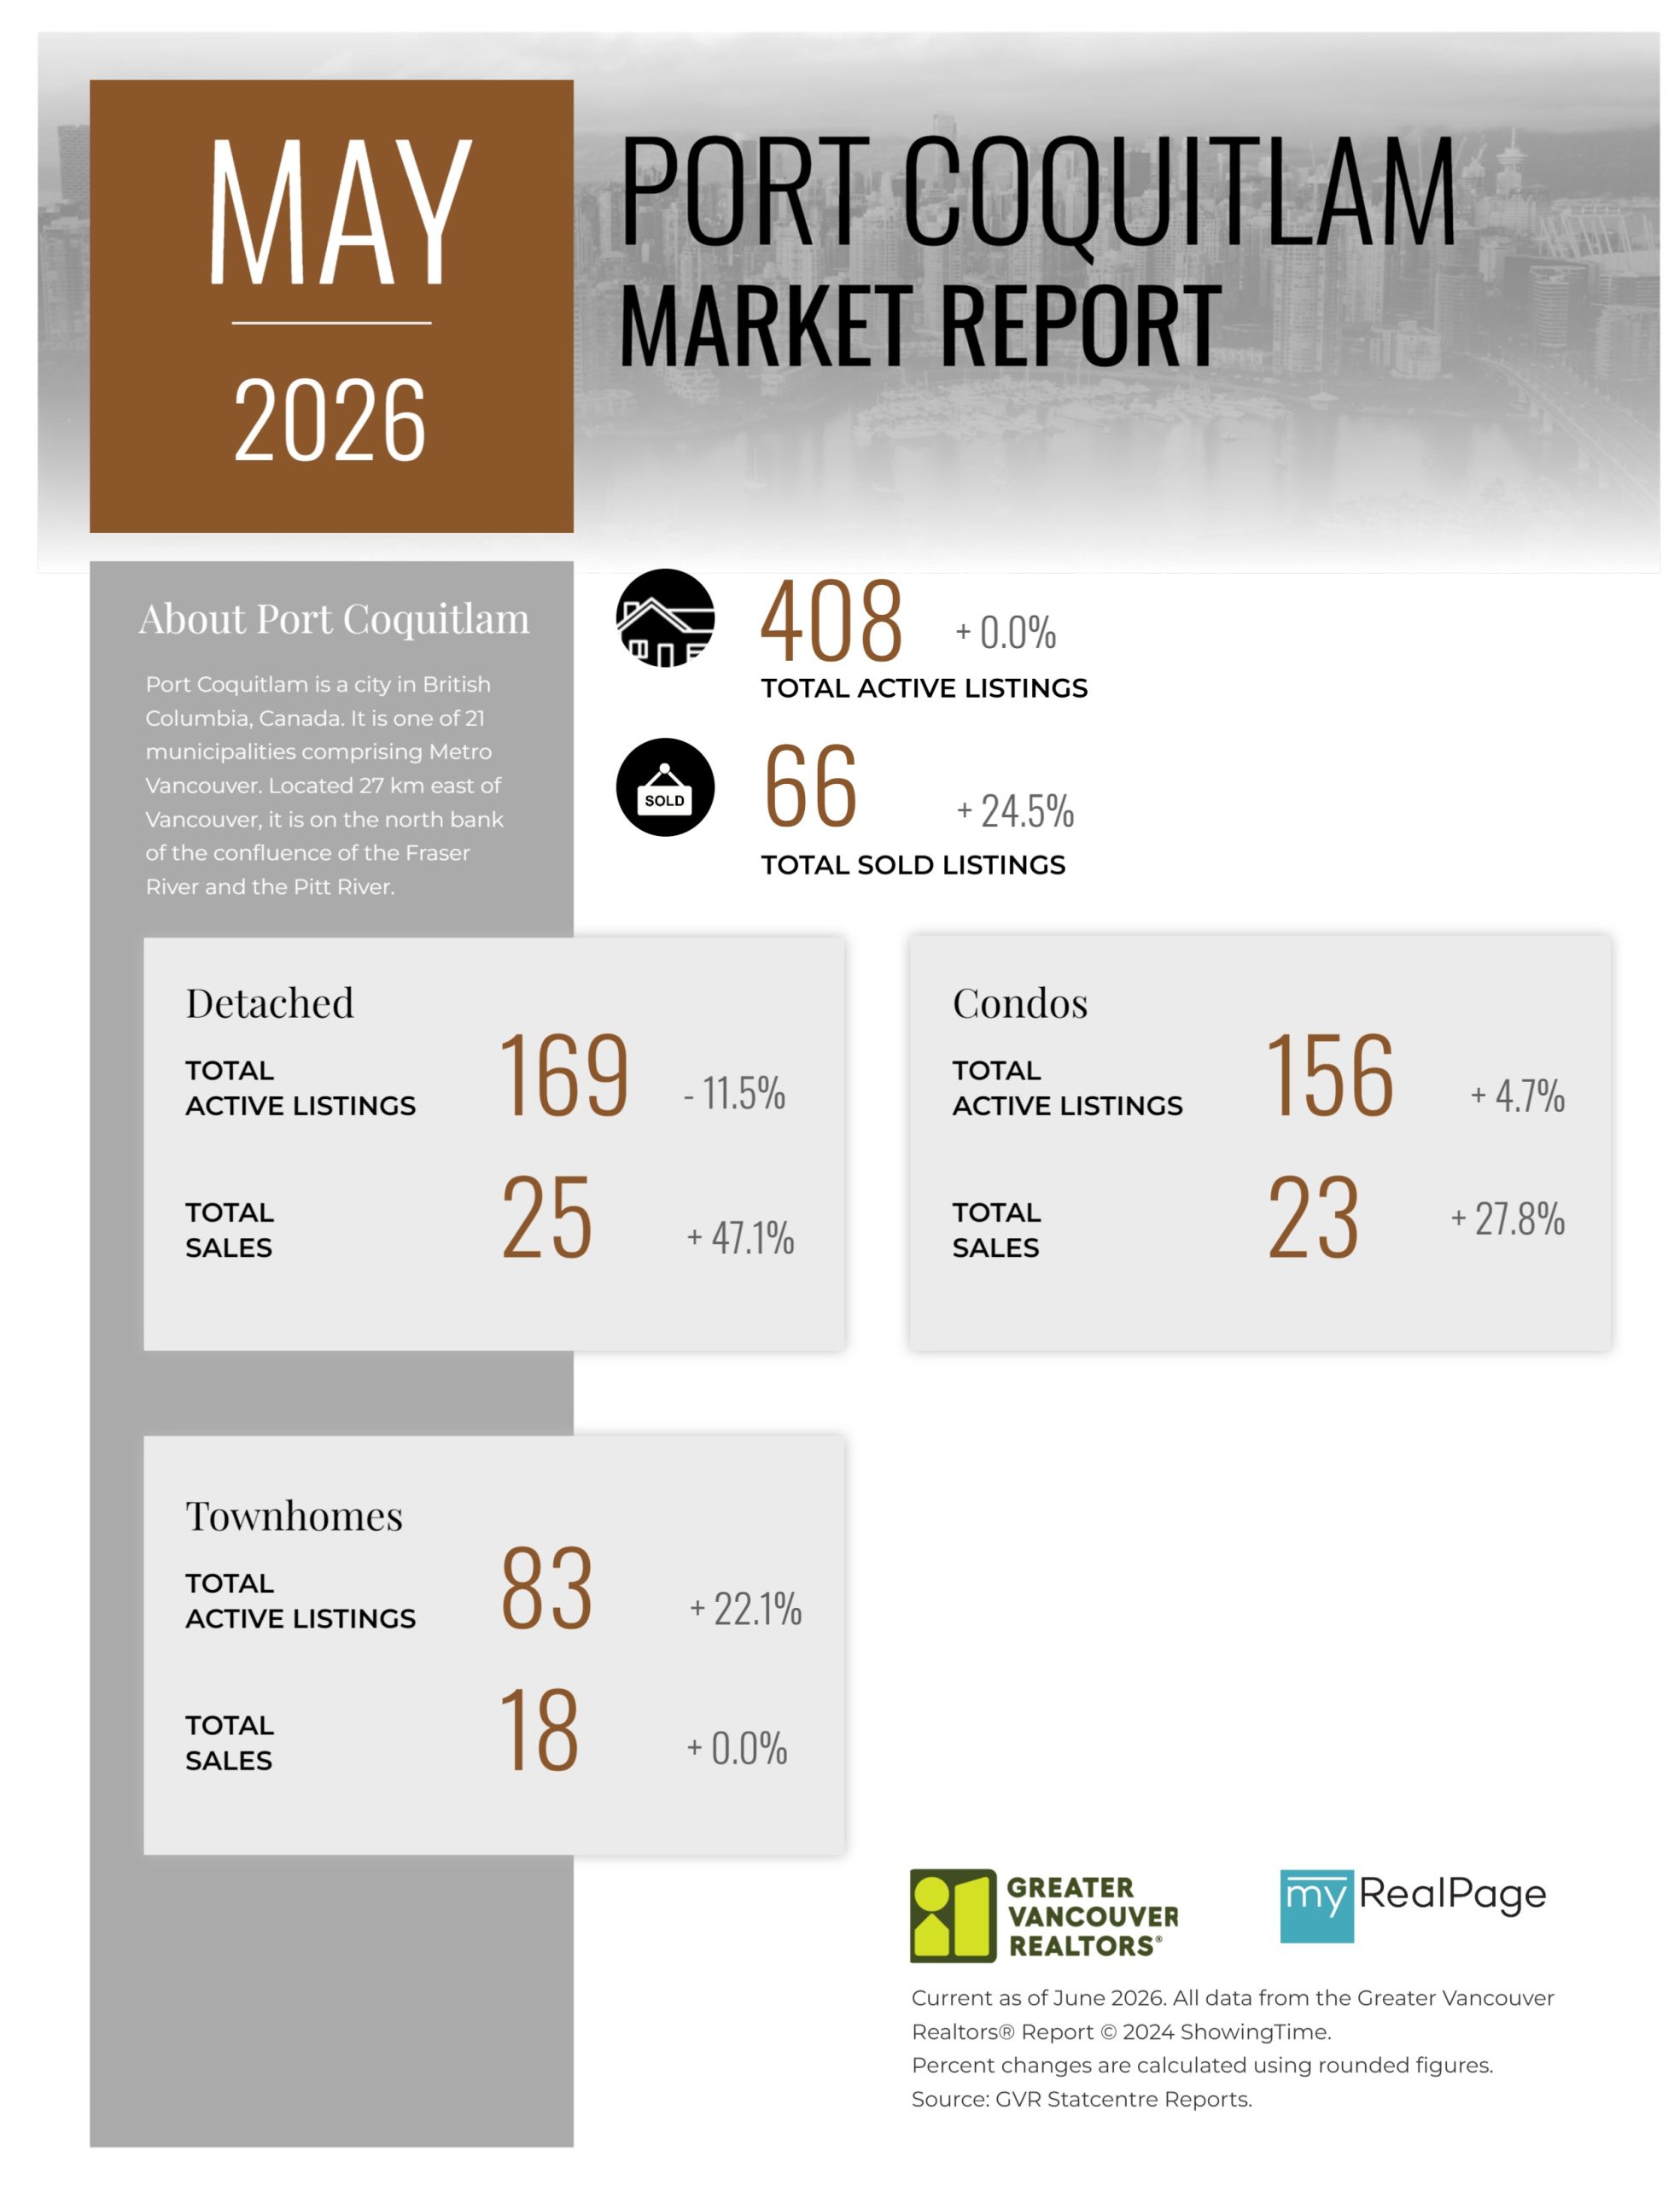
Printable Version – GVR May 2026 Data Infographics Report Port Coquitlam
Printable Version – GVR May 2026 Data Infographics Report Coquitlam
Printable Version – GVR May 2026 Data Infographic Report Burnaby North
Printable Version – GVR May 2026 Data Infographics Report Burnaby South
Printable Version – GVR May 2026 Data Infographics Report Burnaby East
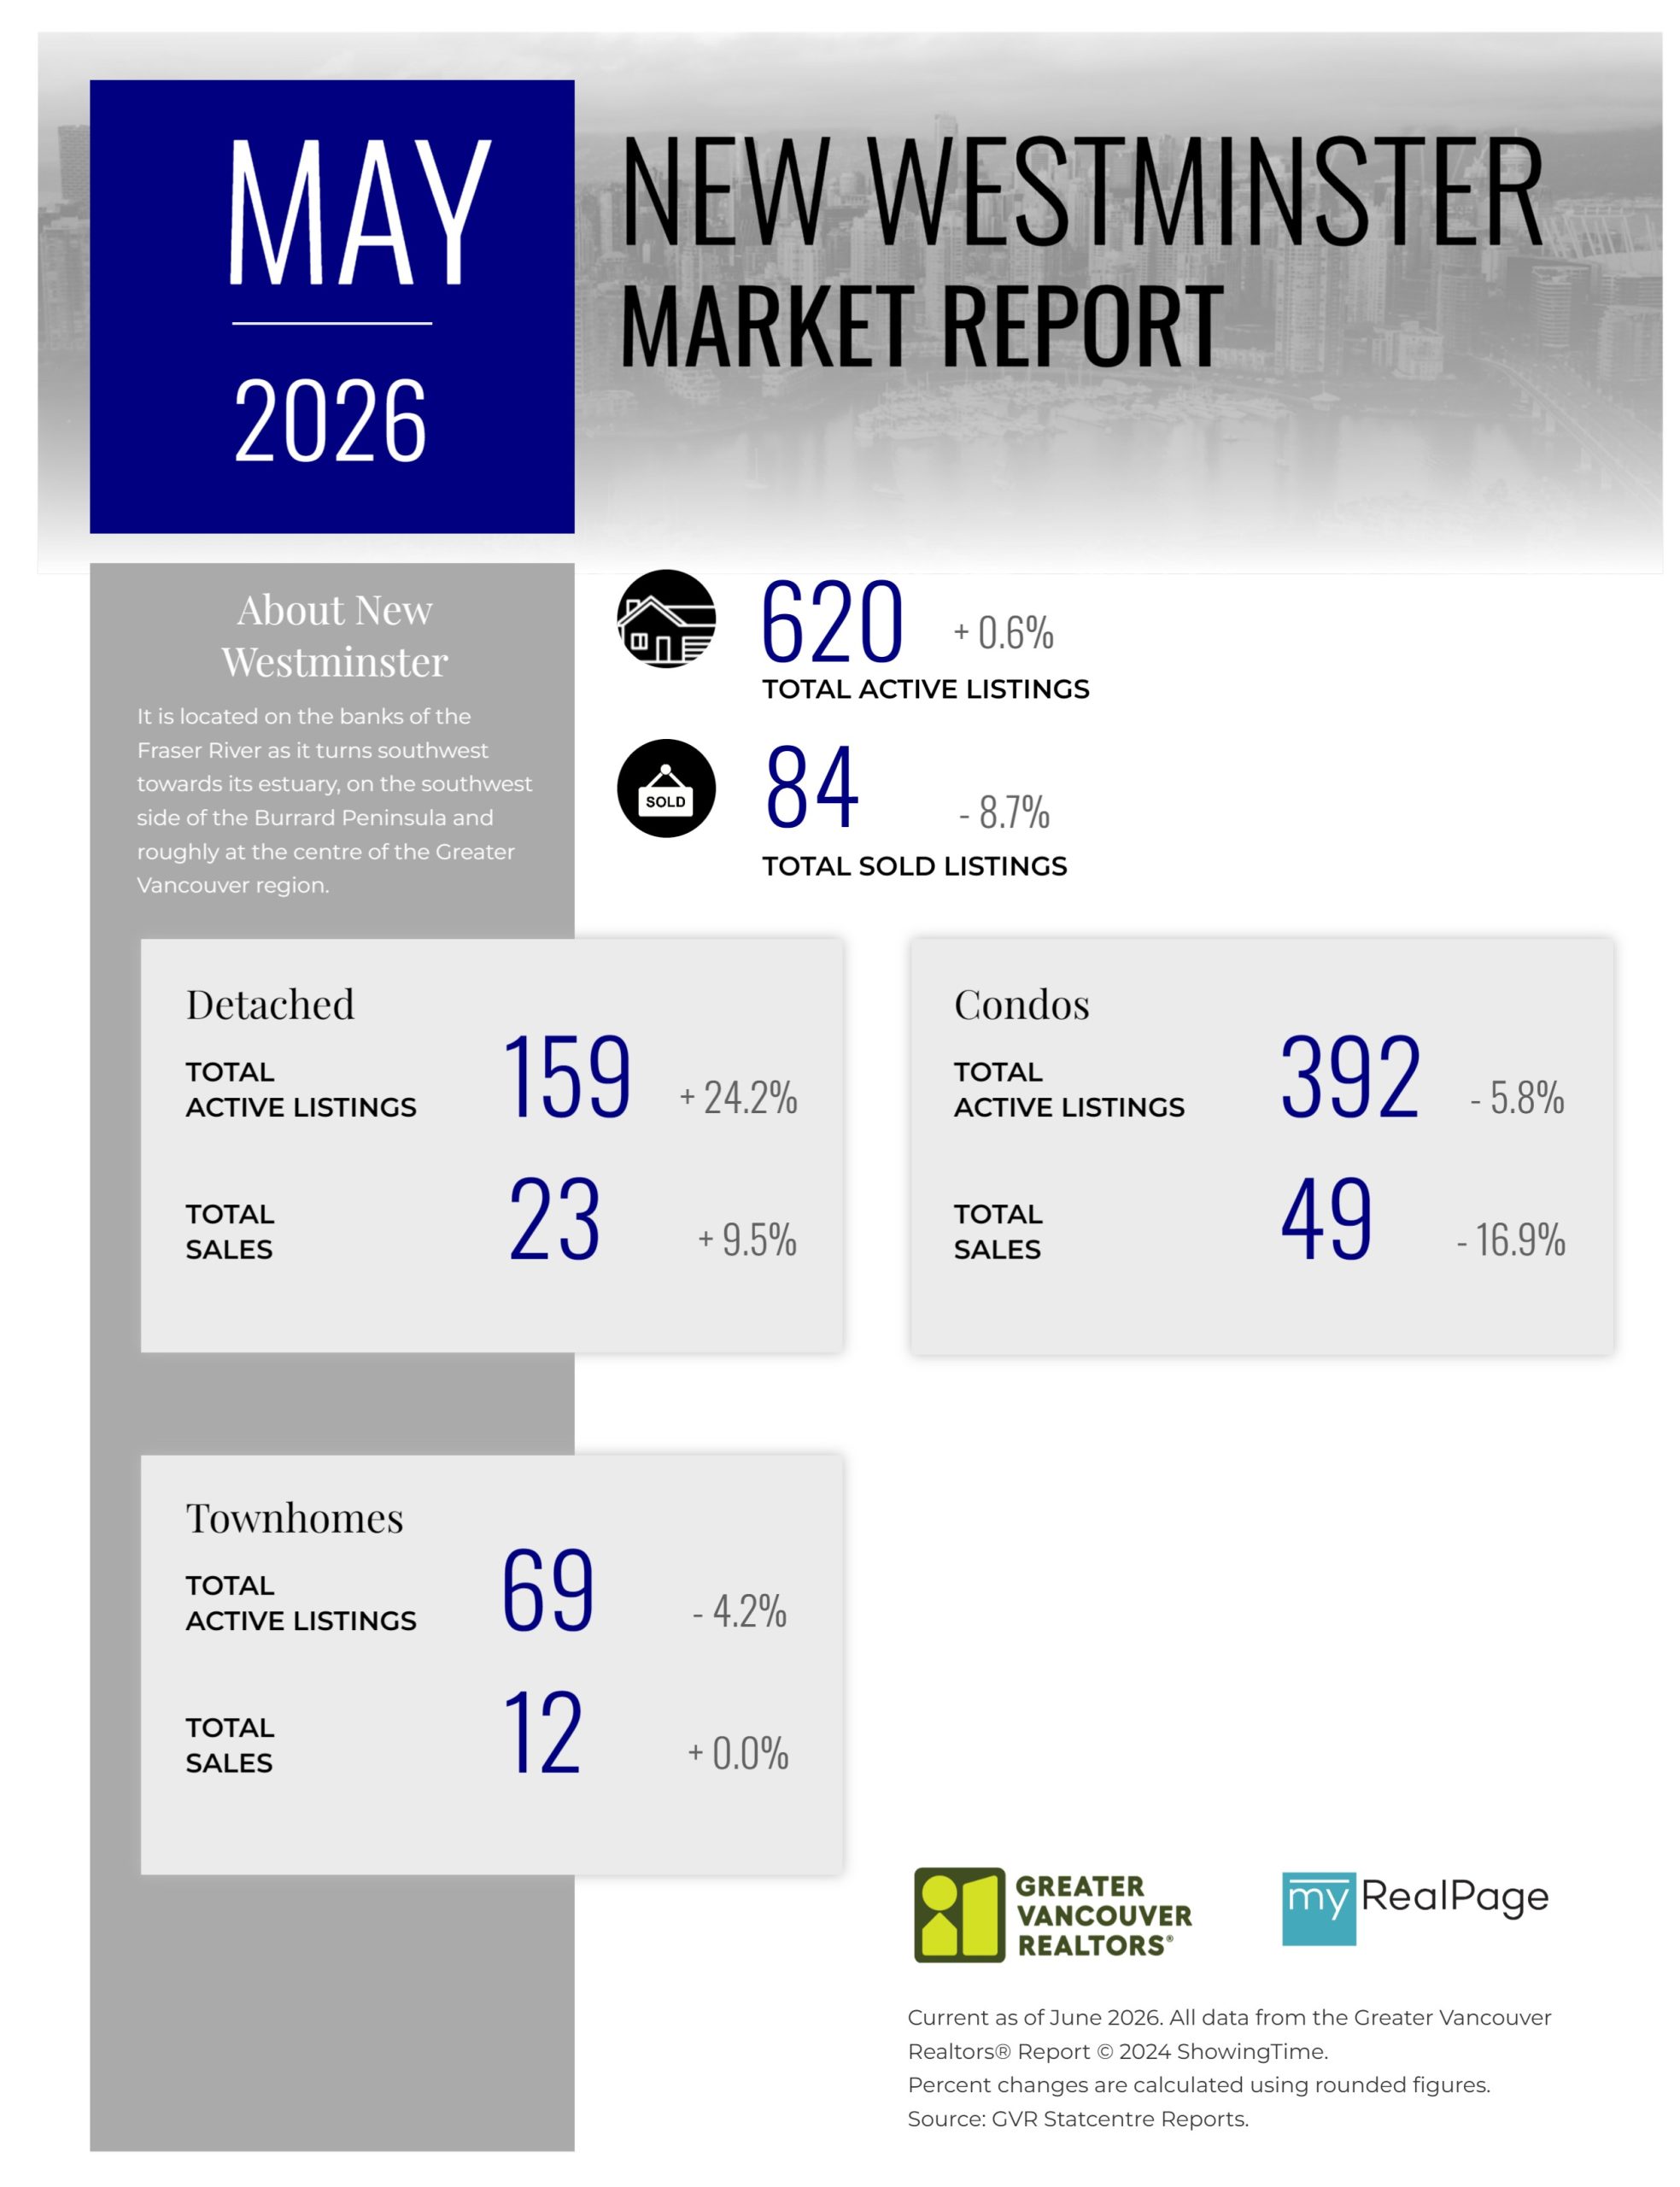
Printable Version – GVR May 2026 Data Infographics Report New Westminster
Printable Version – GVR May 2026 Data Infographics Report Richmond
Printable Version – GVR May 2026 Data Infographics Report Squamish
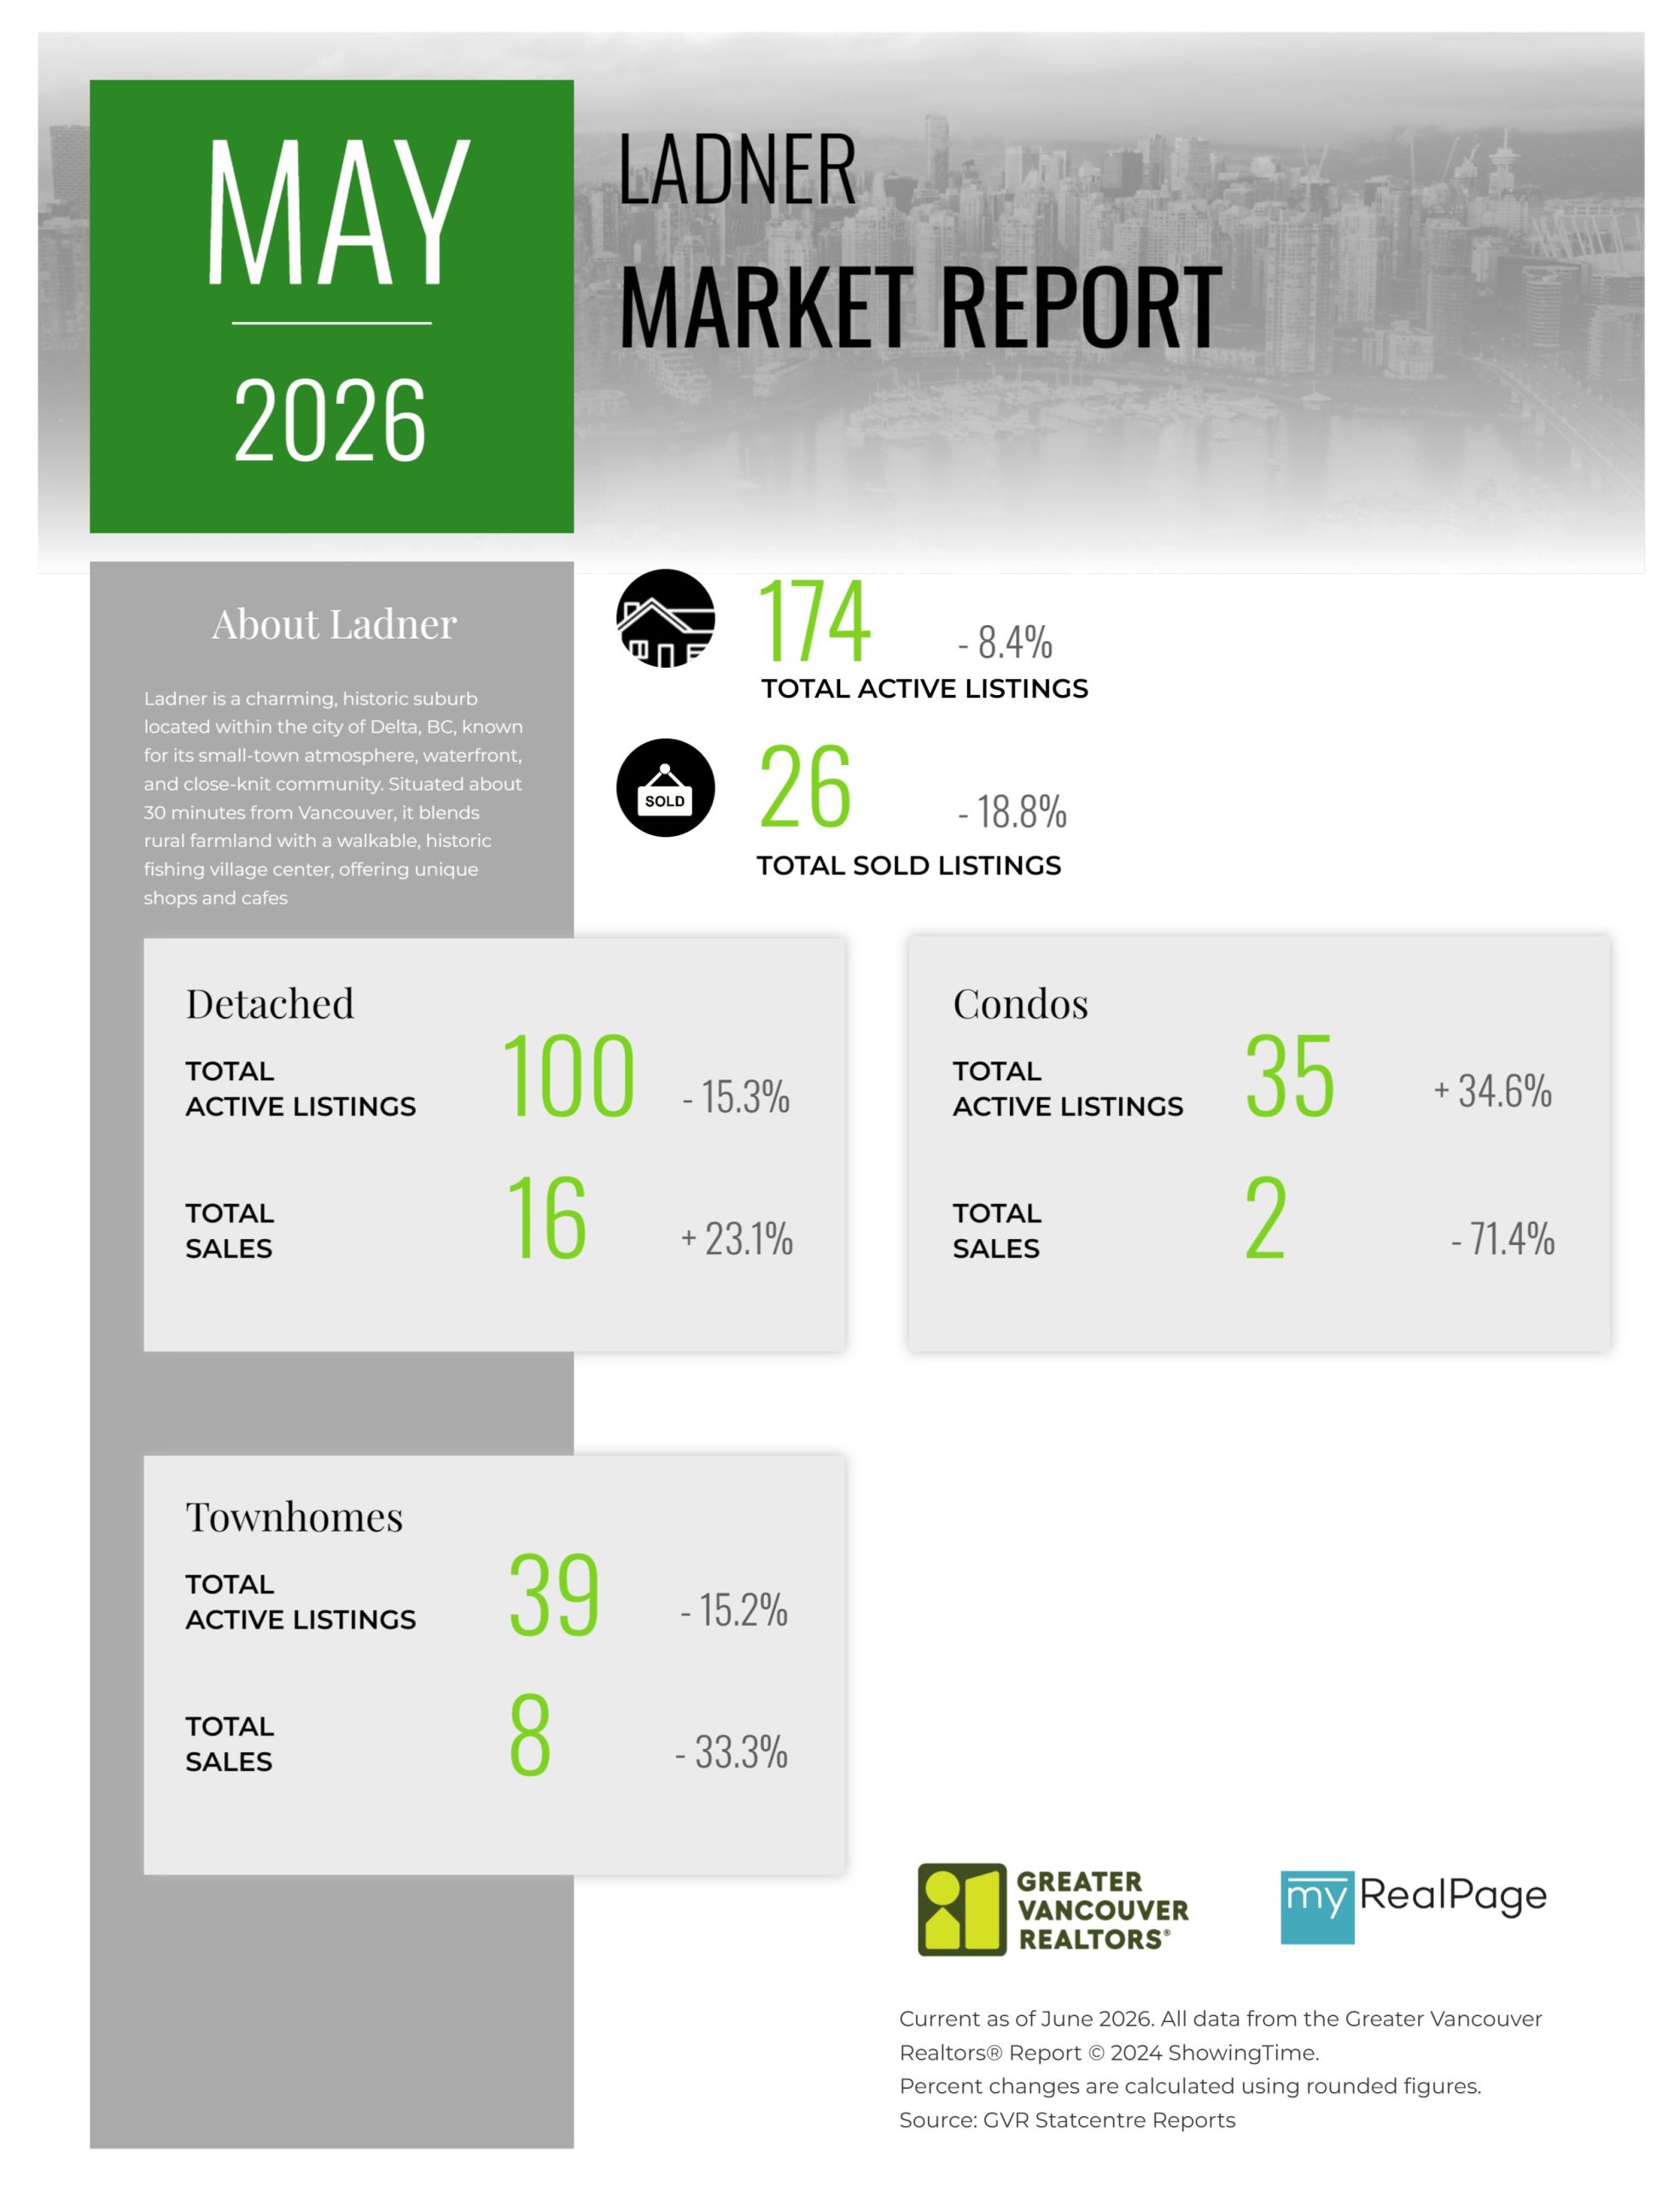
Printable Version – GVR May 2026 Data Infographics Report Ladner
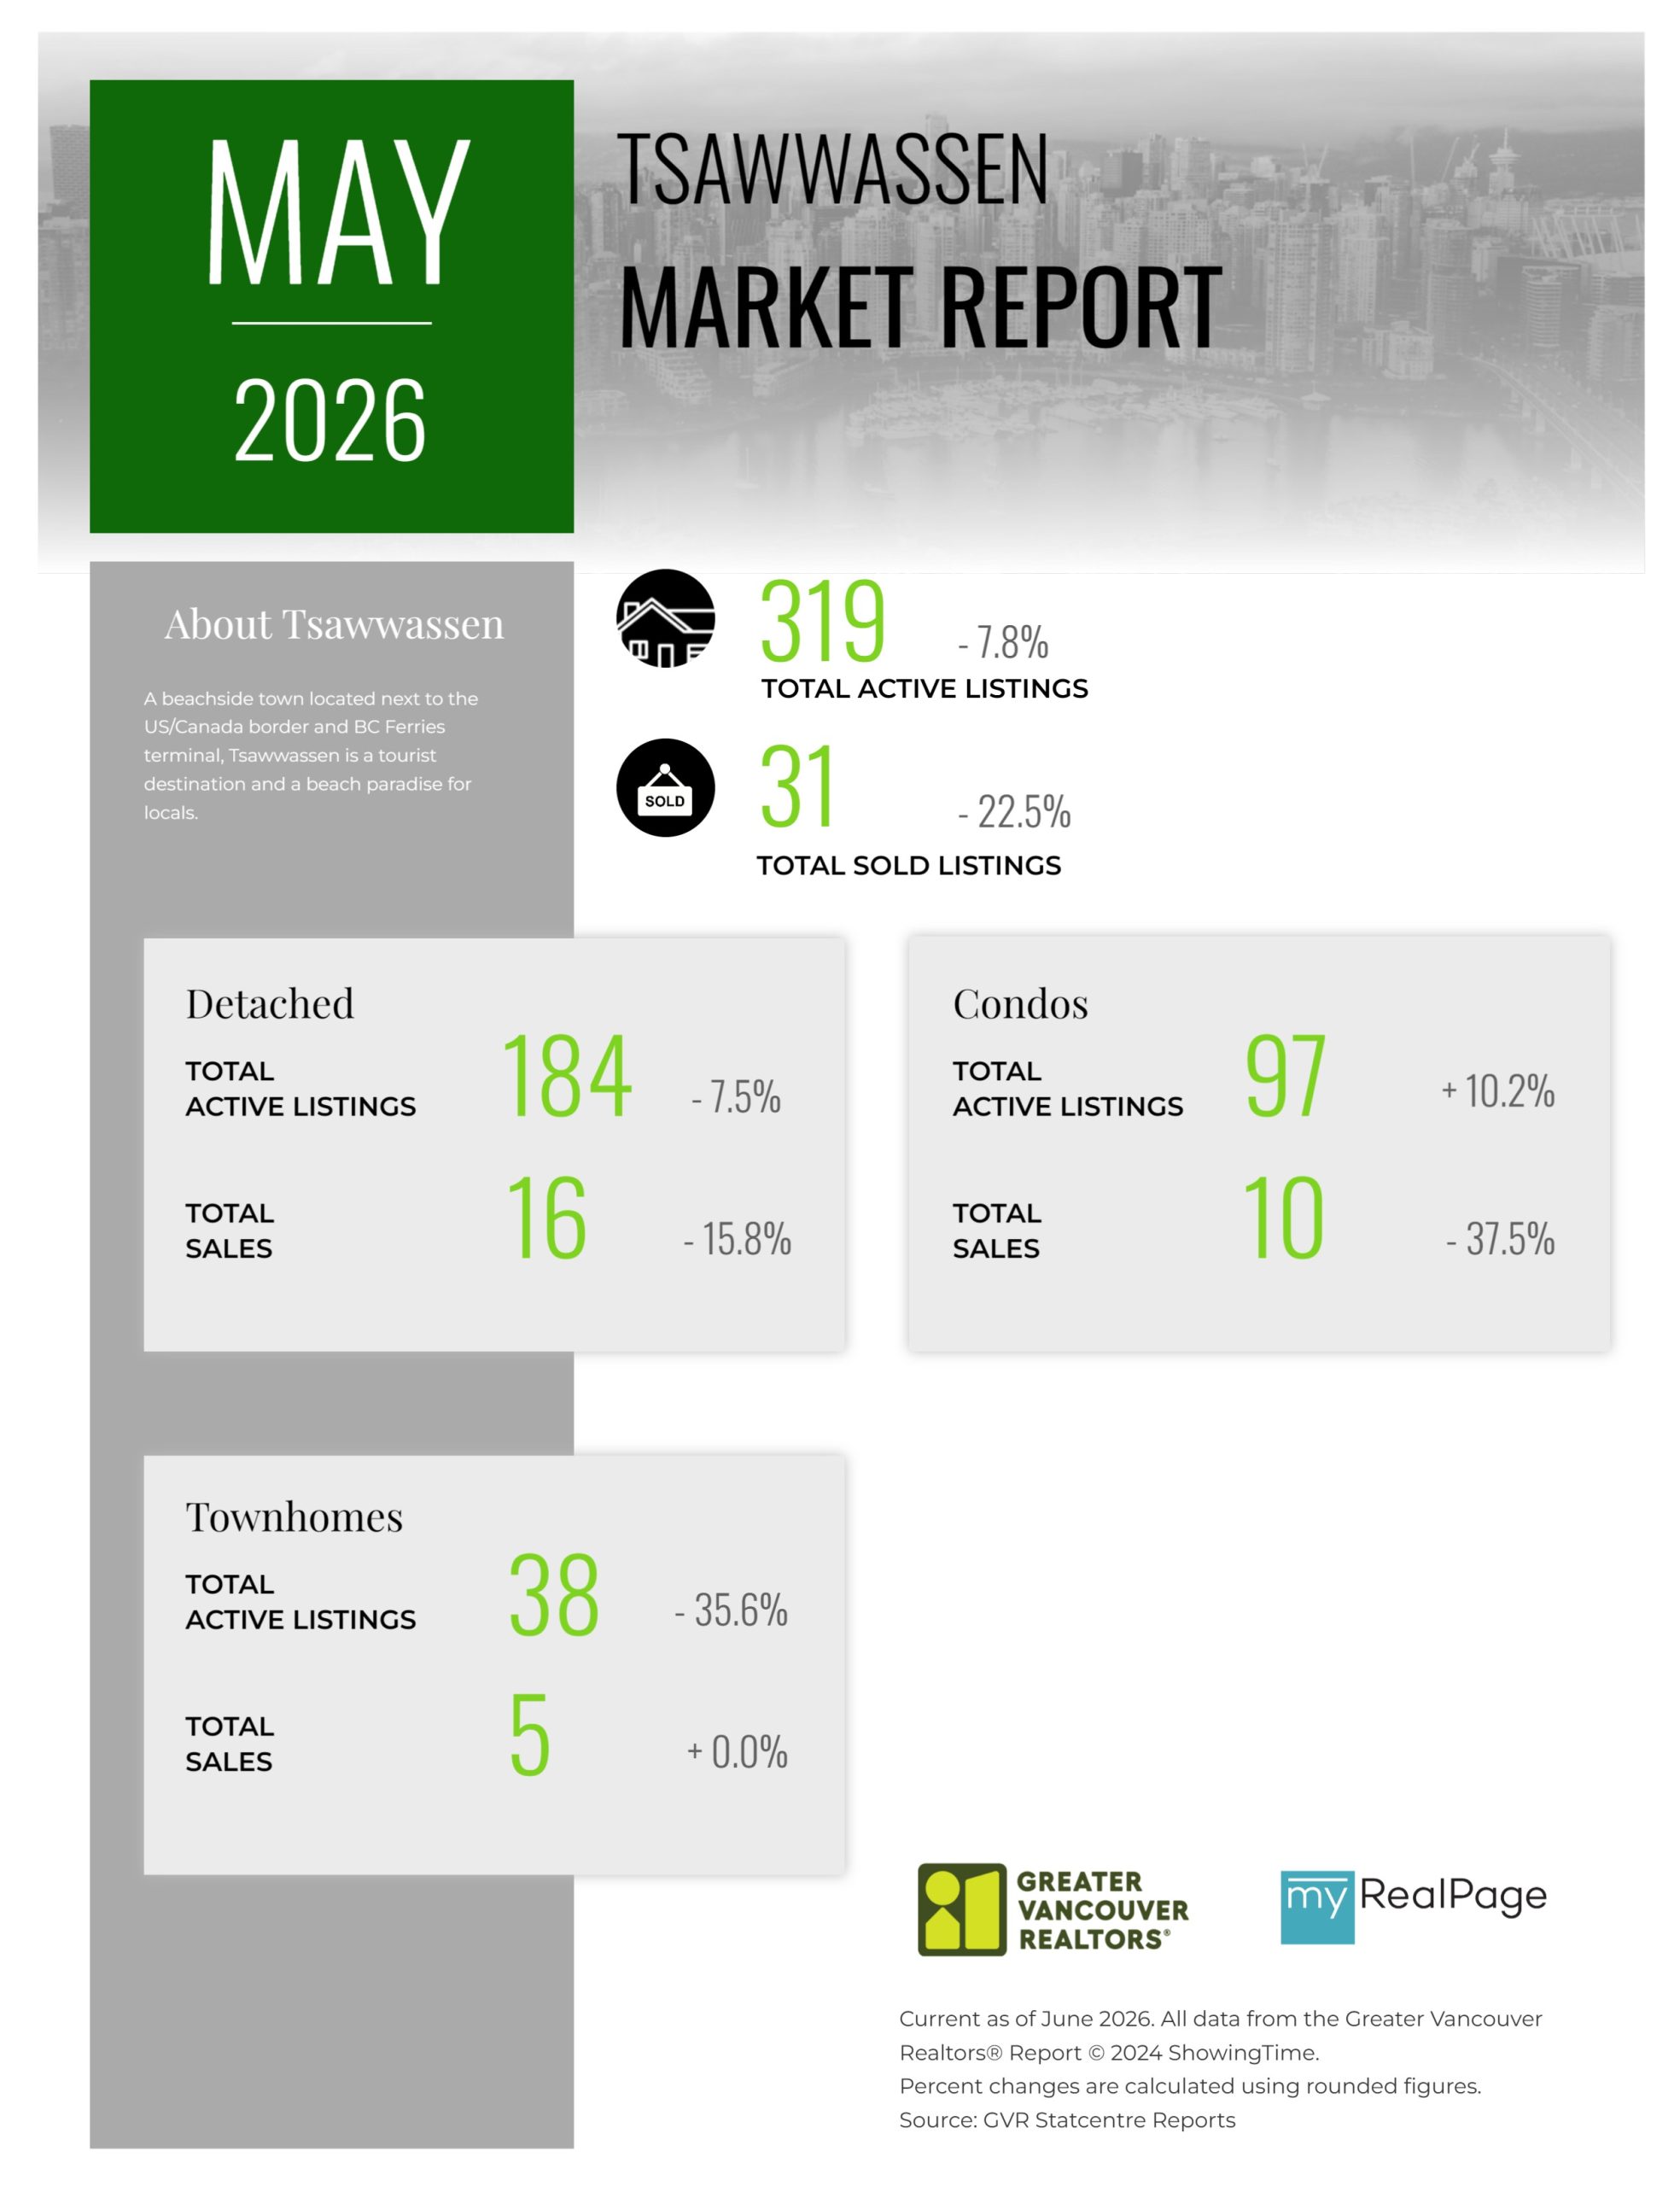
Printable Version – GVR May 2026 Data Infographics Report Tsawwassen


INFOGRAPHICS: April 2026 GVR Greater Vancouver Market Reports
Diverging trends widen as detached housing gains steam
Home sales registered on the MLS® in Metro Vancouver* remain relatively flat compared to April last year, but a divergence is emerging between market segments.
The Greater Vancouver REALTORS® (GVR) reports that residential sales in the region totalled 2,110 in April 2026, a 2.5 per cent decrease from the 2,163 sales recorded in April 2025. This total also represents a 22.9 per cent decline from the 10-year seasonal average (2,735).
“Last month we noted that a divergence was emerging between sales trends in the detached and multi-family segments, which continued in April. Sales of detached homes have been gaining year-over-year, while sales in the multi-family segment have declined, and this pattern is consistent across most areas. The fact this pattern is so broad-based reduces the likelihood that what we’re seeing is just a blip in the data since the momentum isn’t isolated to small pockets of the market.” said Andrew Lis, GVR chief economist and vice-president data analytics
Read the full report on the REBGV website!
The following data is a comparison between April 2026 and April 2025 numbers, and is current as of May of 2026. For last month’s update, you can check out our previous post!
Or follow this link for all our GVR Infographics!
These infographics cover current trends in several areas within the Greater Vancouver region. Click on the images for a larger view!
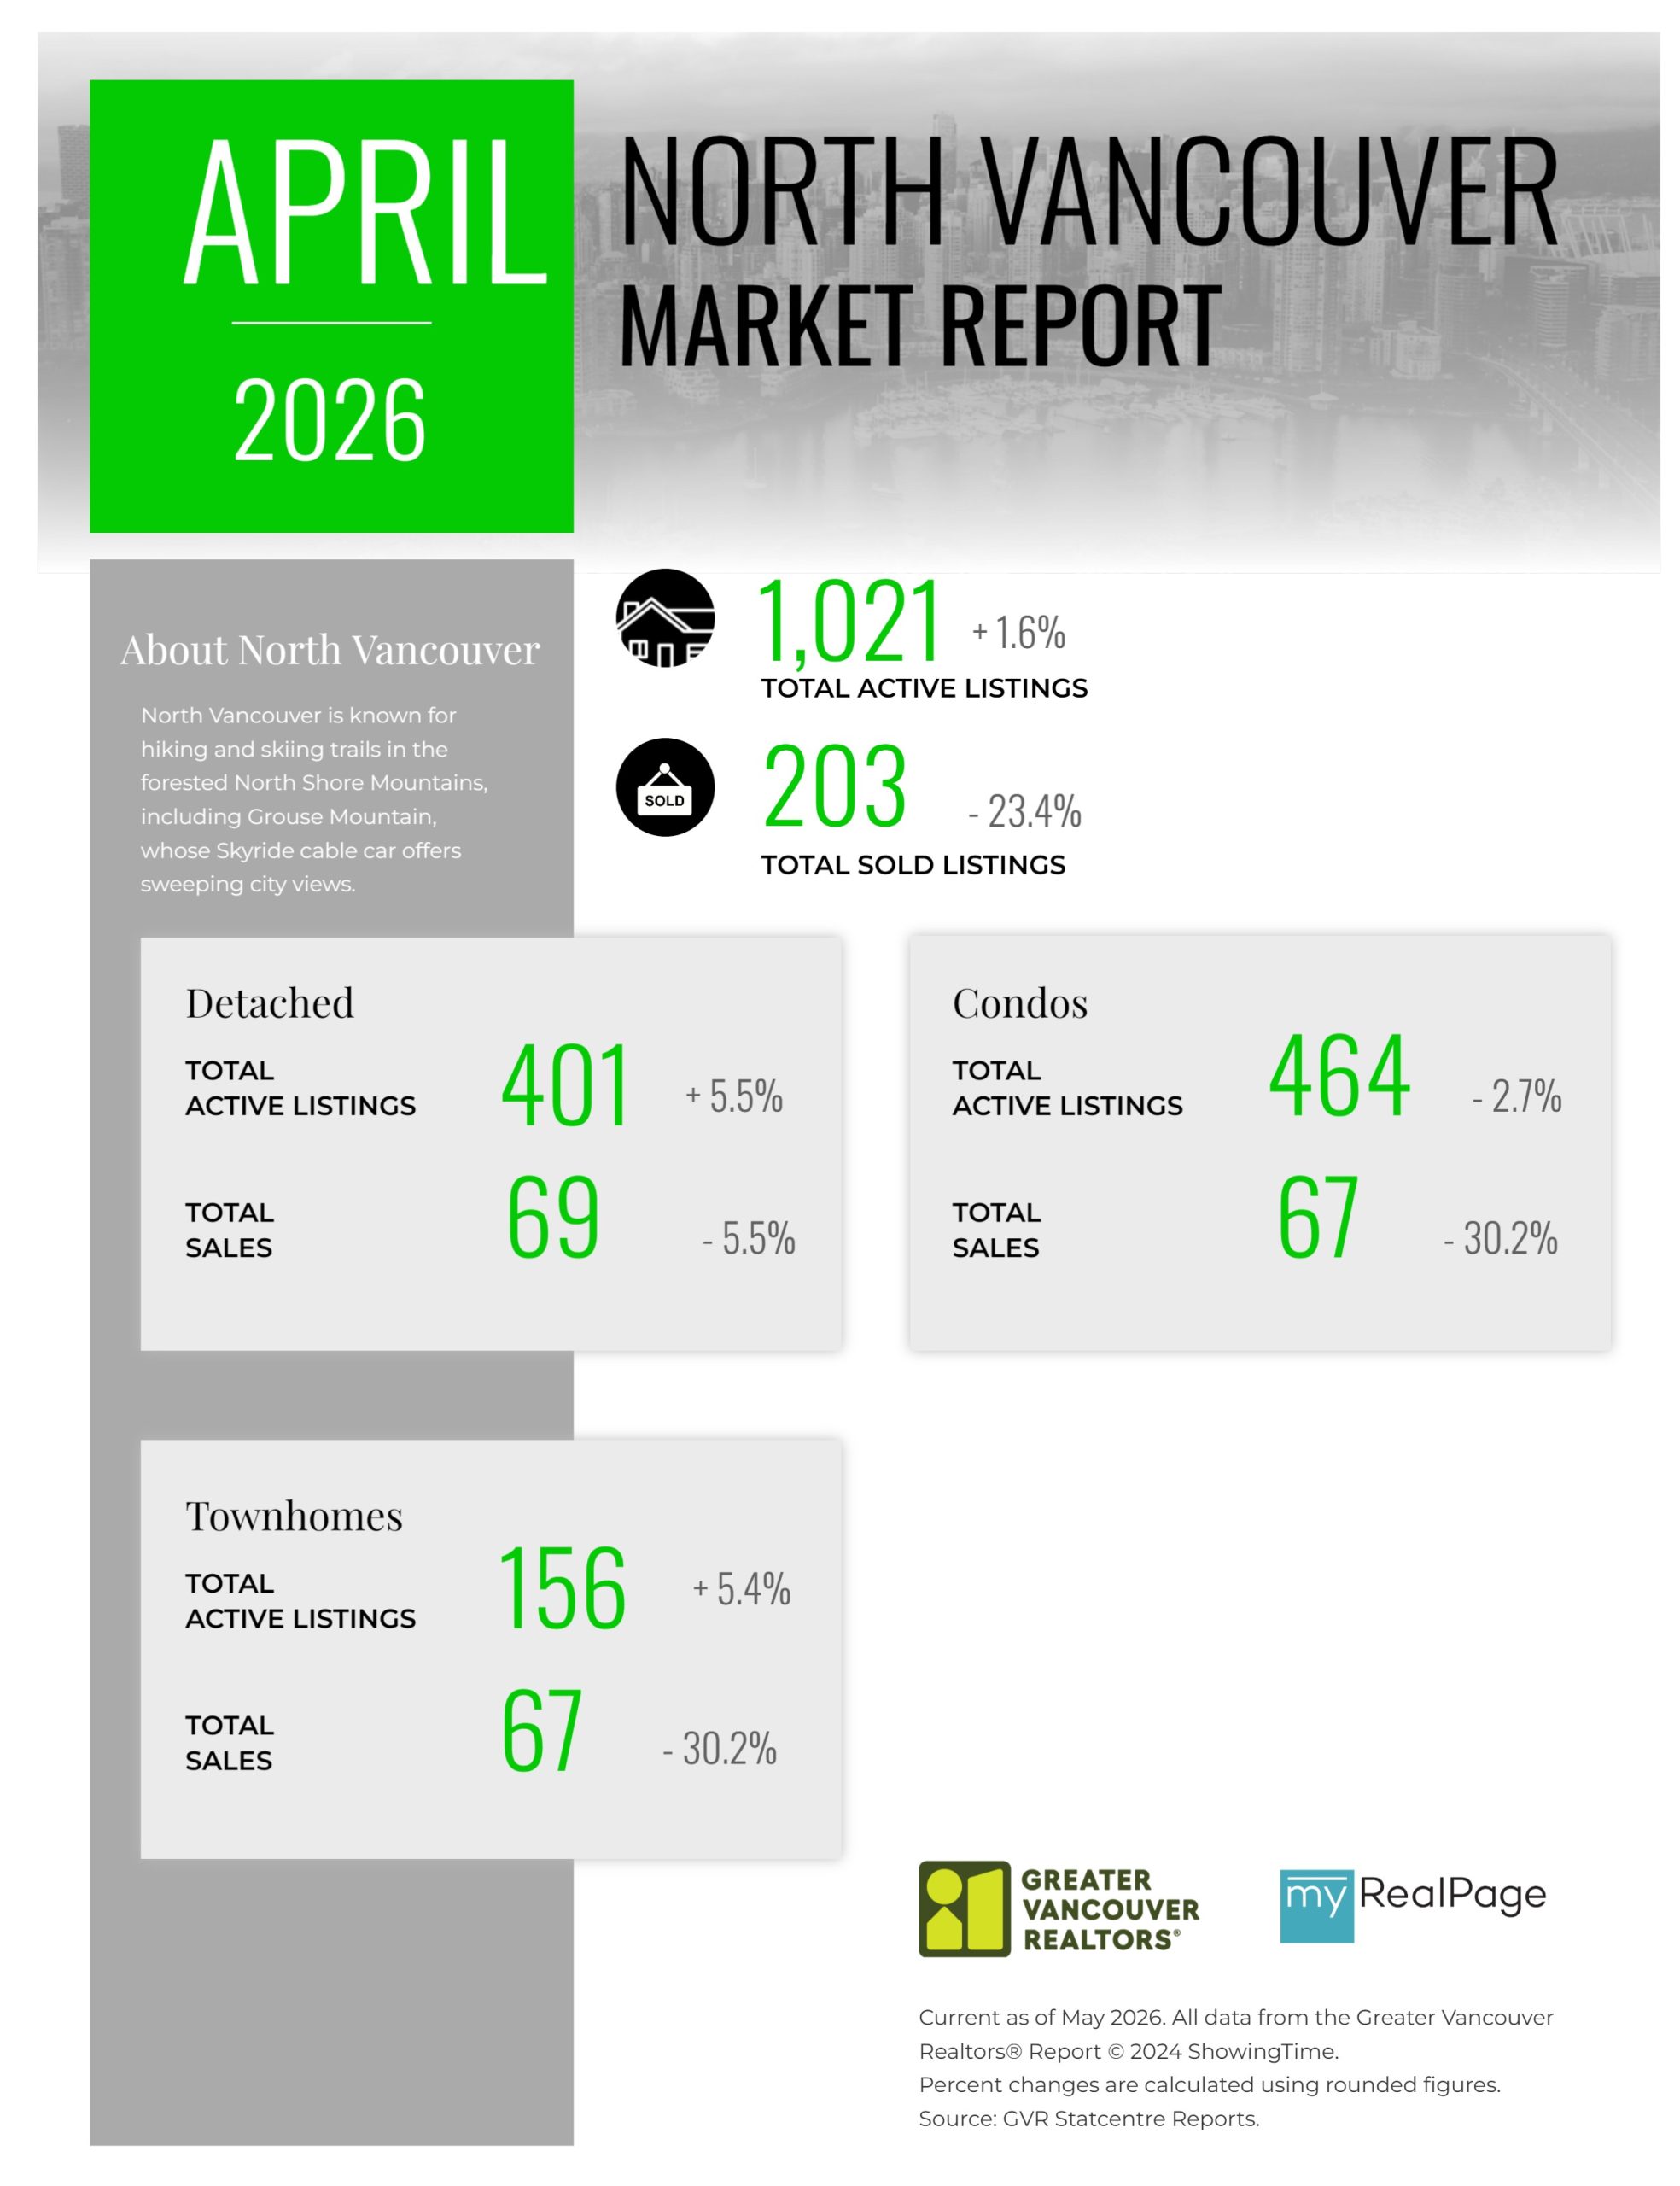
Printable Version – GVR April 2026 Data Infographic Report North Vancouver
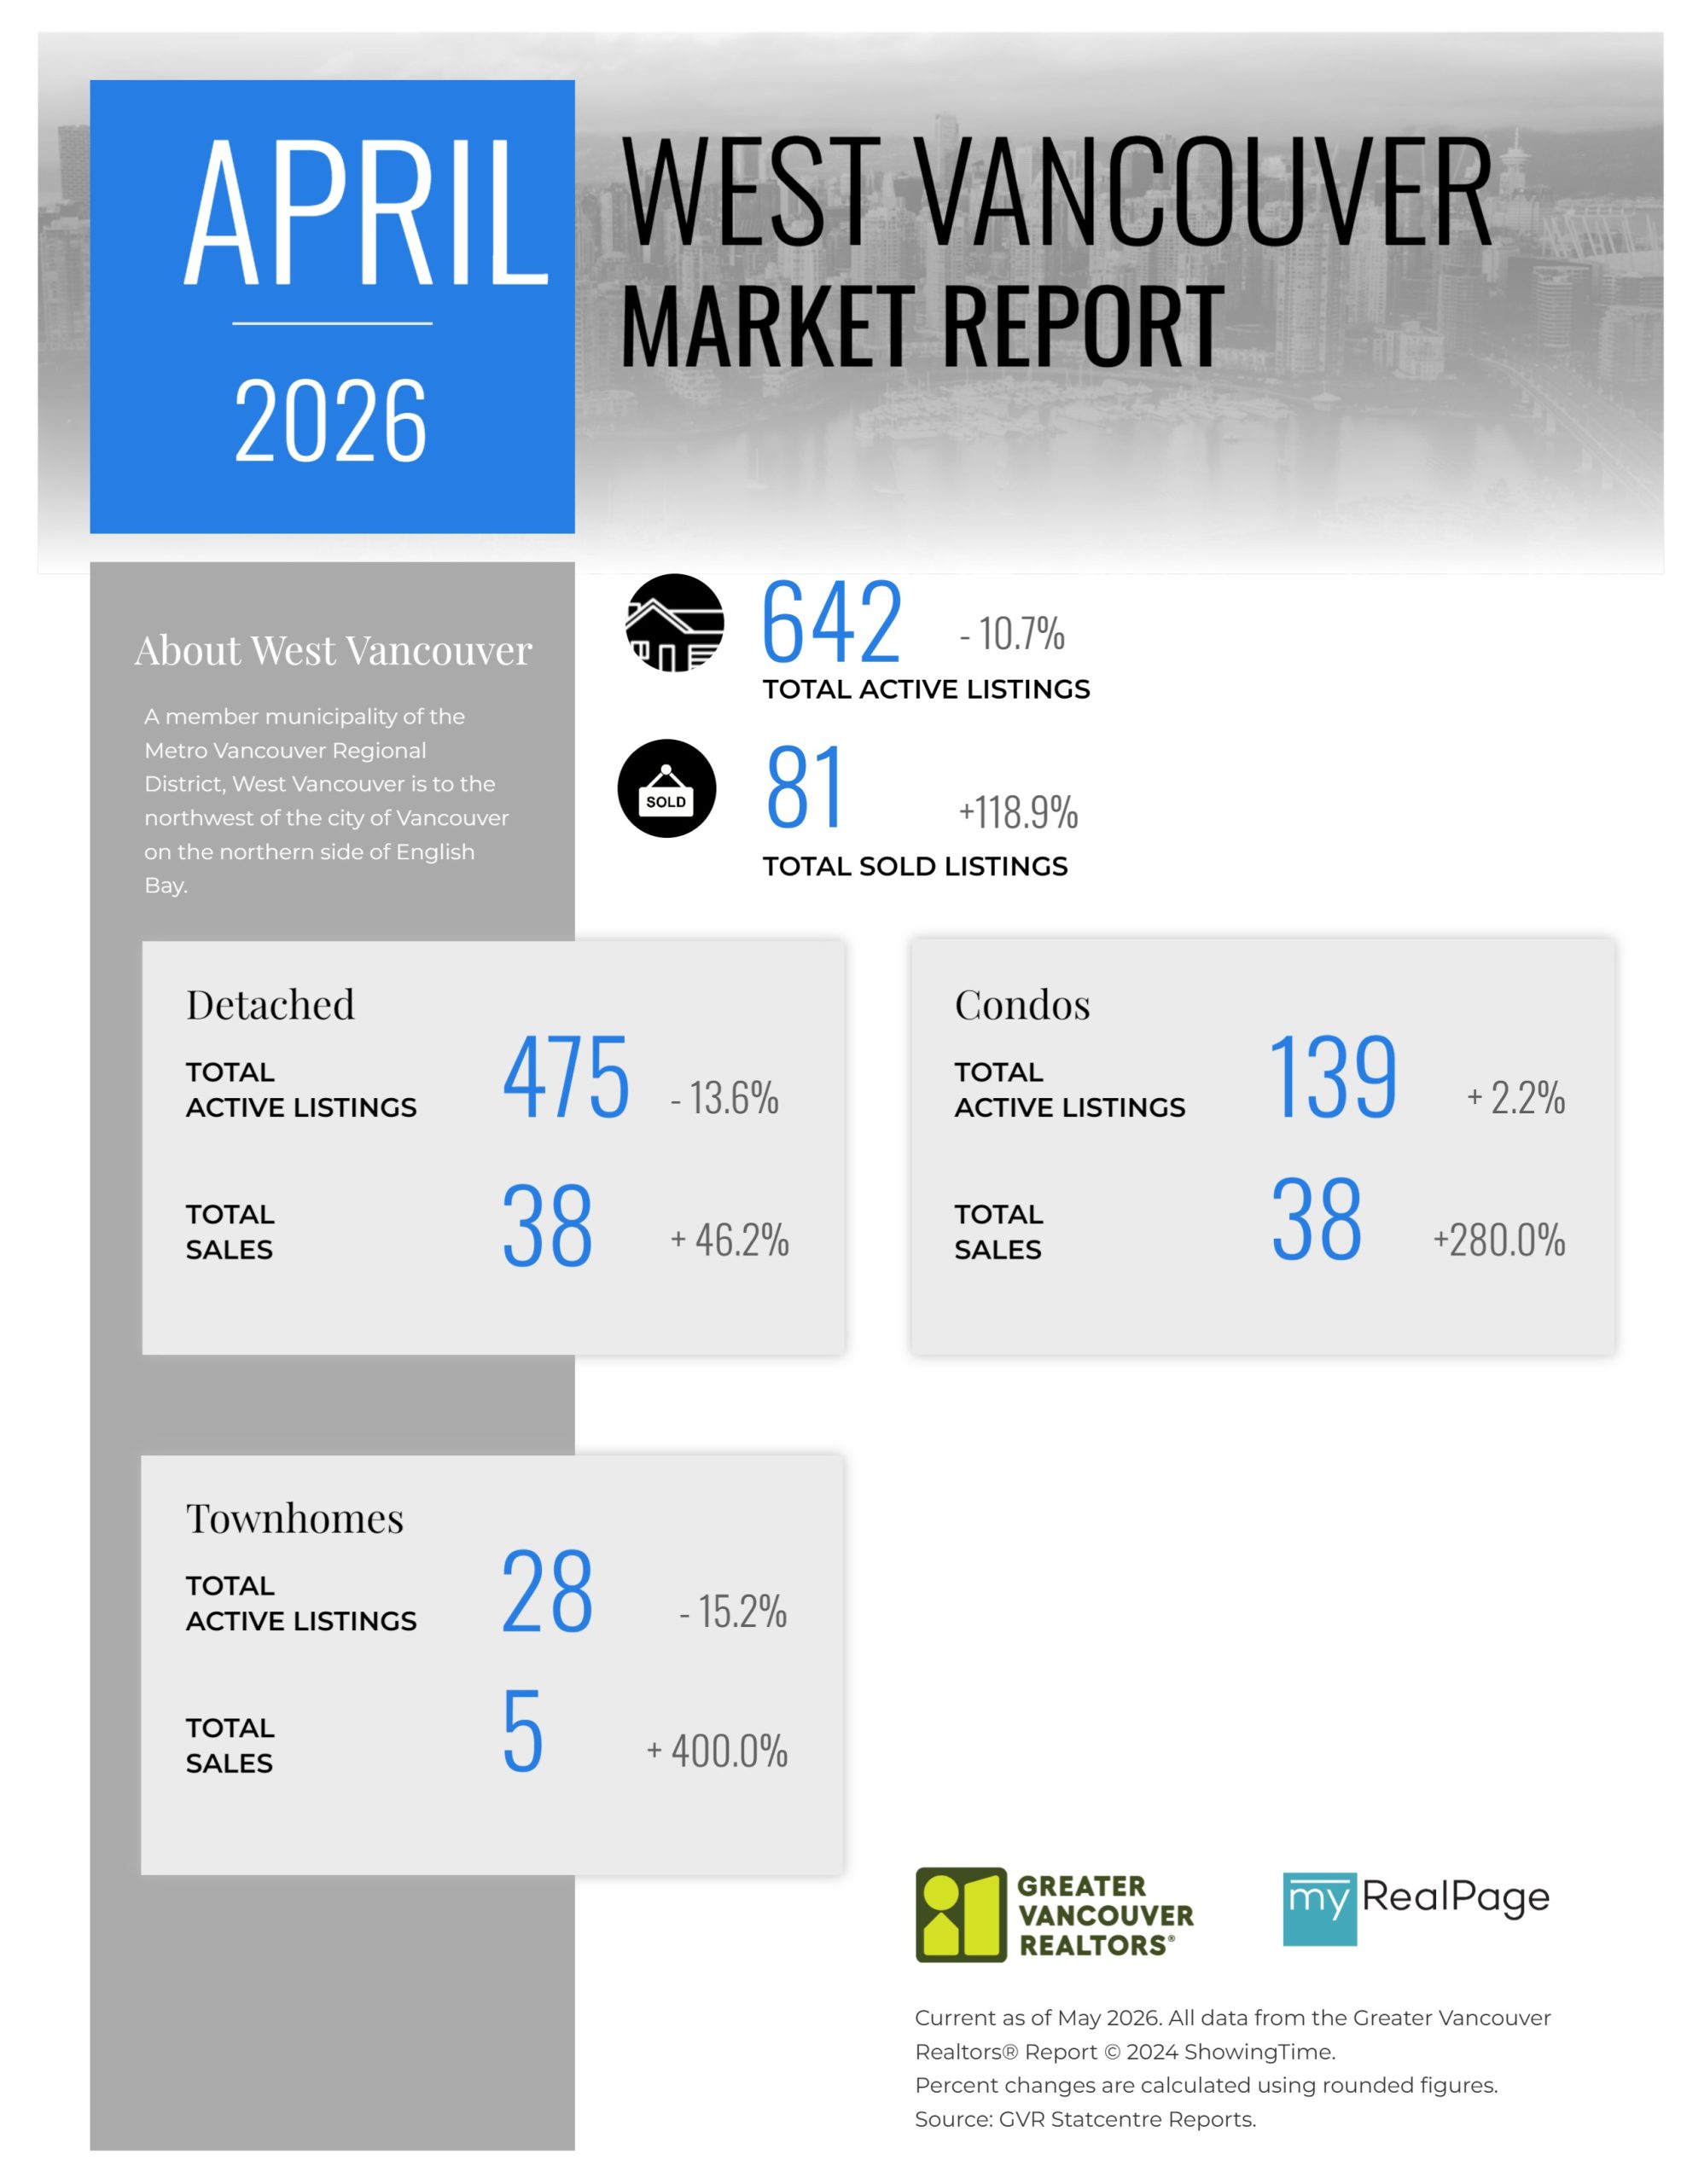
Printable Version – GVR April 2026 Data Infographics Report West Vancouver
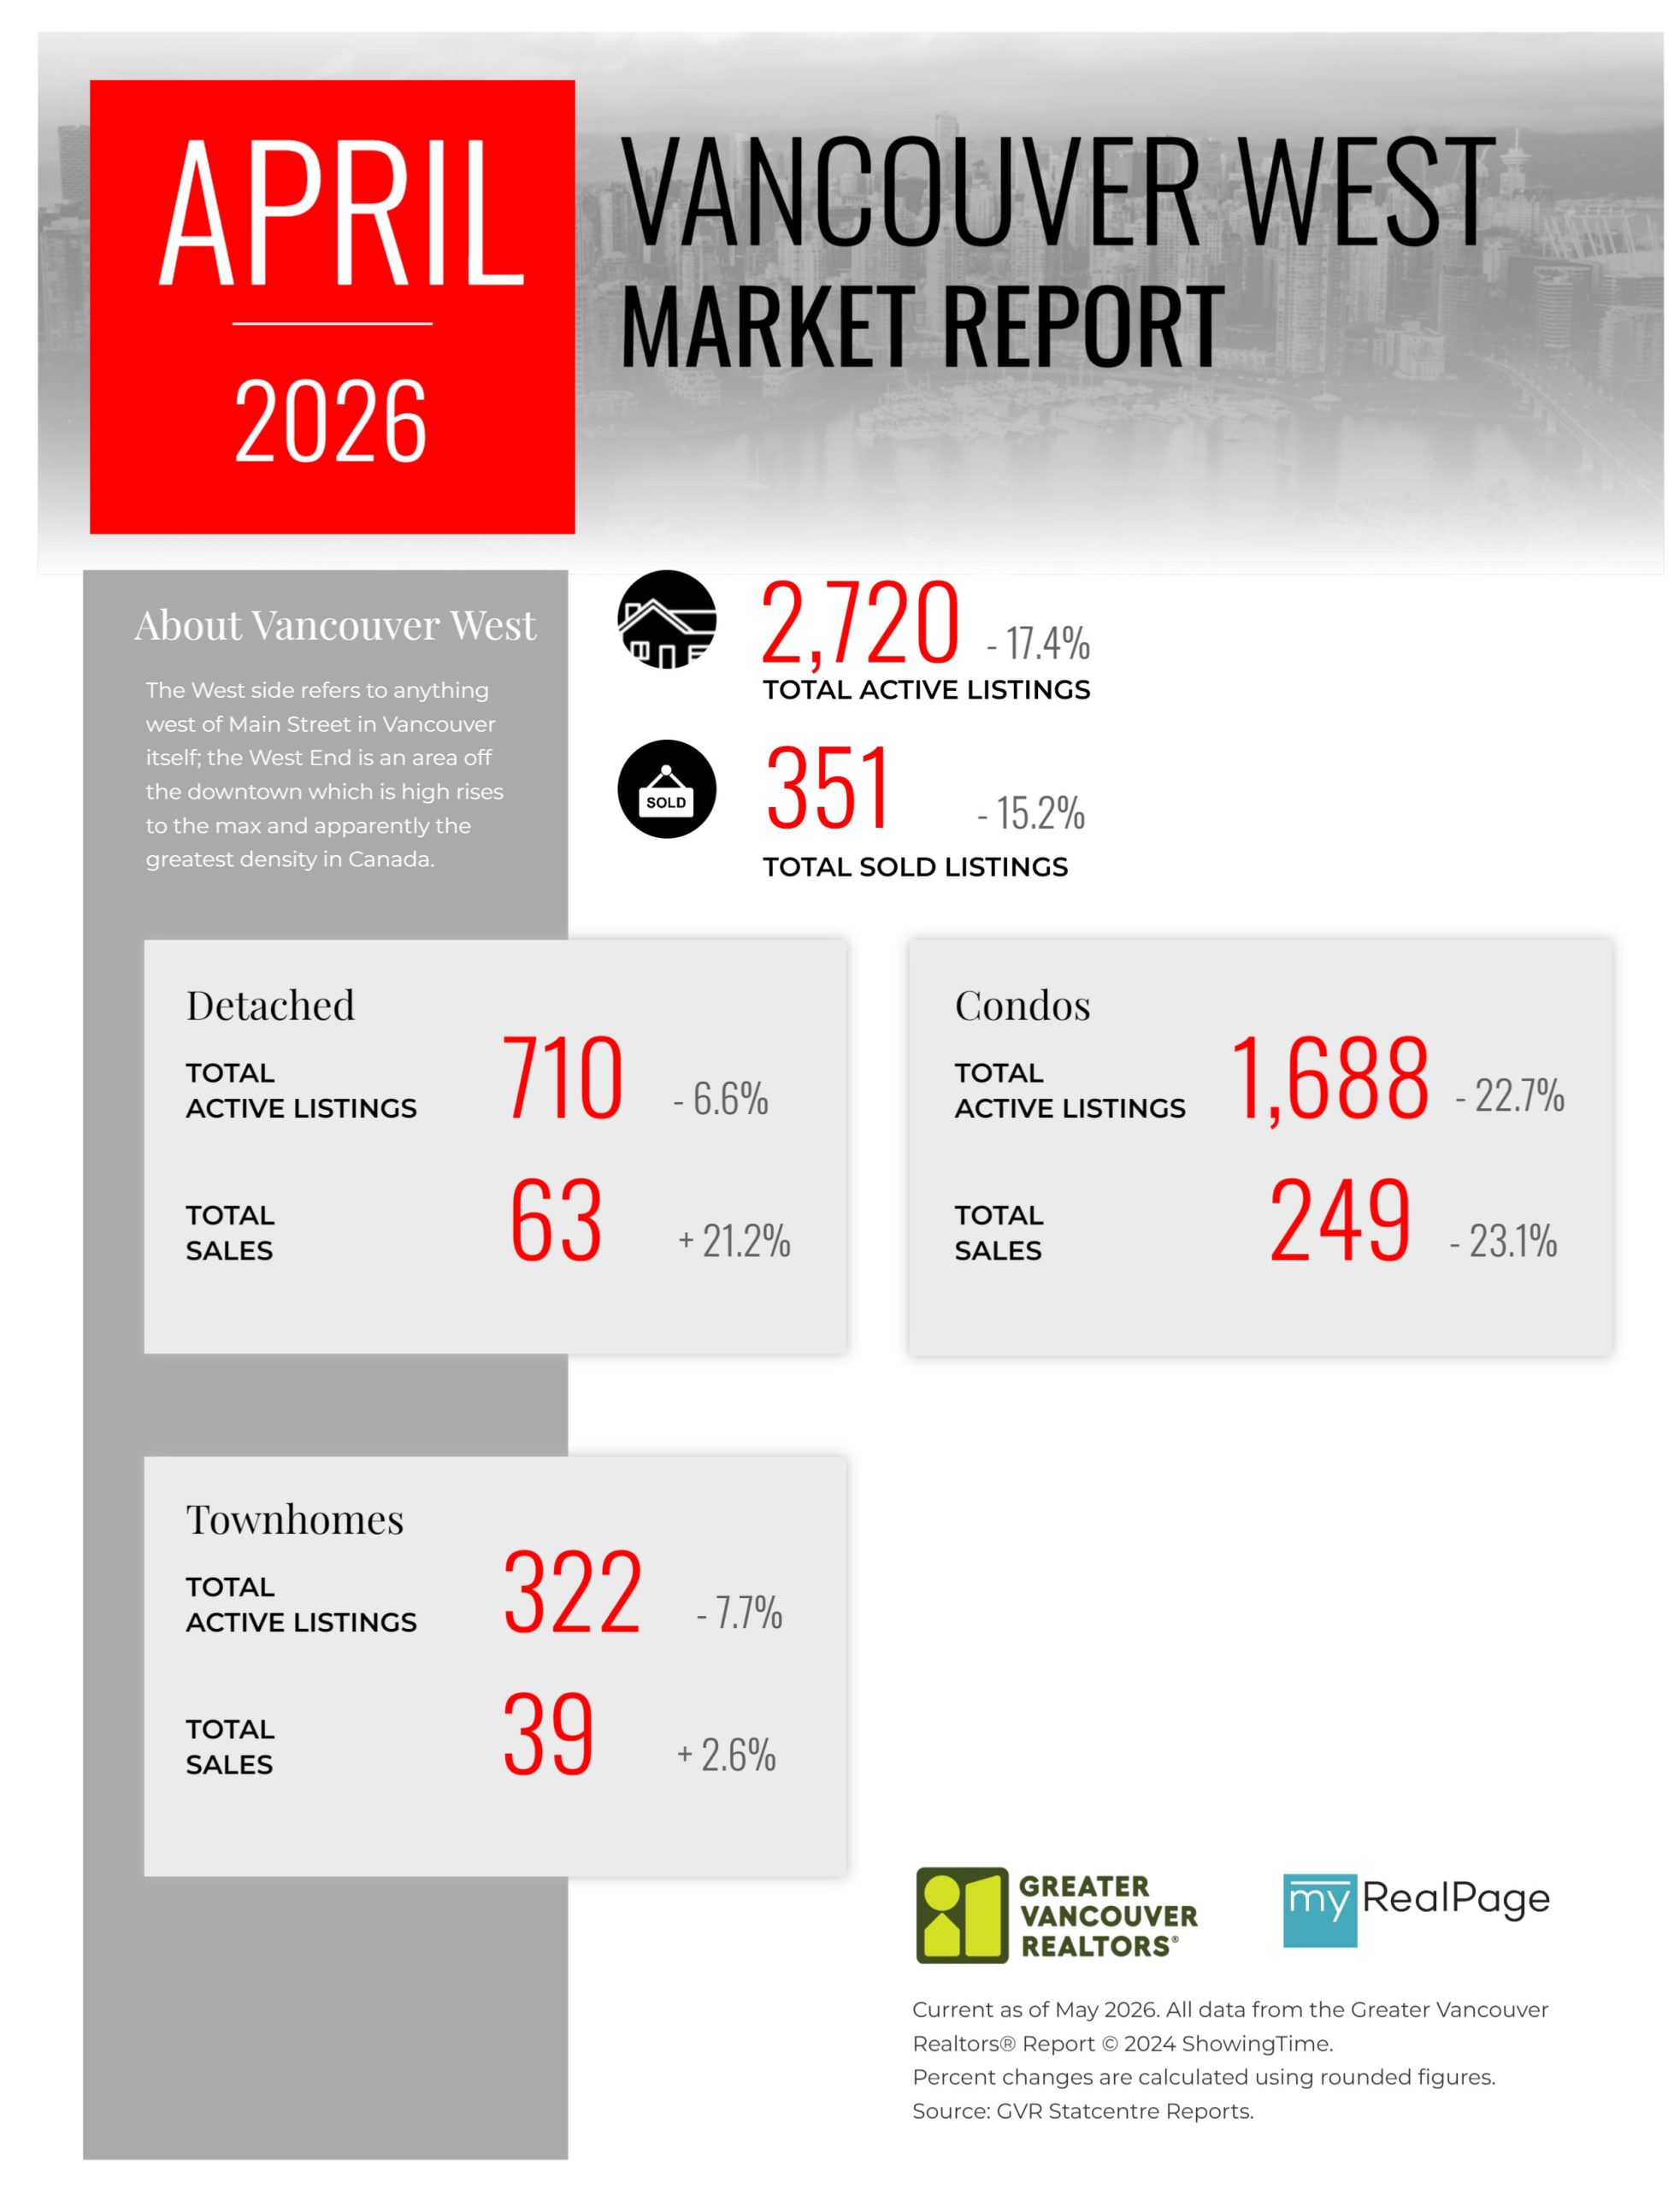
Printable Version – GVR April 2026 Data Infographics Report Vancouver West
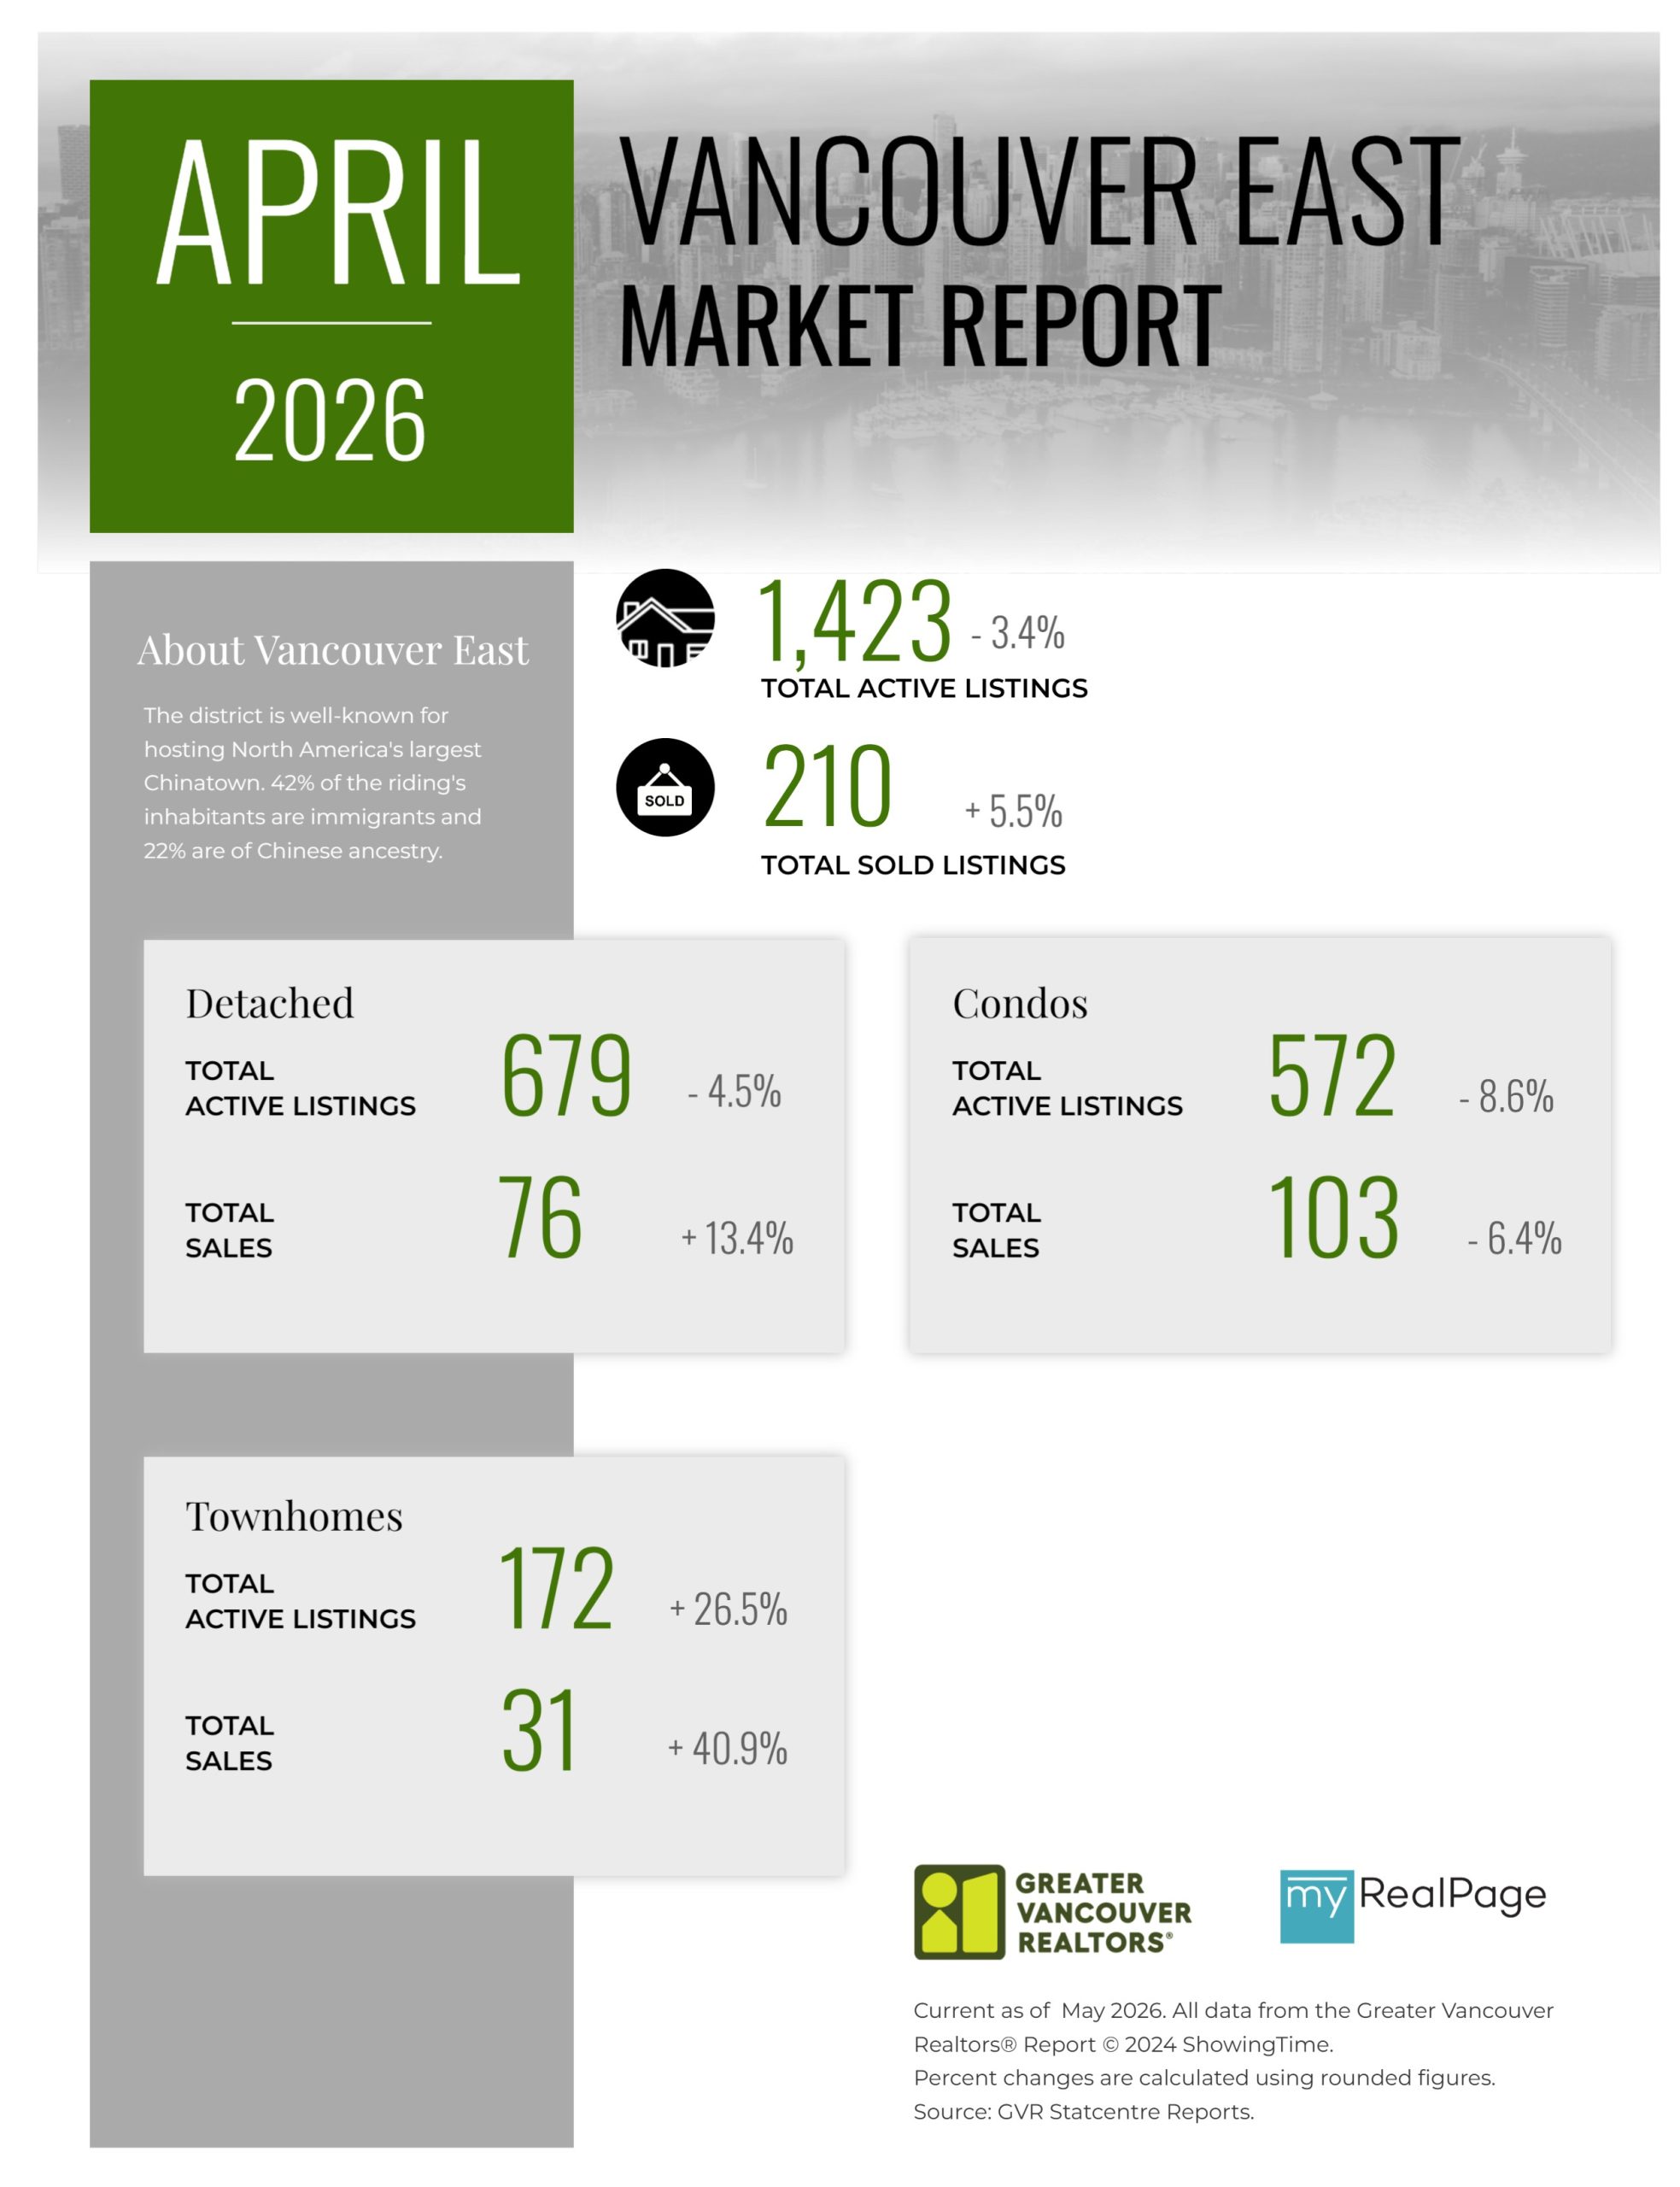
Printable Version – GVR April 2026 Data Infographics Report Vancouver East
Printable Version – GVR April 2026 Data Infographic Report Maple Ridge
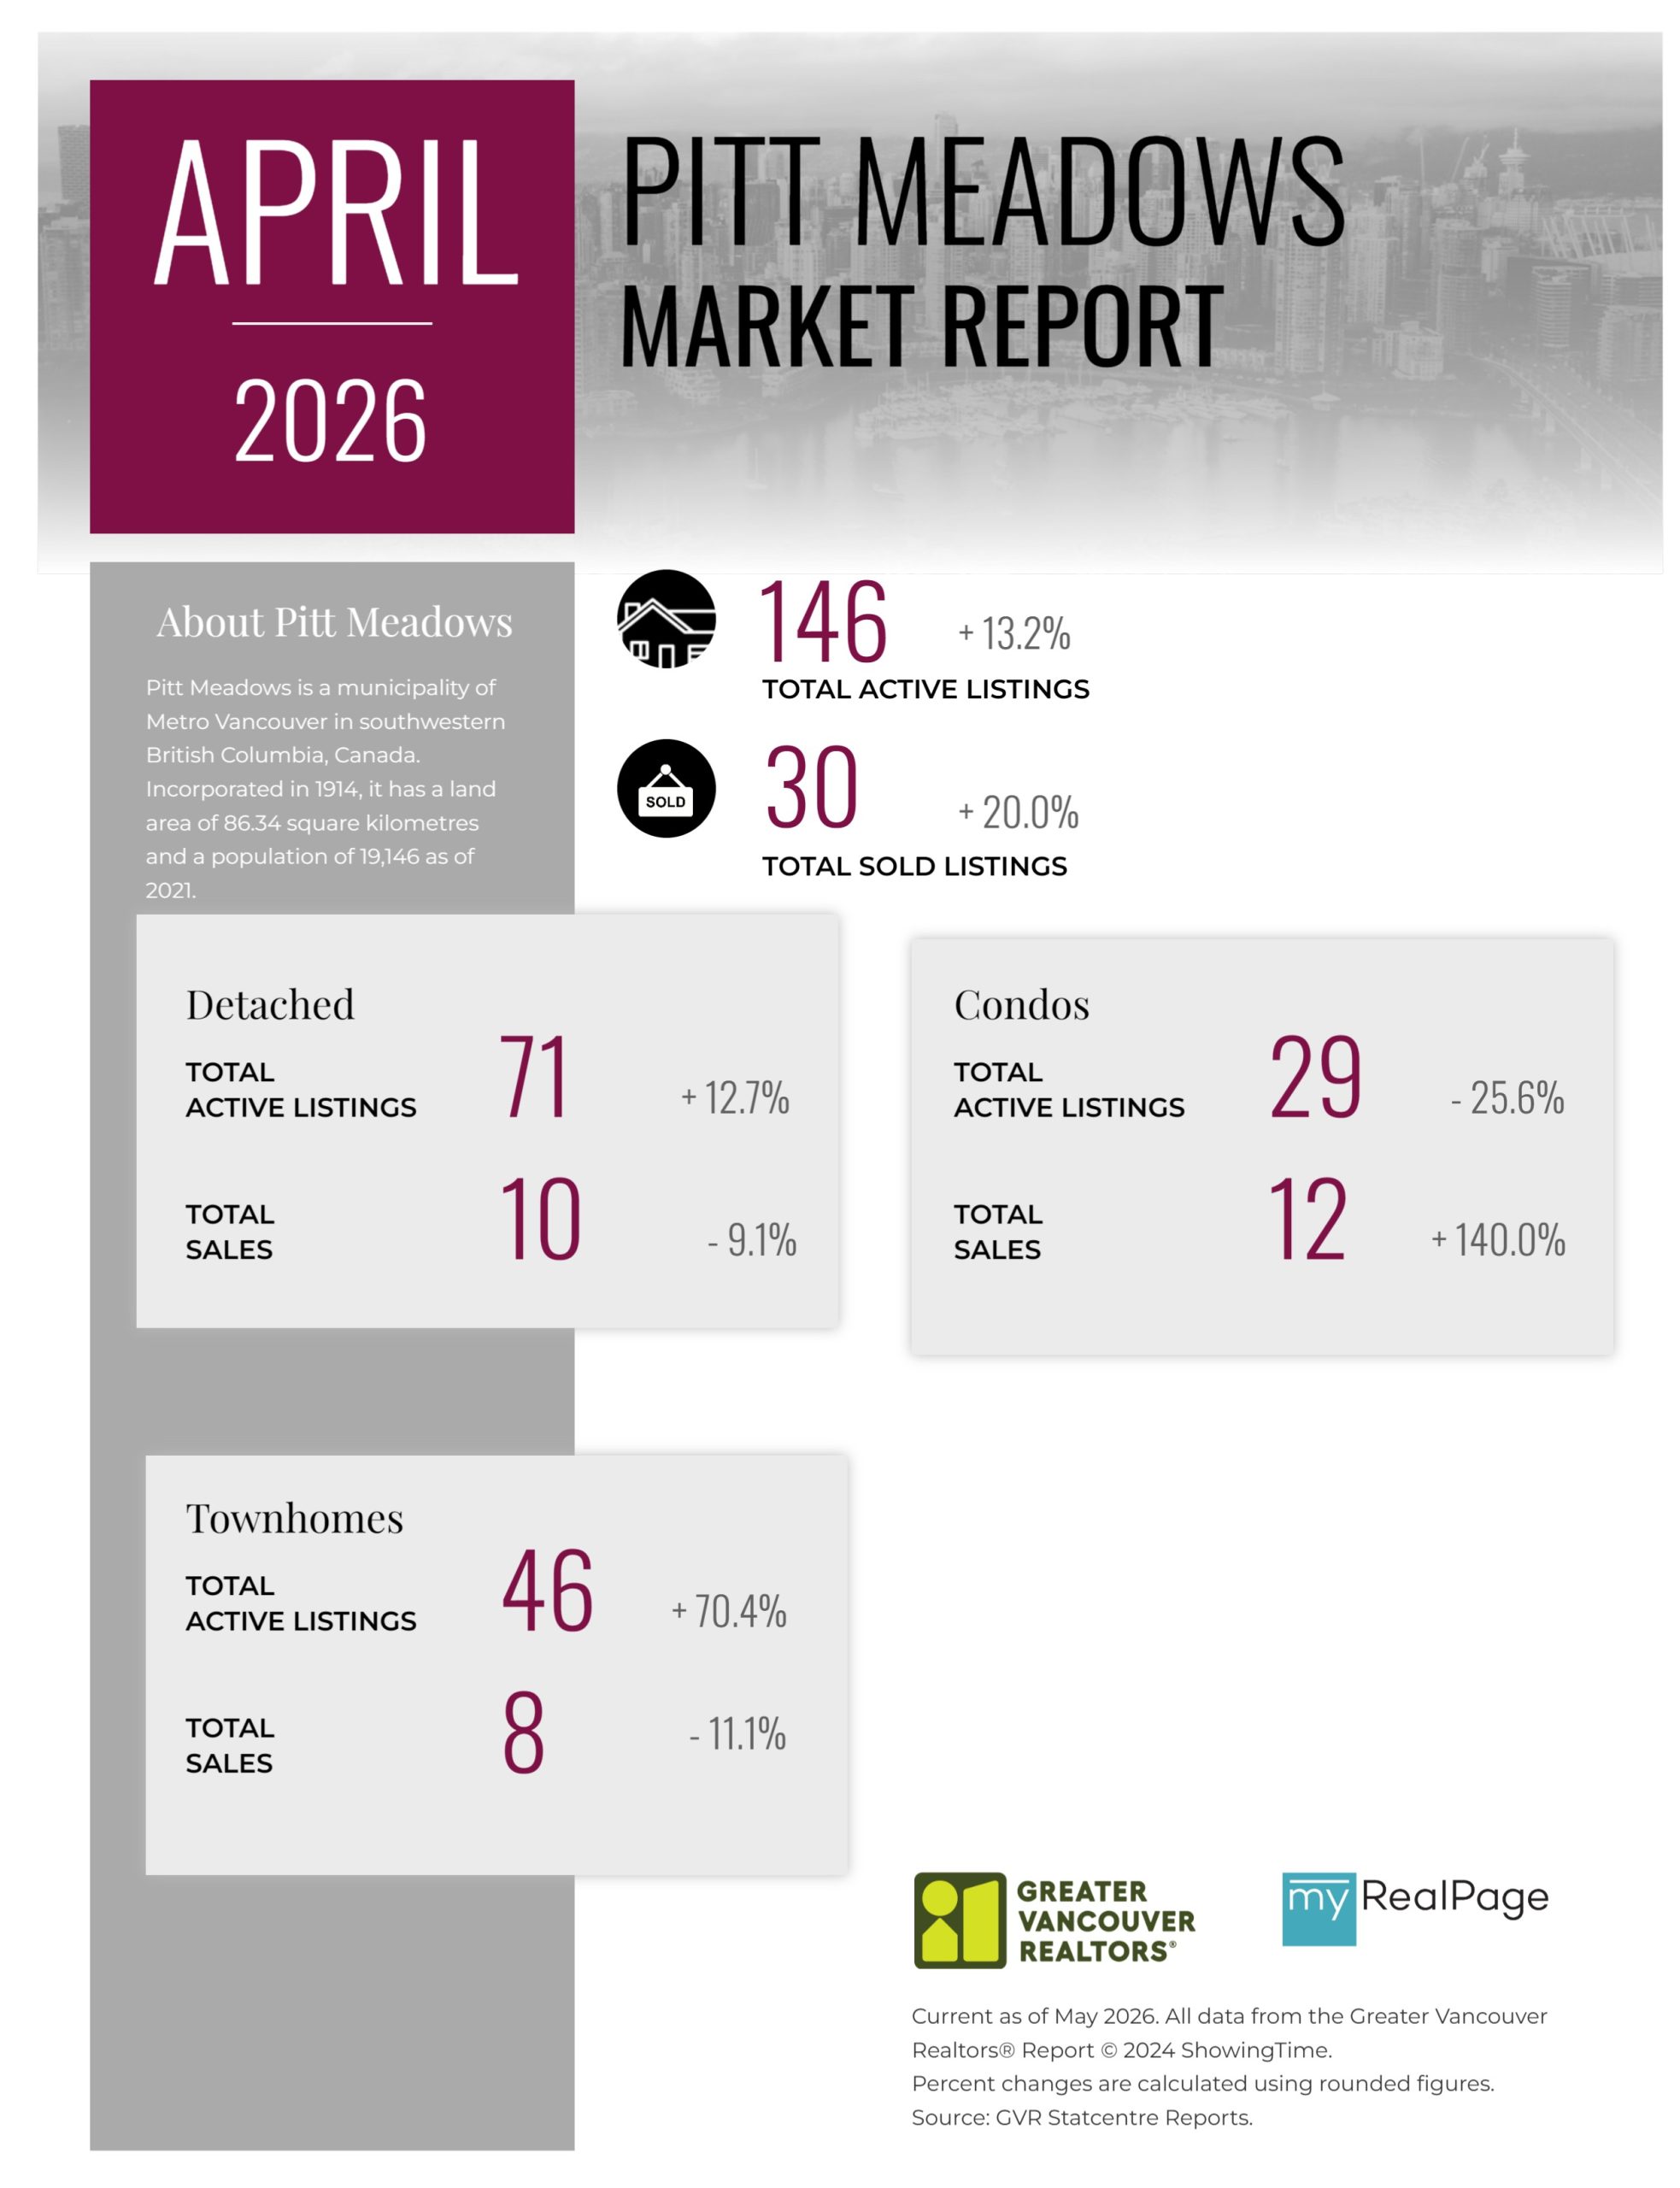
Printable Version – GVR April 2026 Data Infographics Report Pitt Meadows
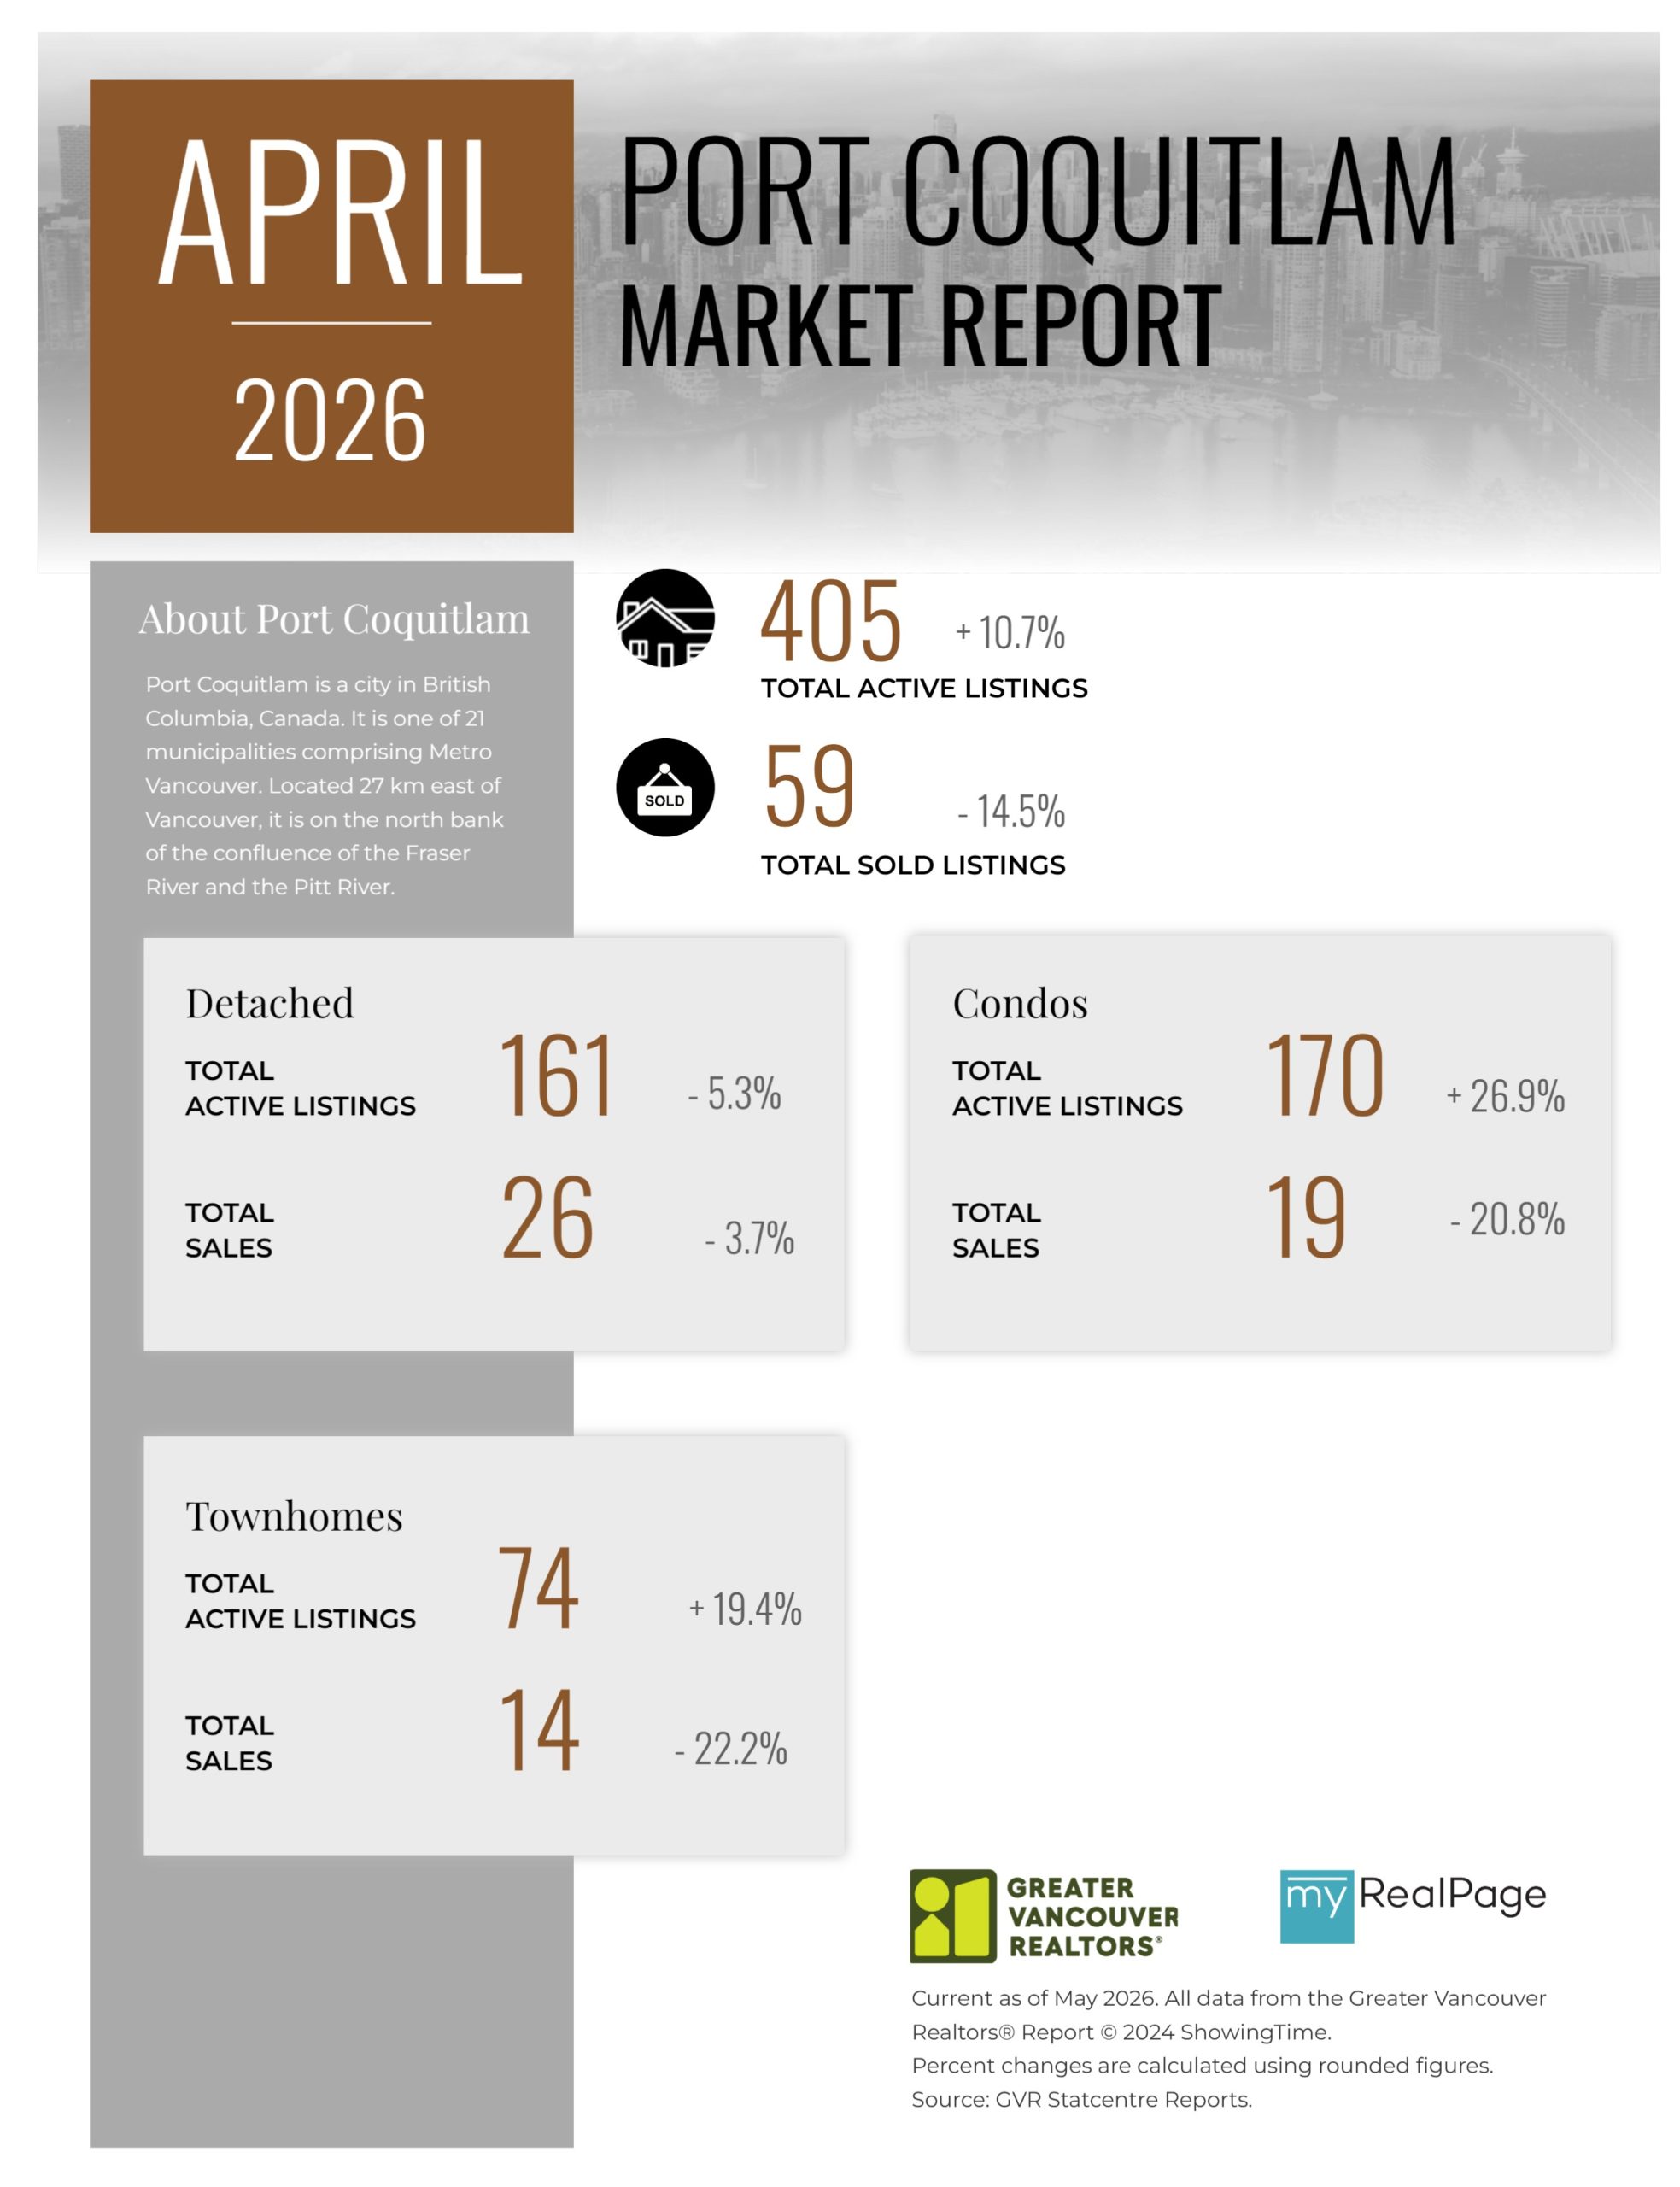
Printable Version – GVR April 2026 Data Infographics Report Port Coquitlam
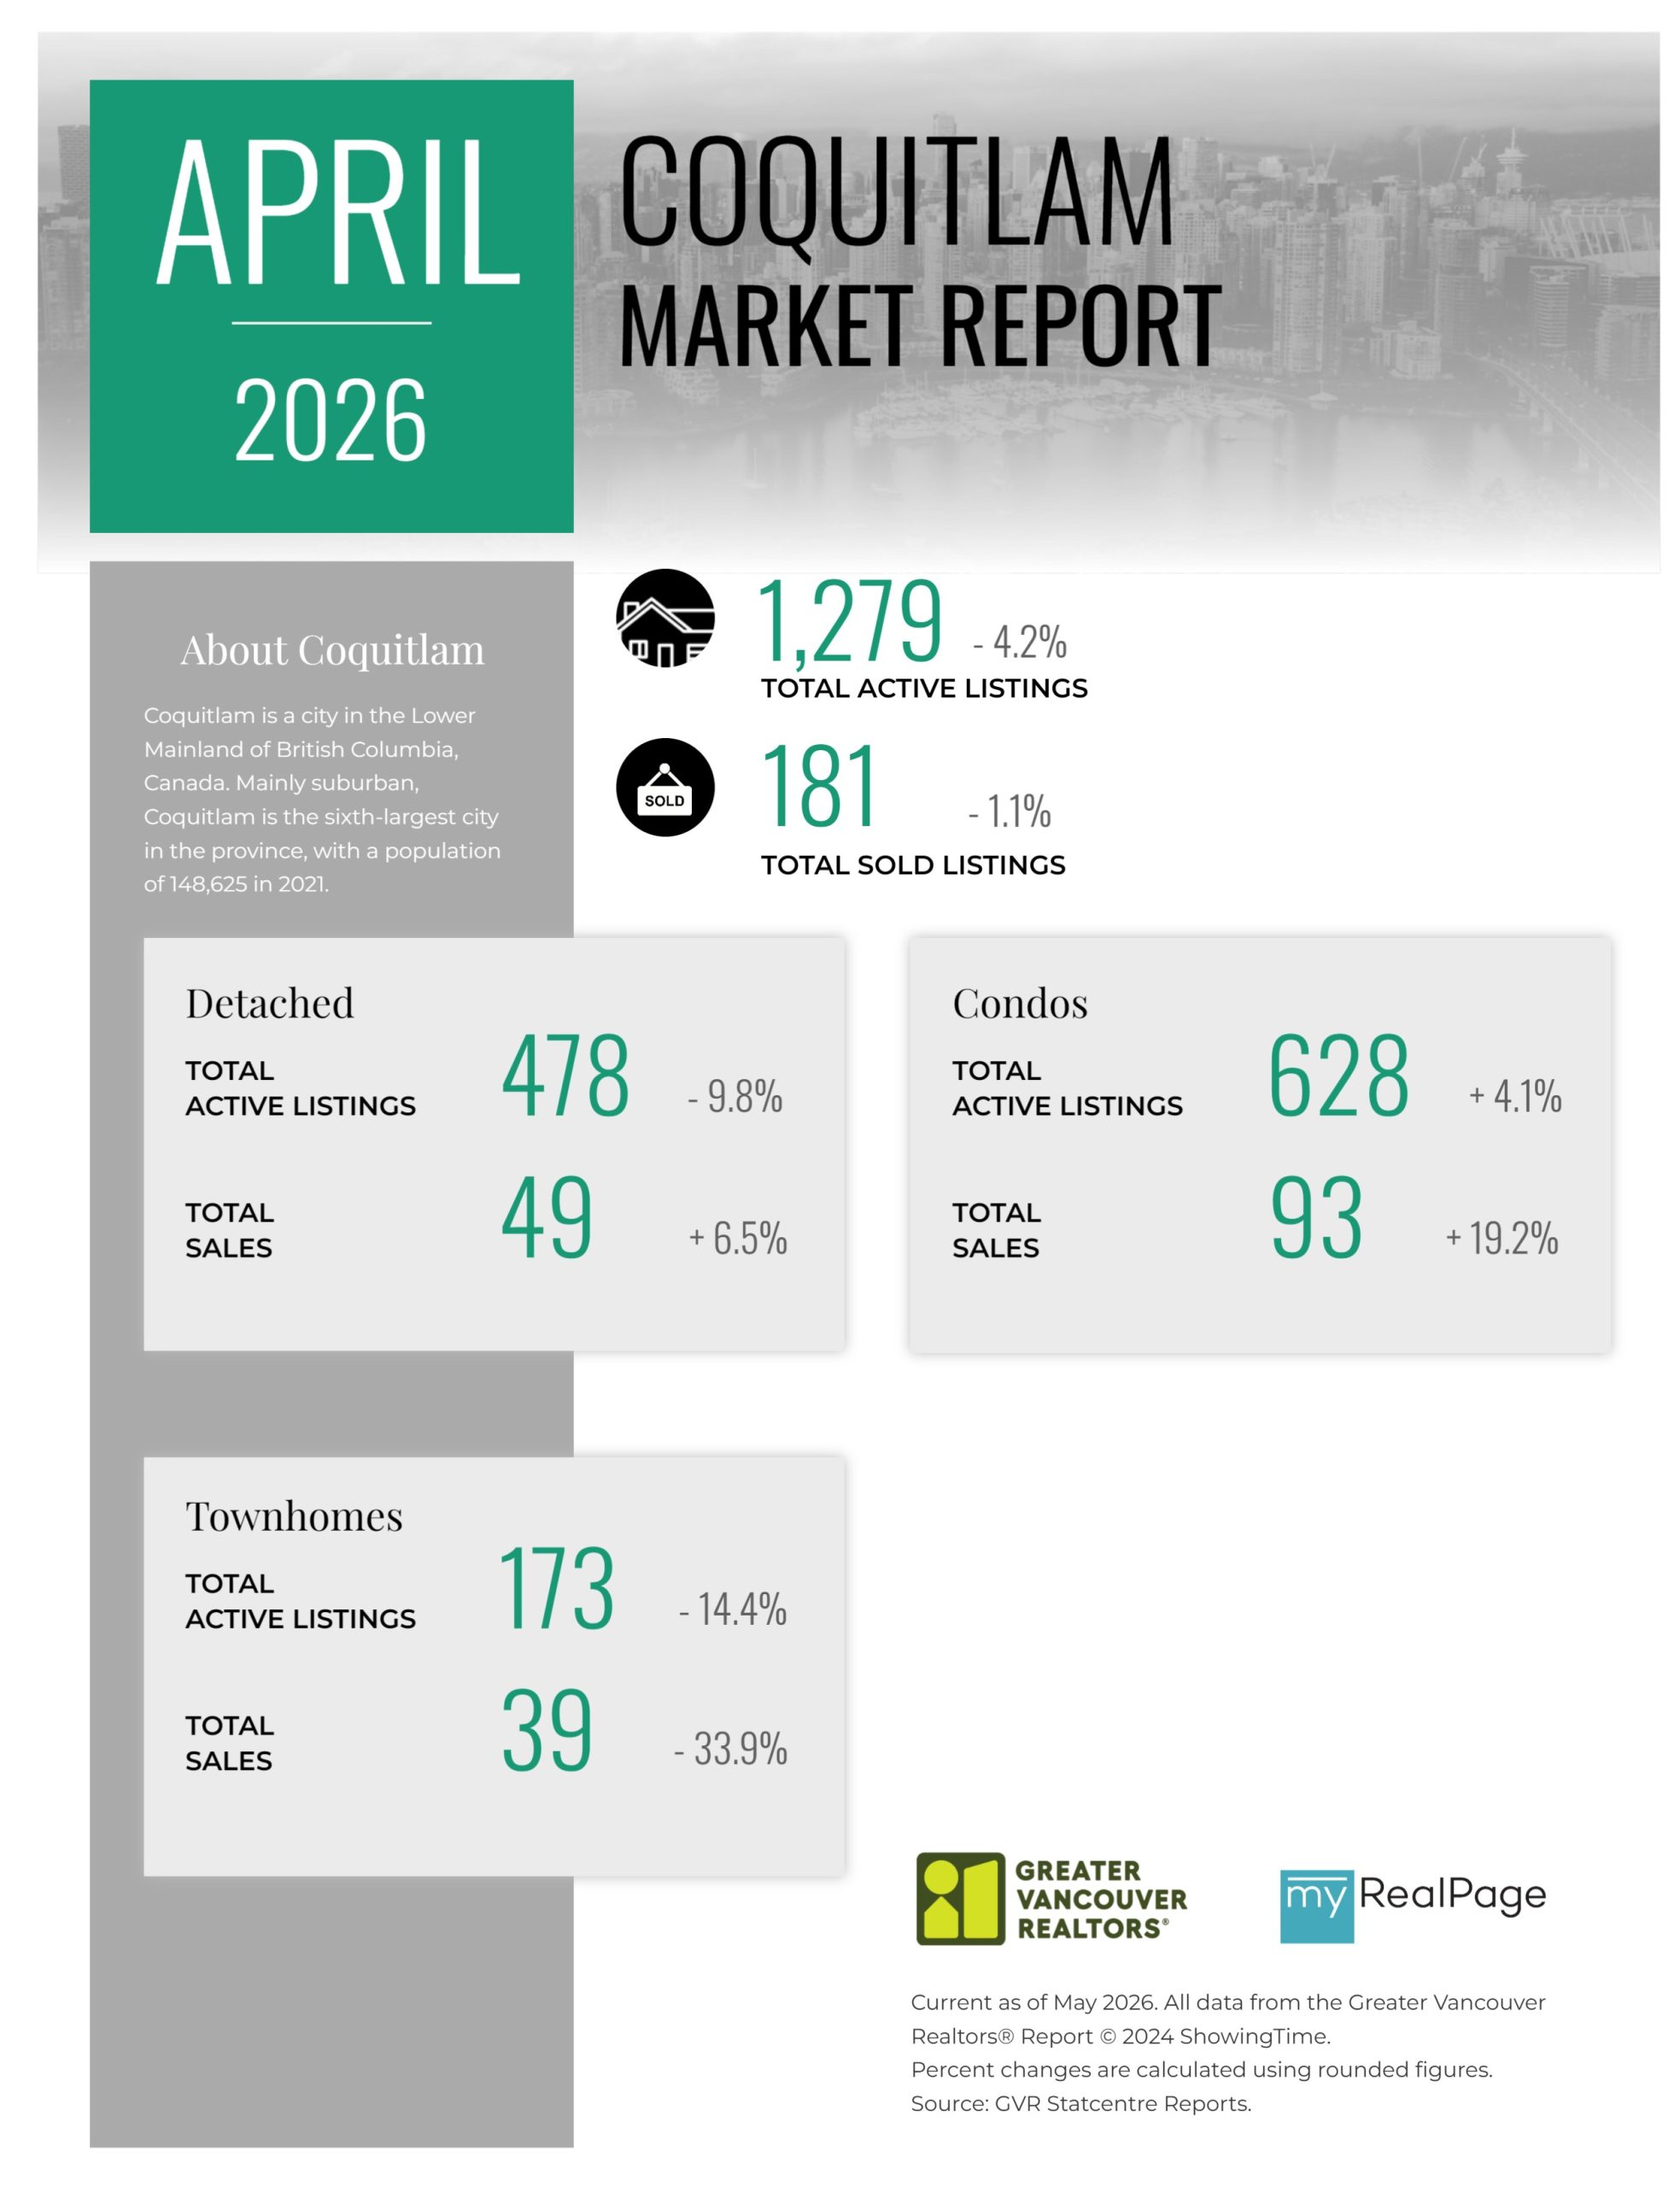
Printable Version – GVR April 2026 Data Infographics Report Coquitlam
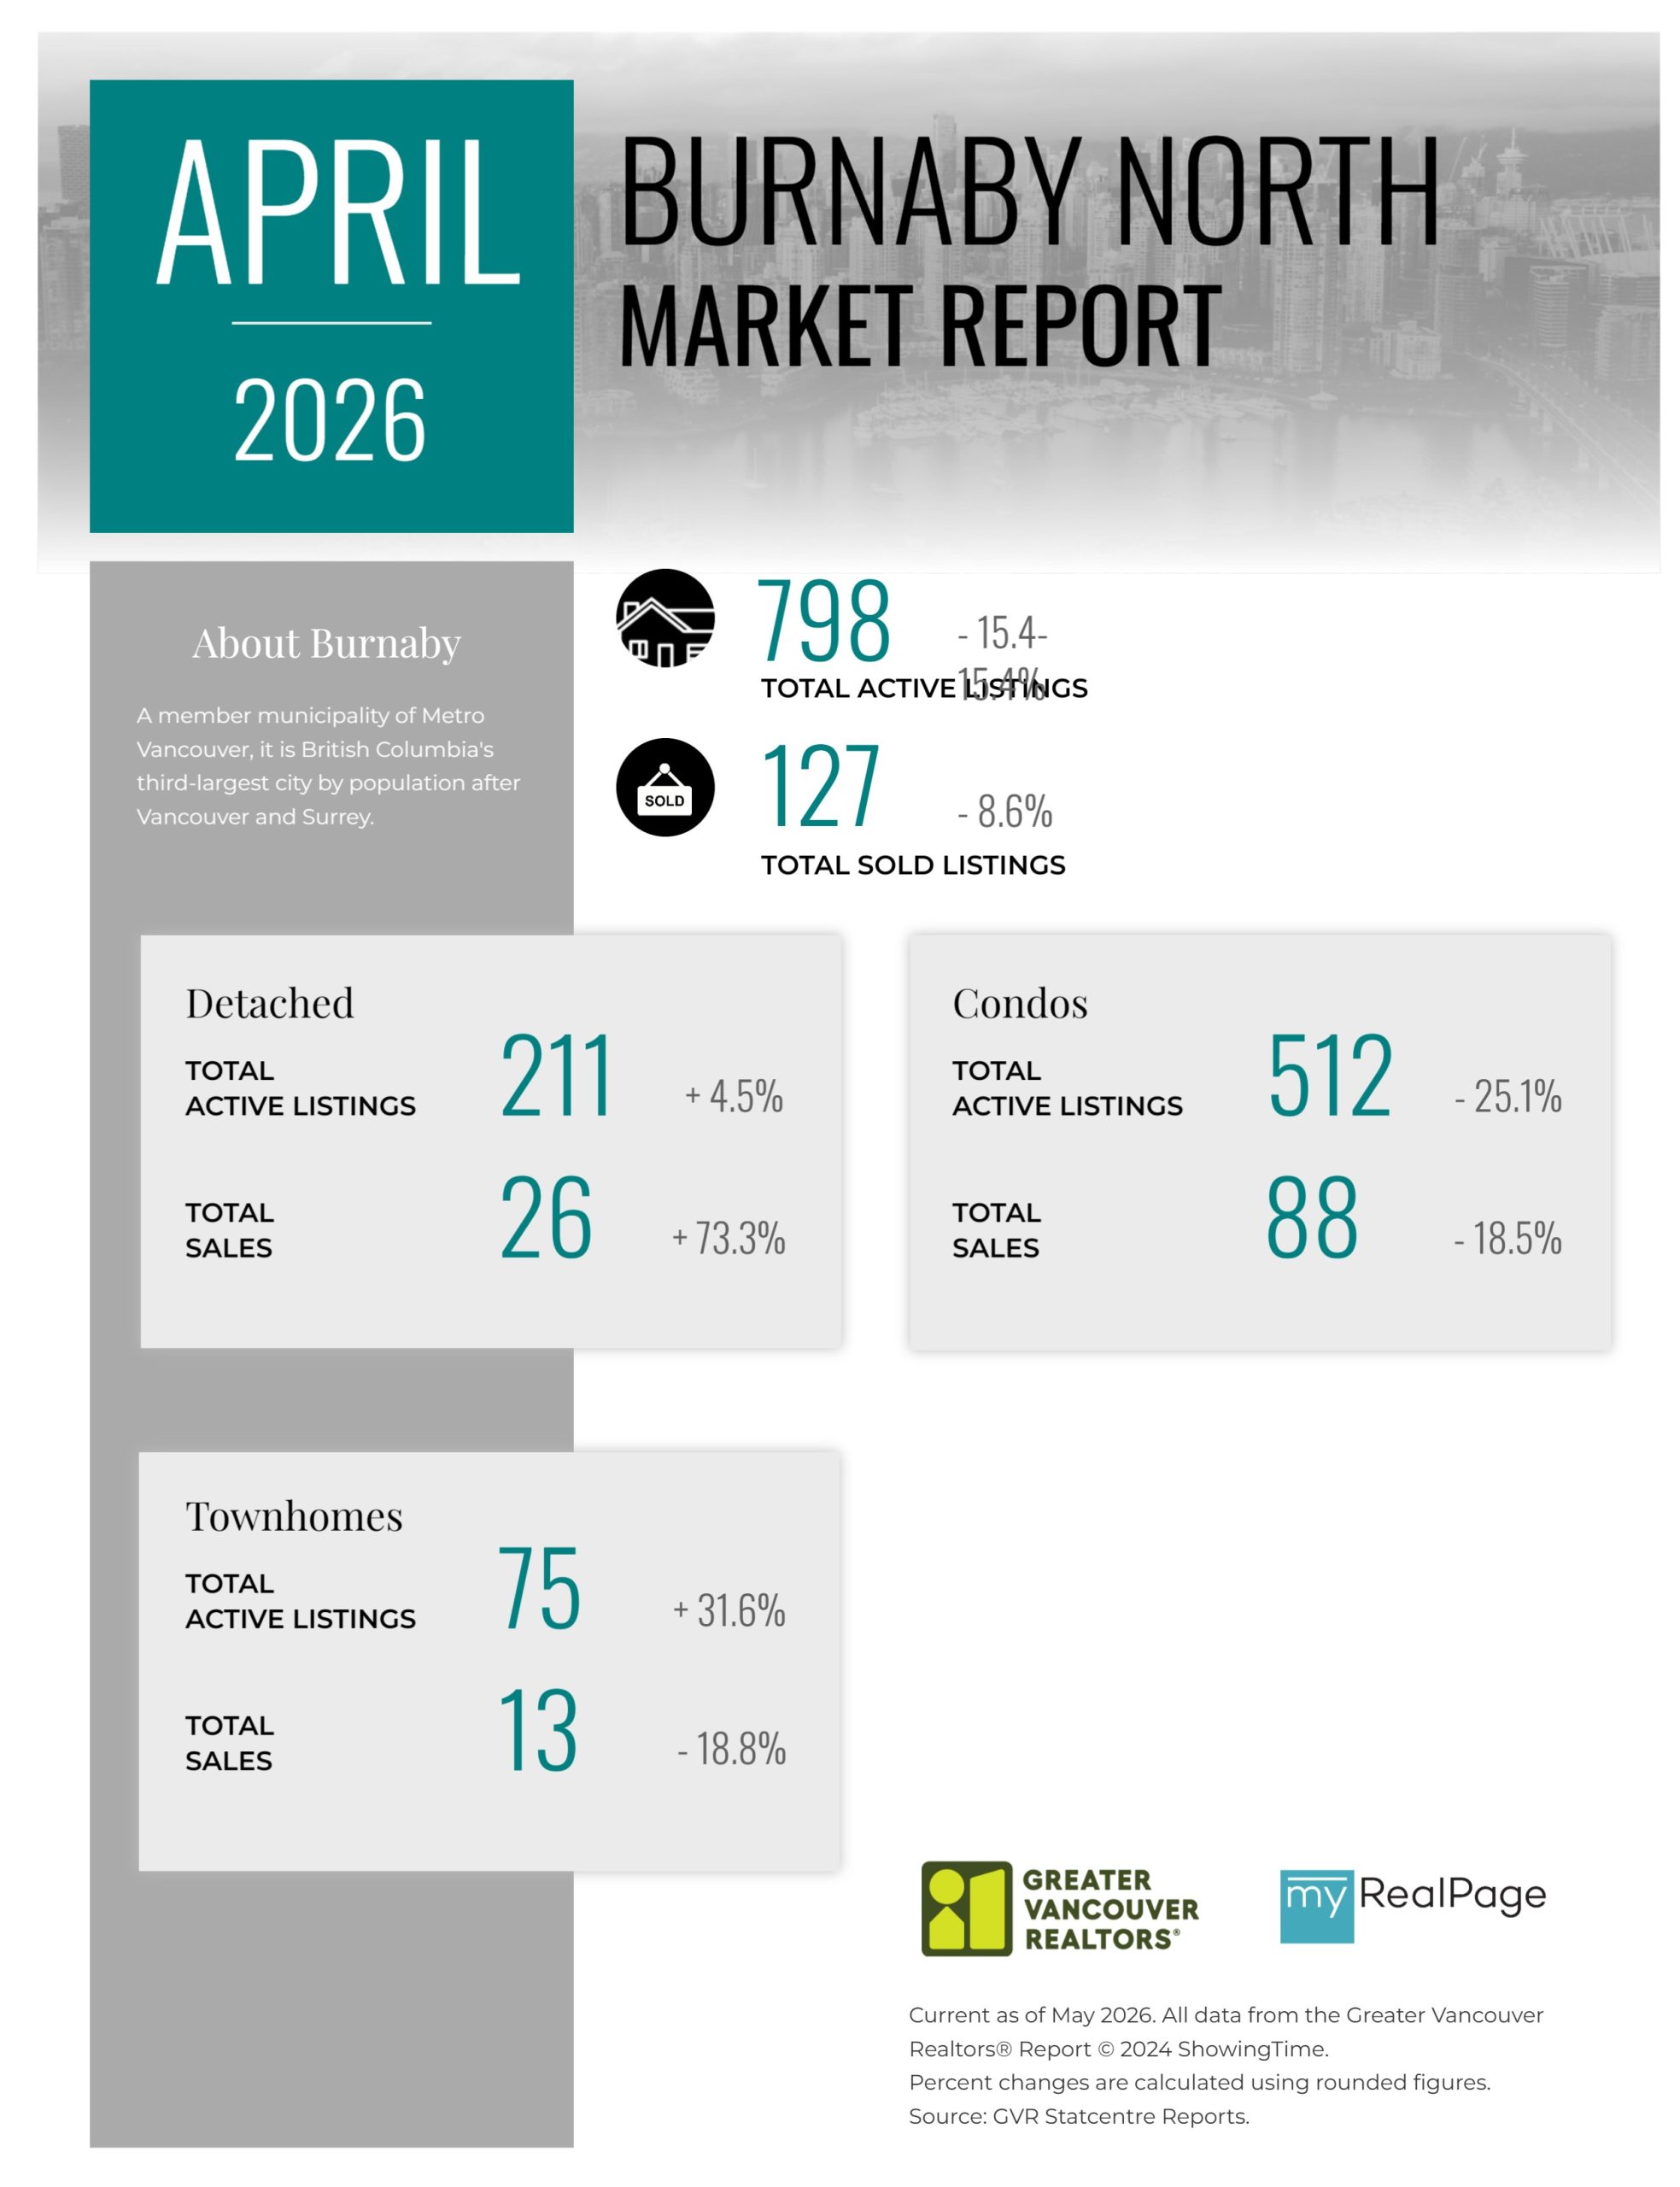
Printable Version – GVR April 2026 Data Infographic Report Burnaby North
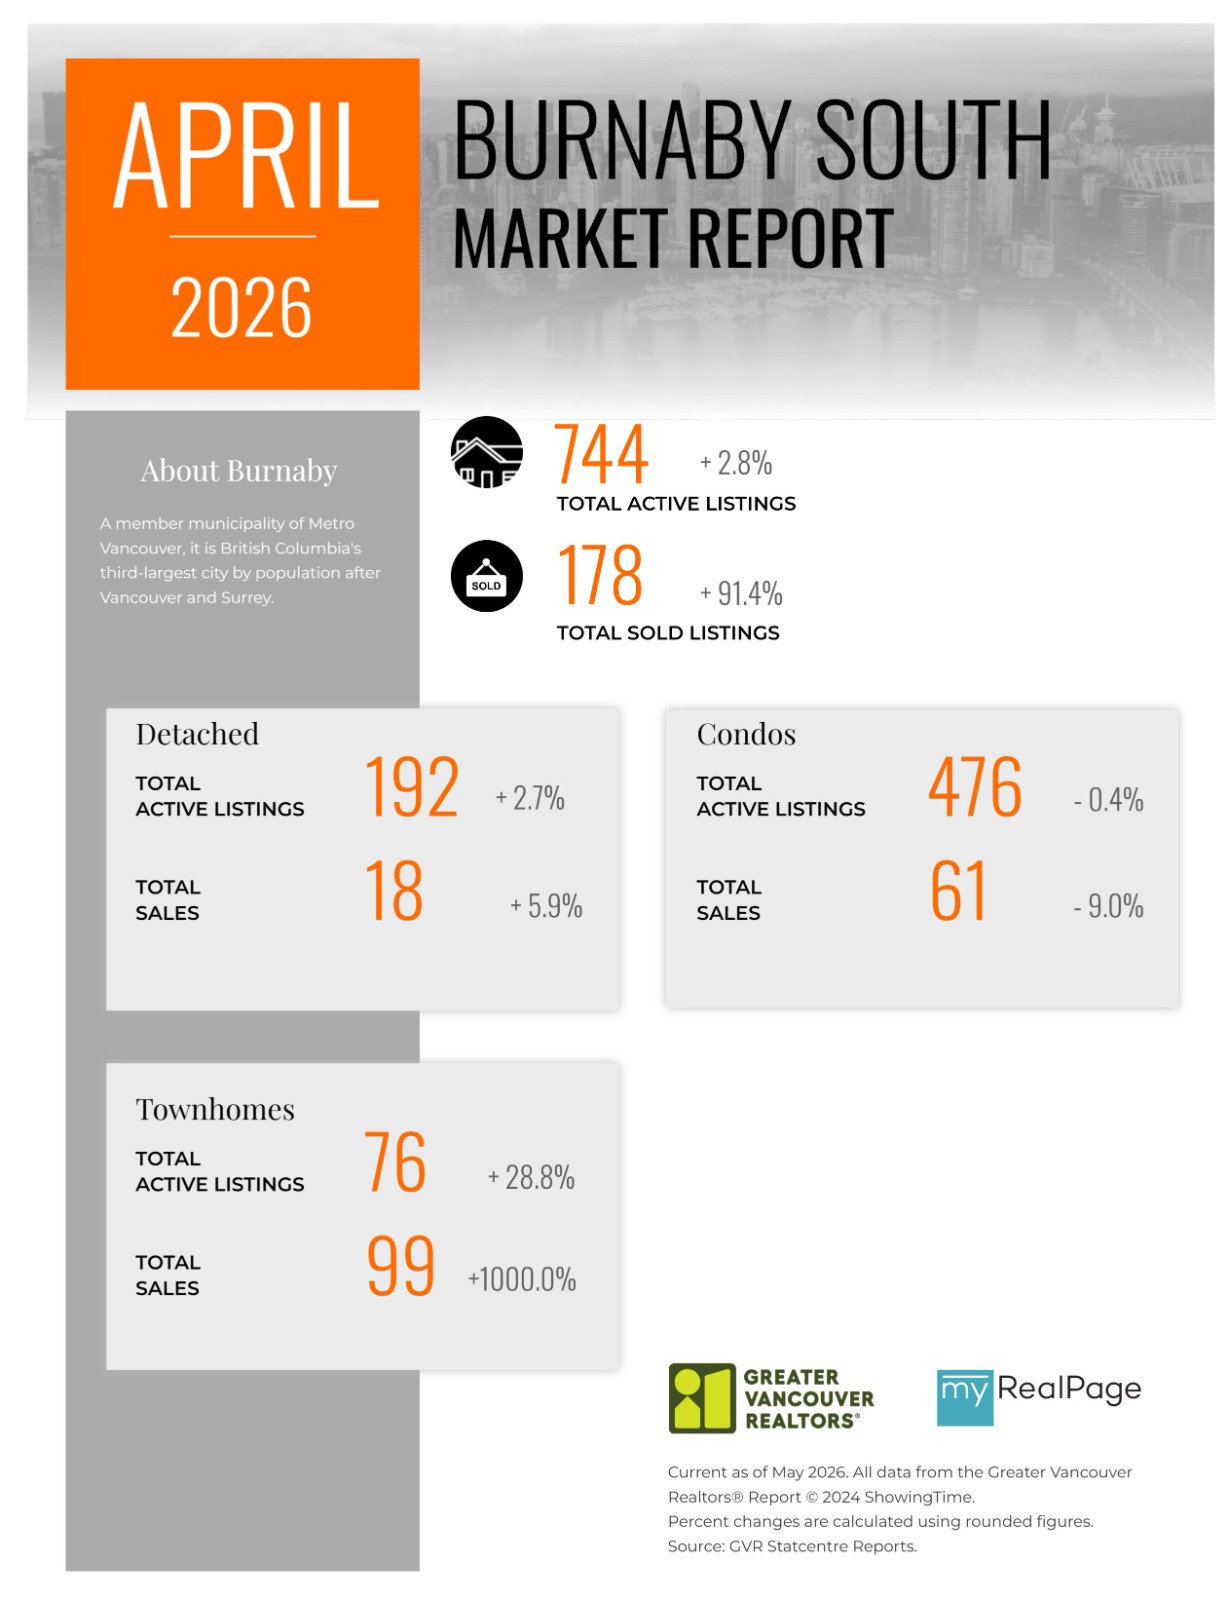
Printable Version – GVR April 2026 Data Infographics Report Burnaby South
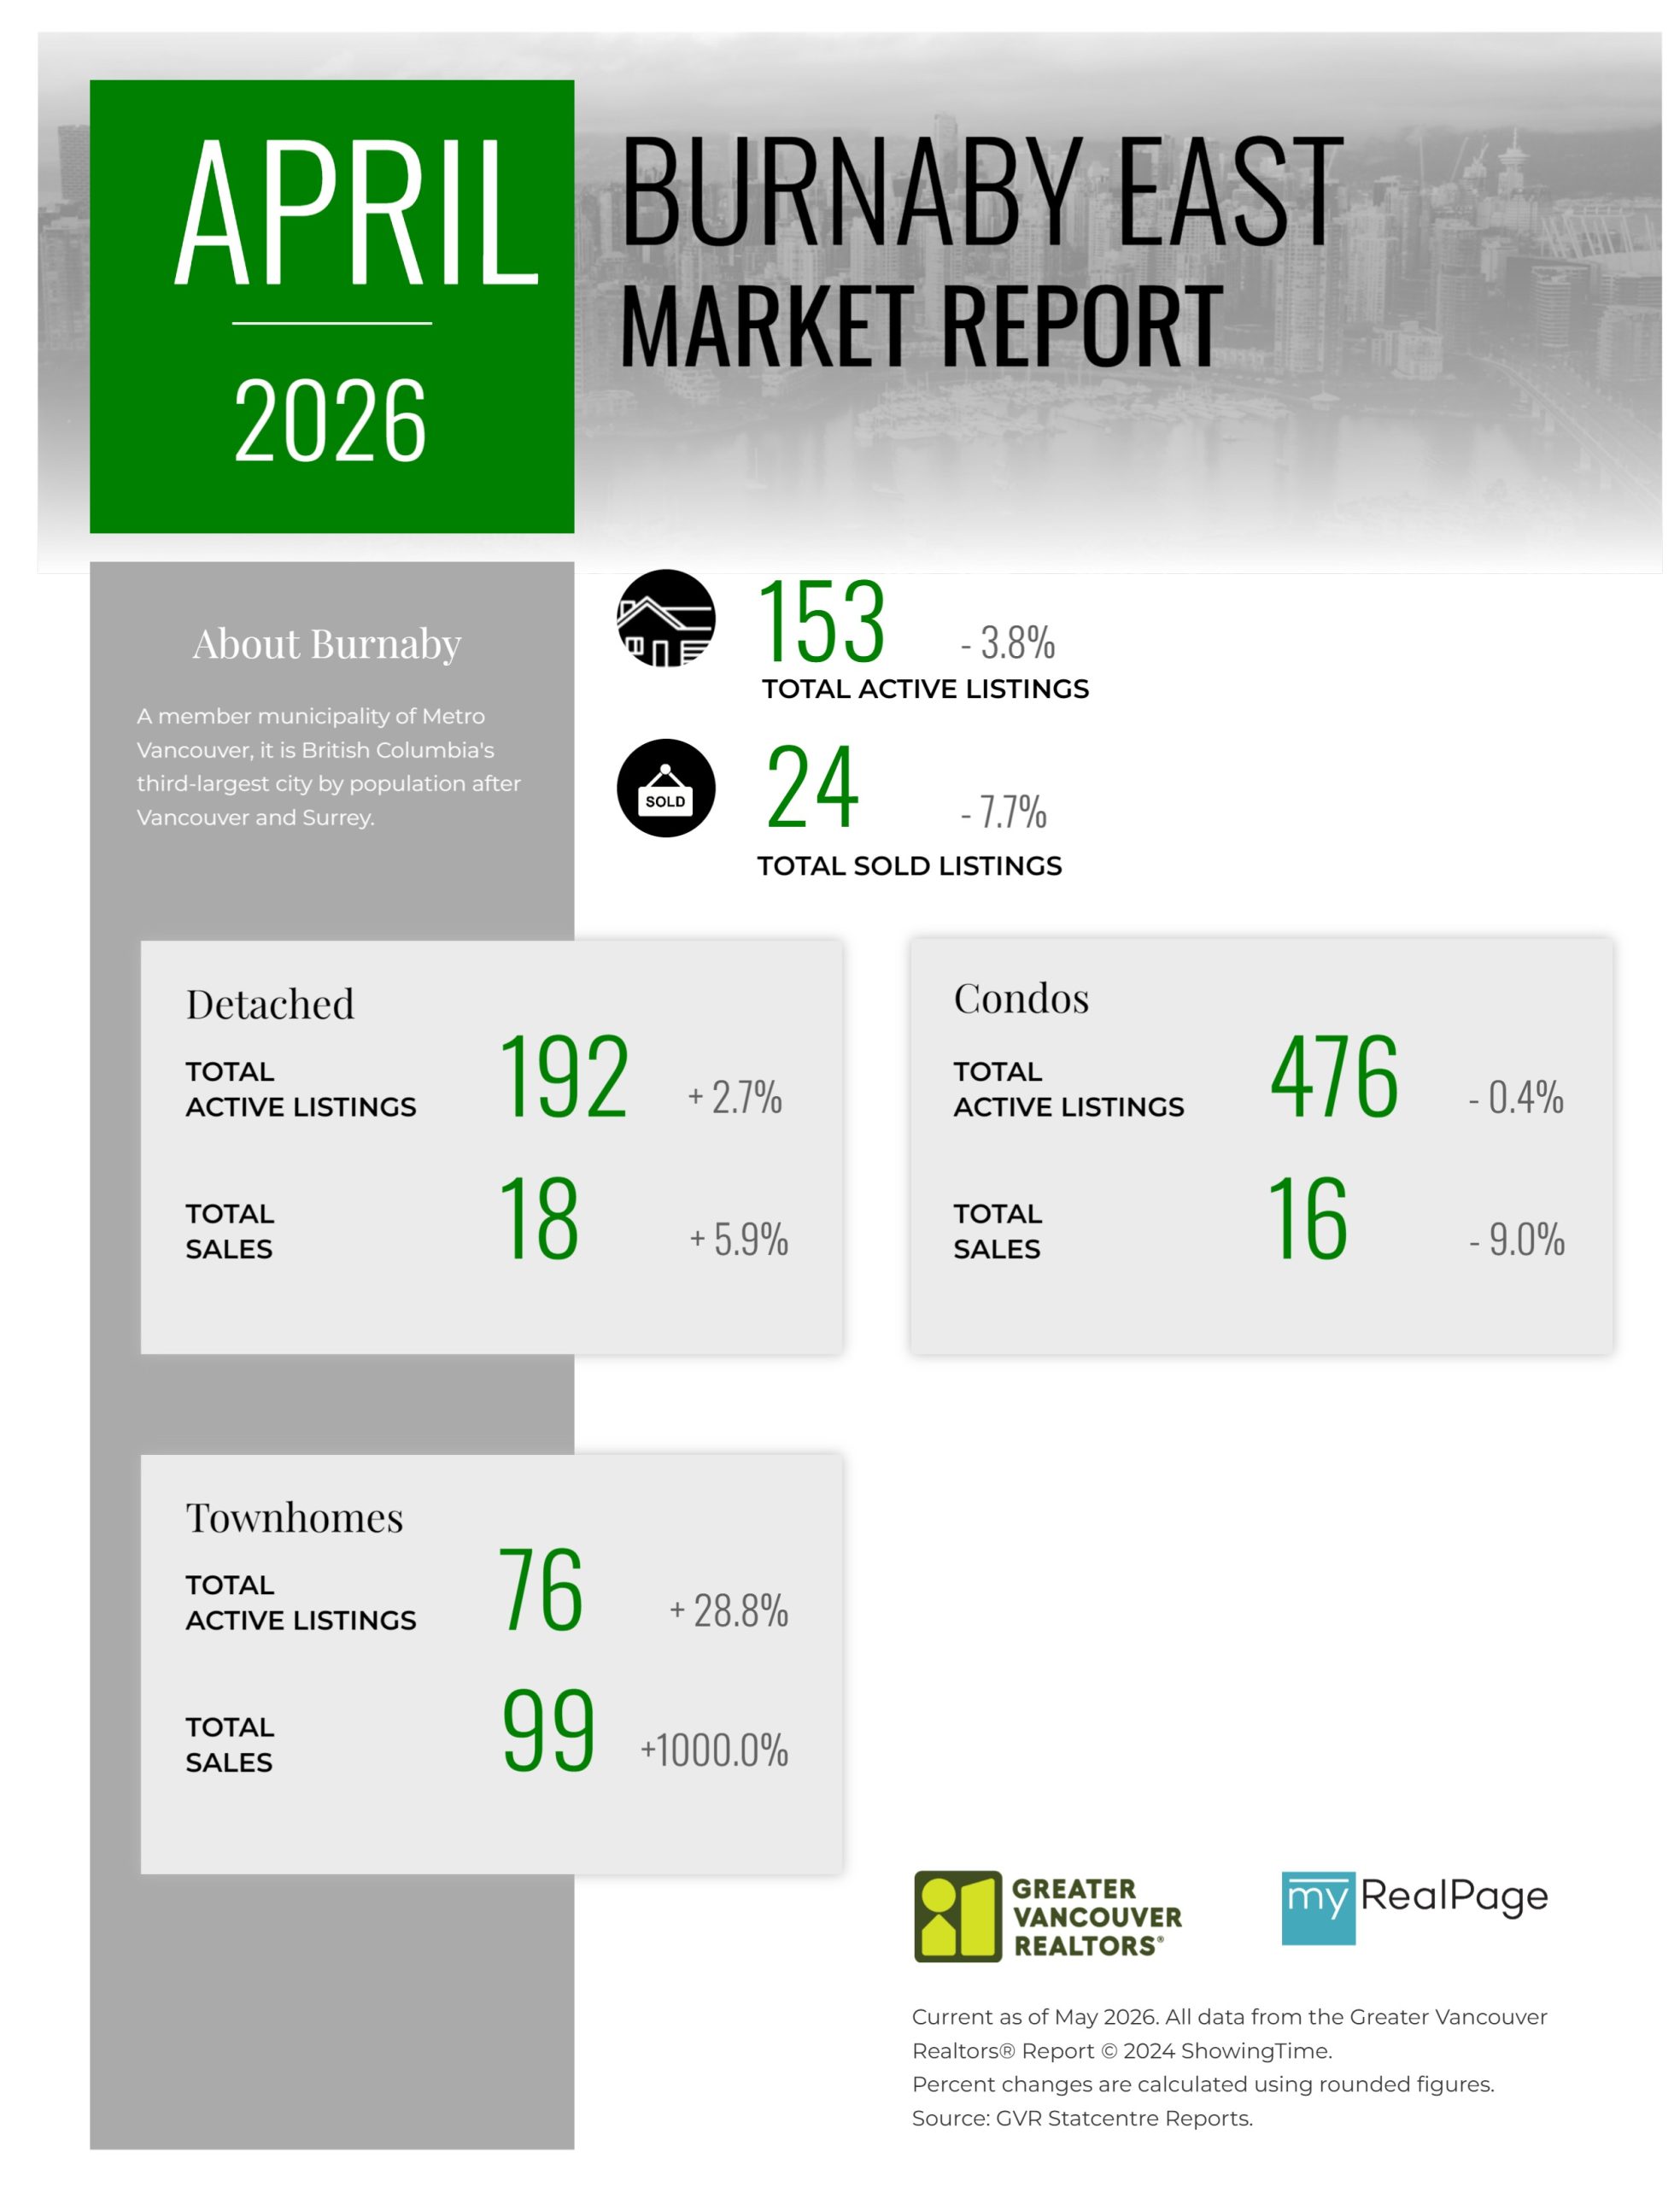
Printable Version – GVR April 2026 Data Infographics Report Burnaby East
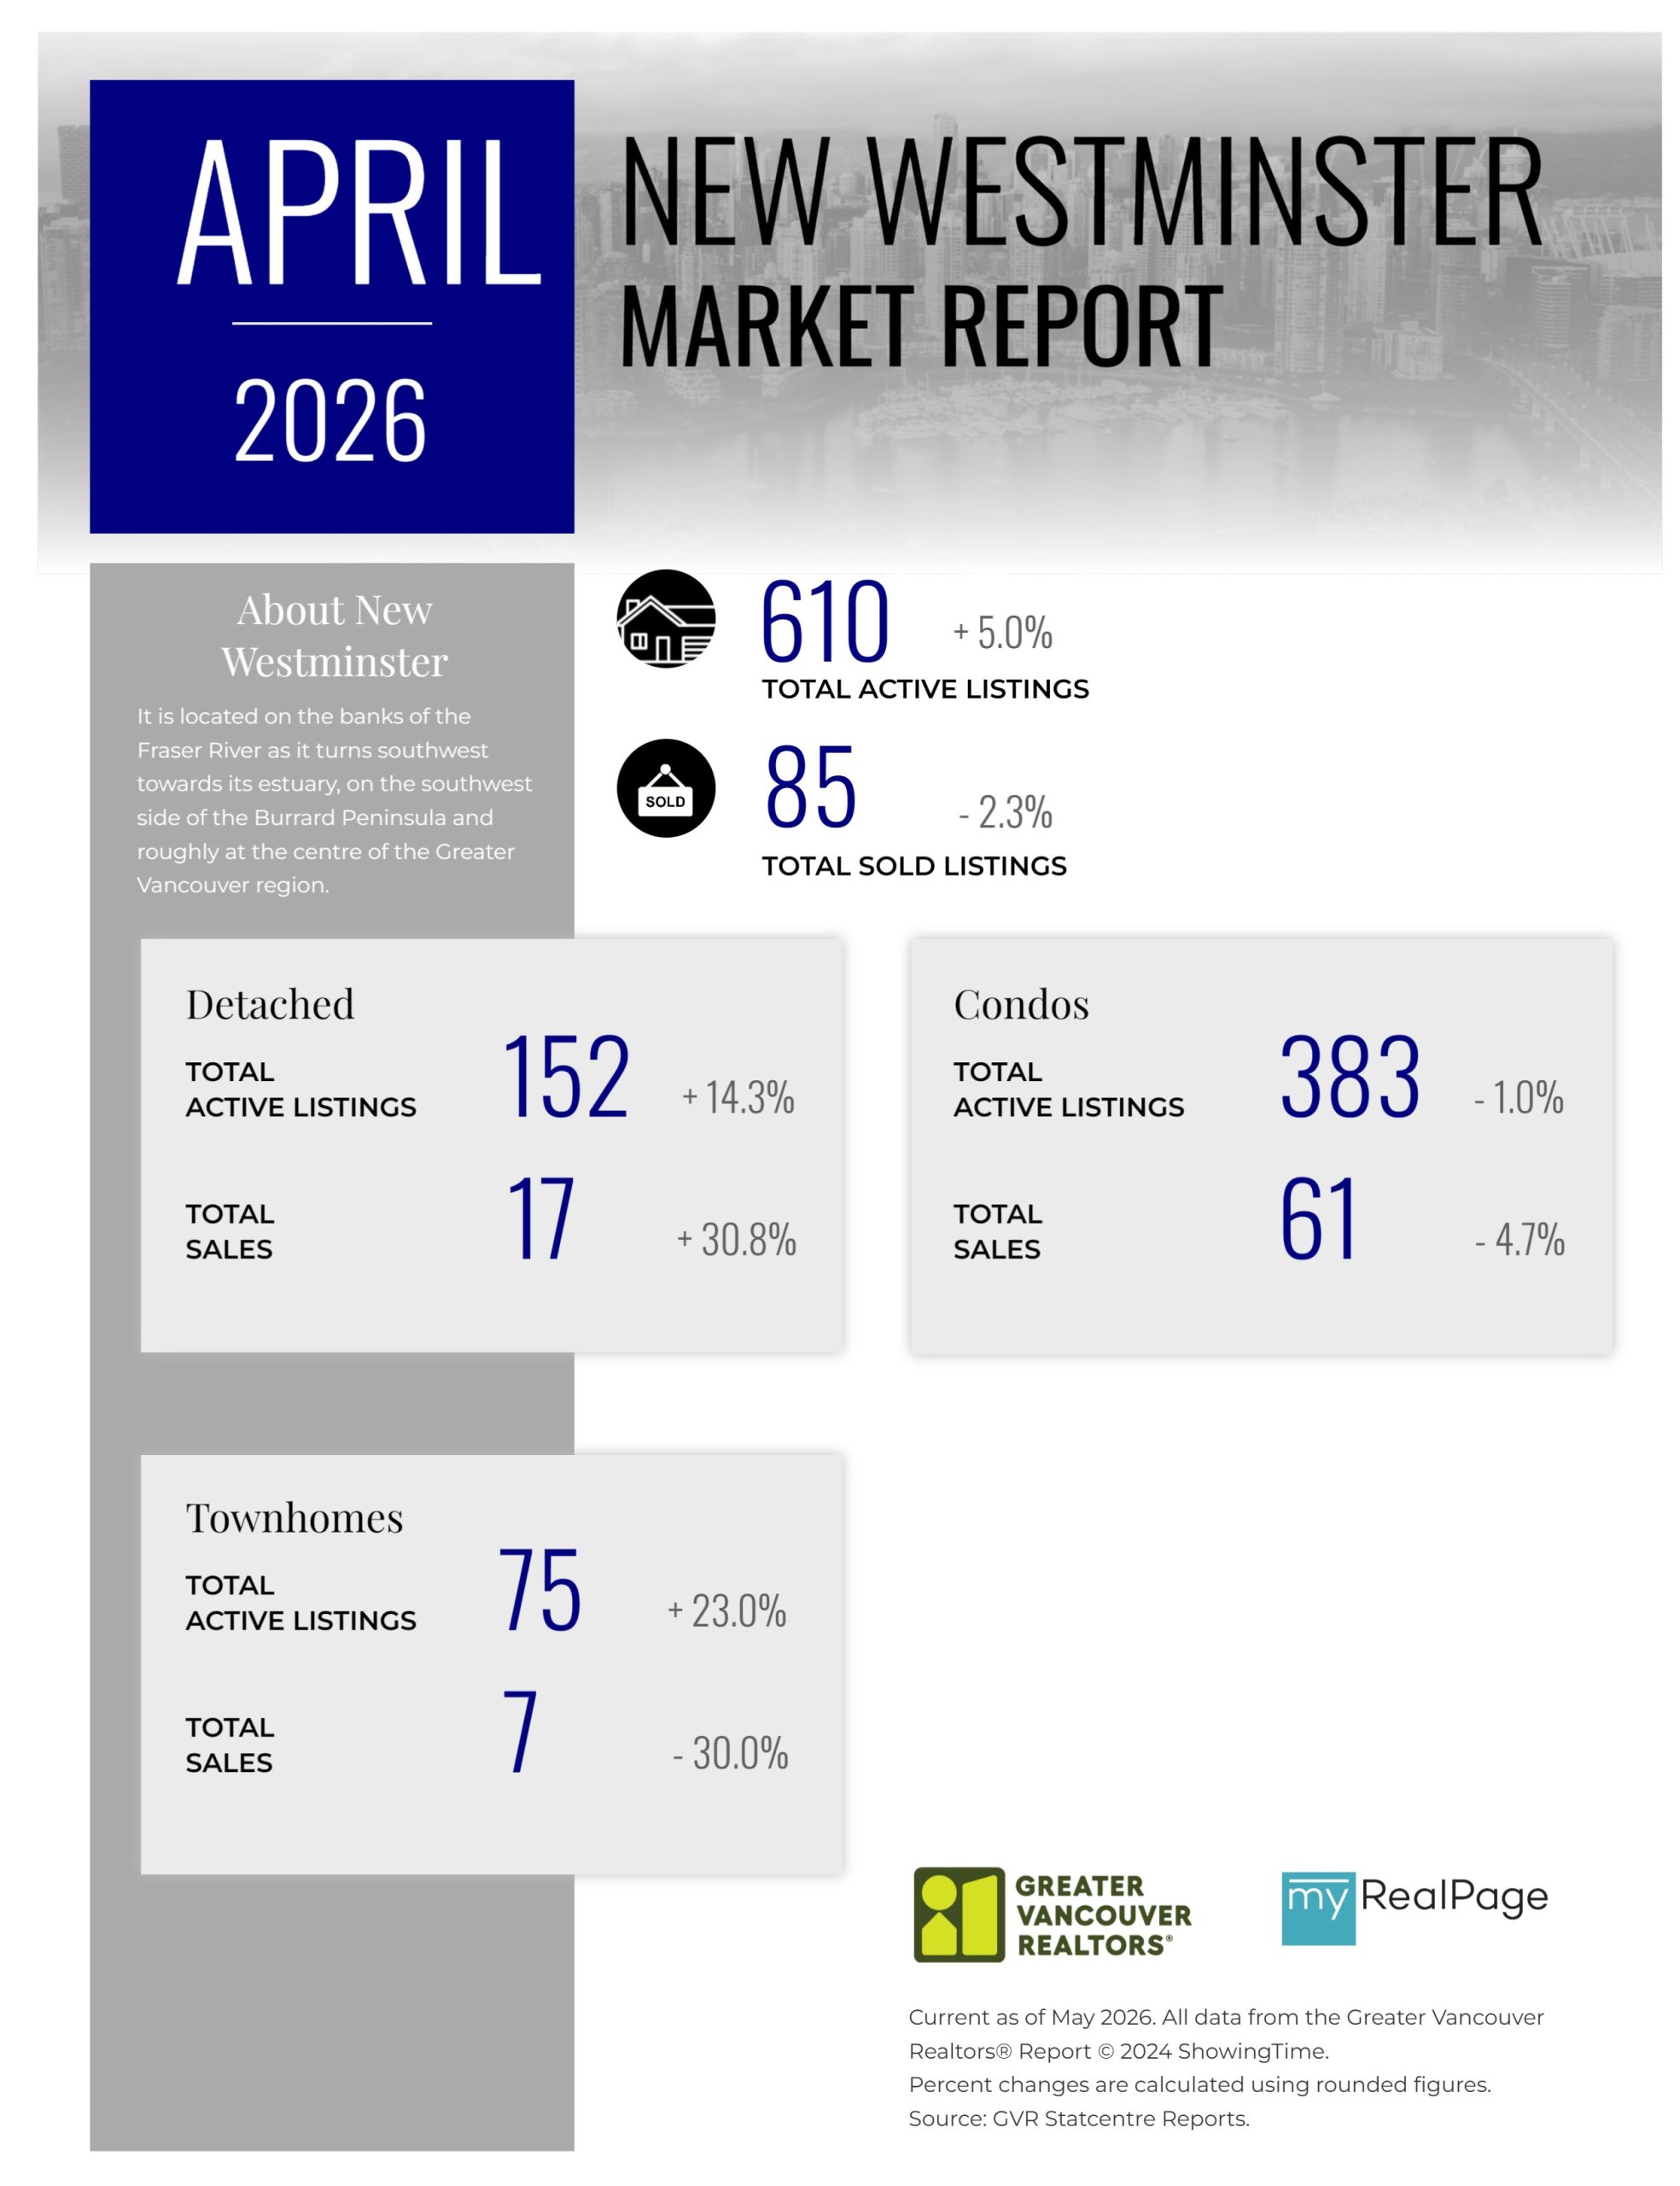
Printable Version – GVR April 2026 Data Infographics Report New Westminster
Printable Version – GVR April 2026 Data Infographics Report Richmond
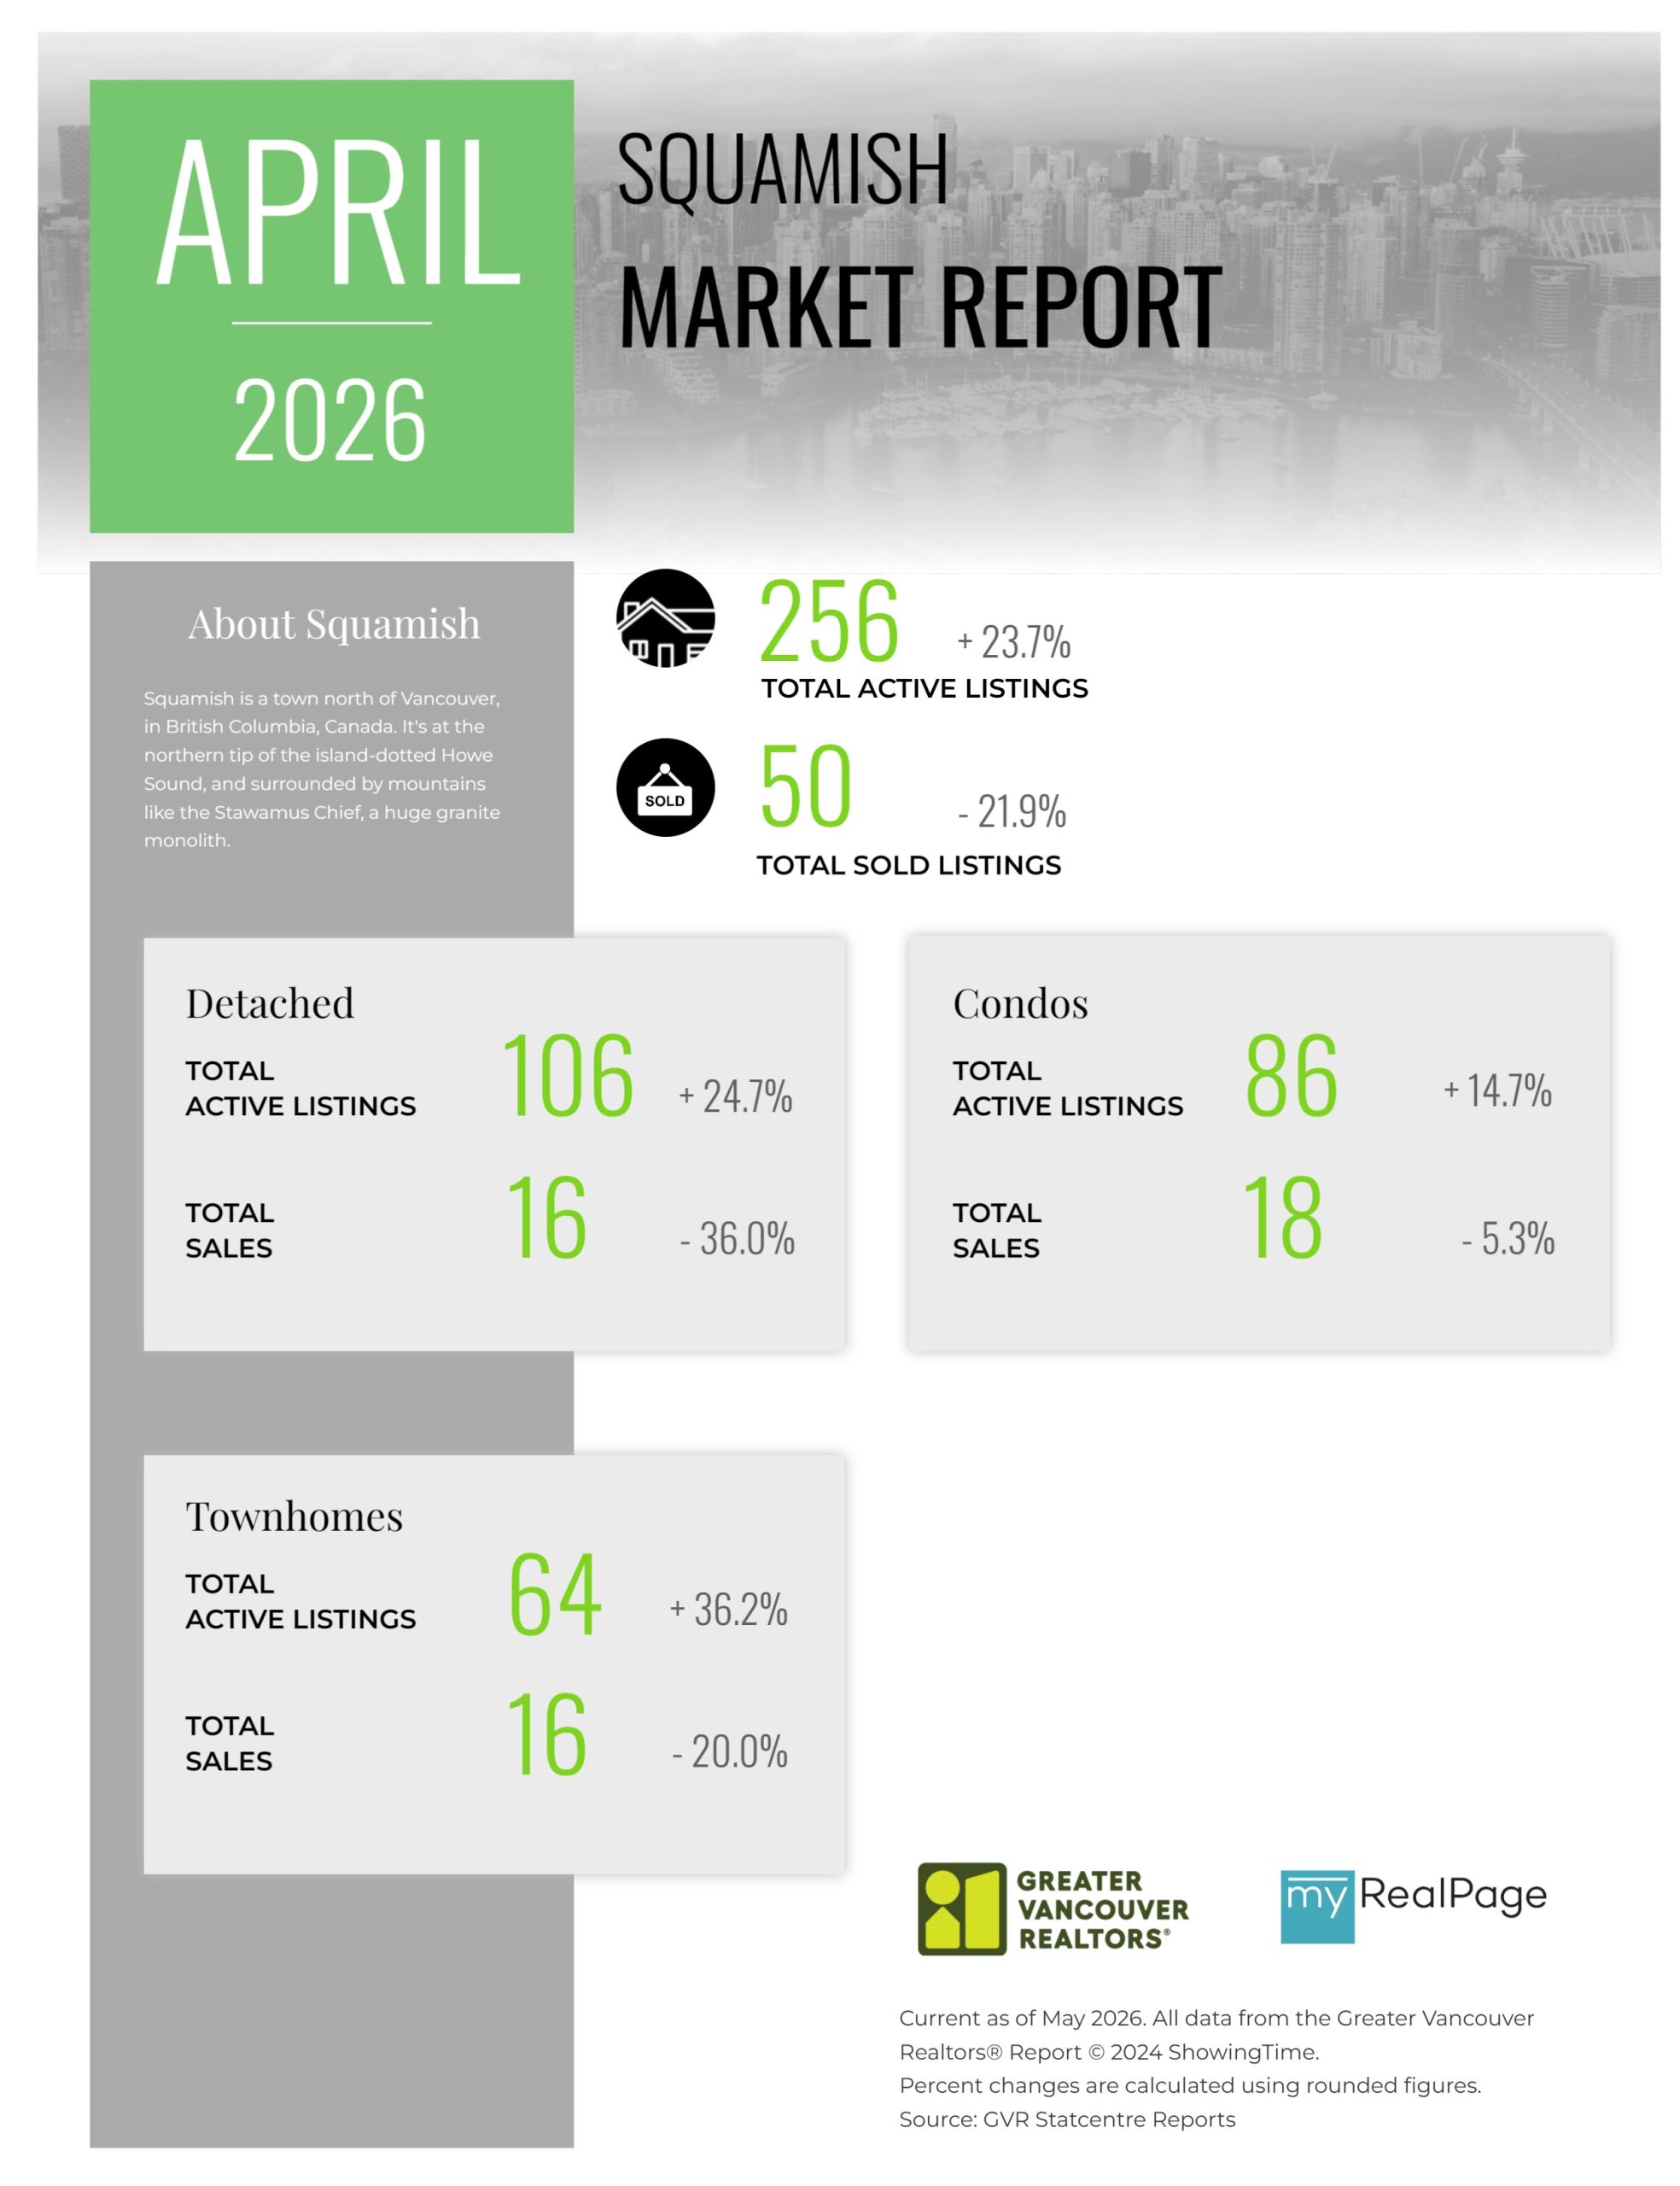
Printable Version – GVR April 2026 Data Infographics Report Squamish
Printable Version – GVR April 2026 Data Infographics Report Ladner
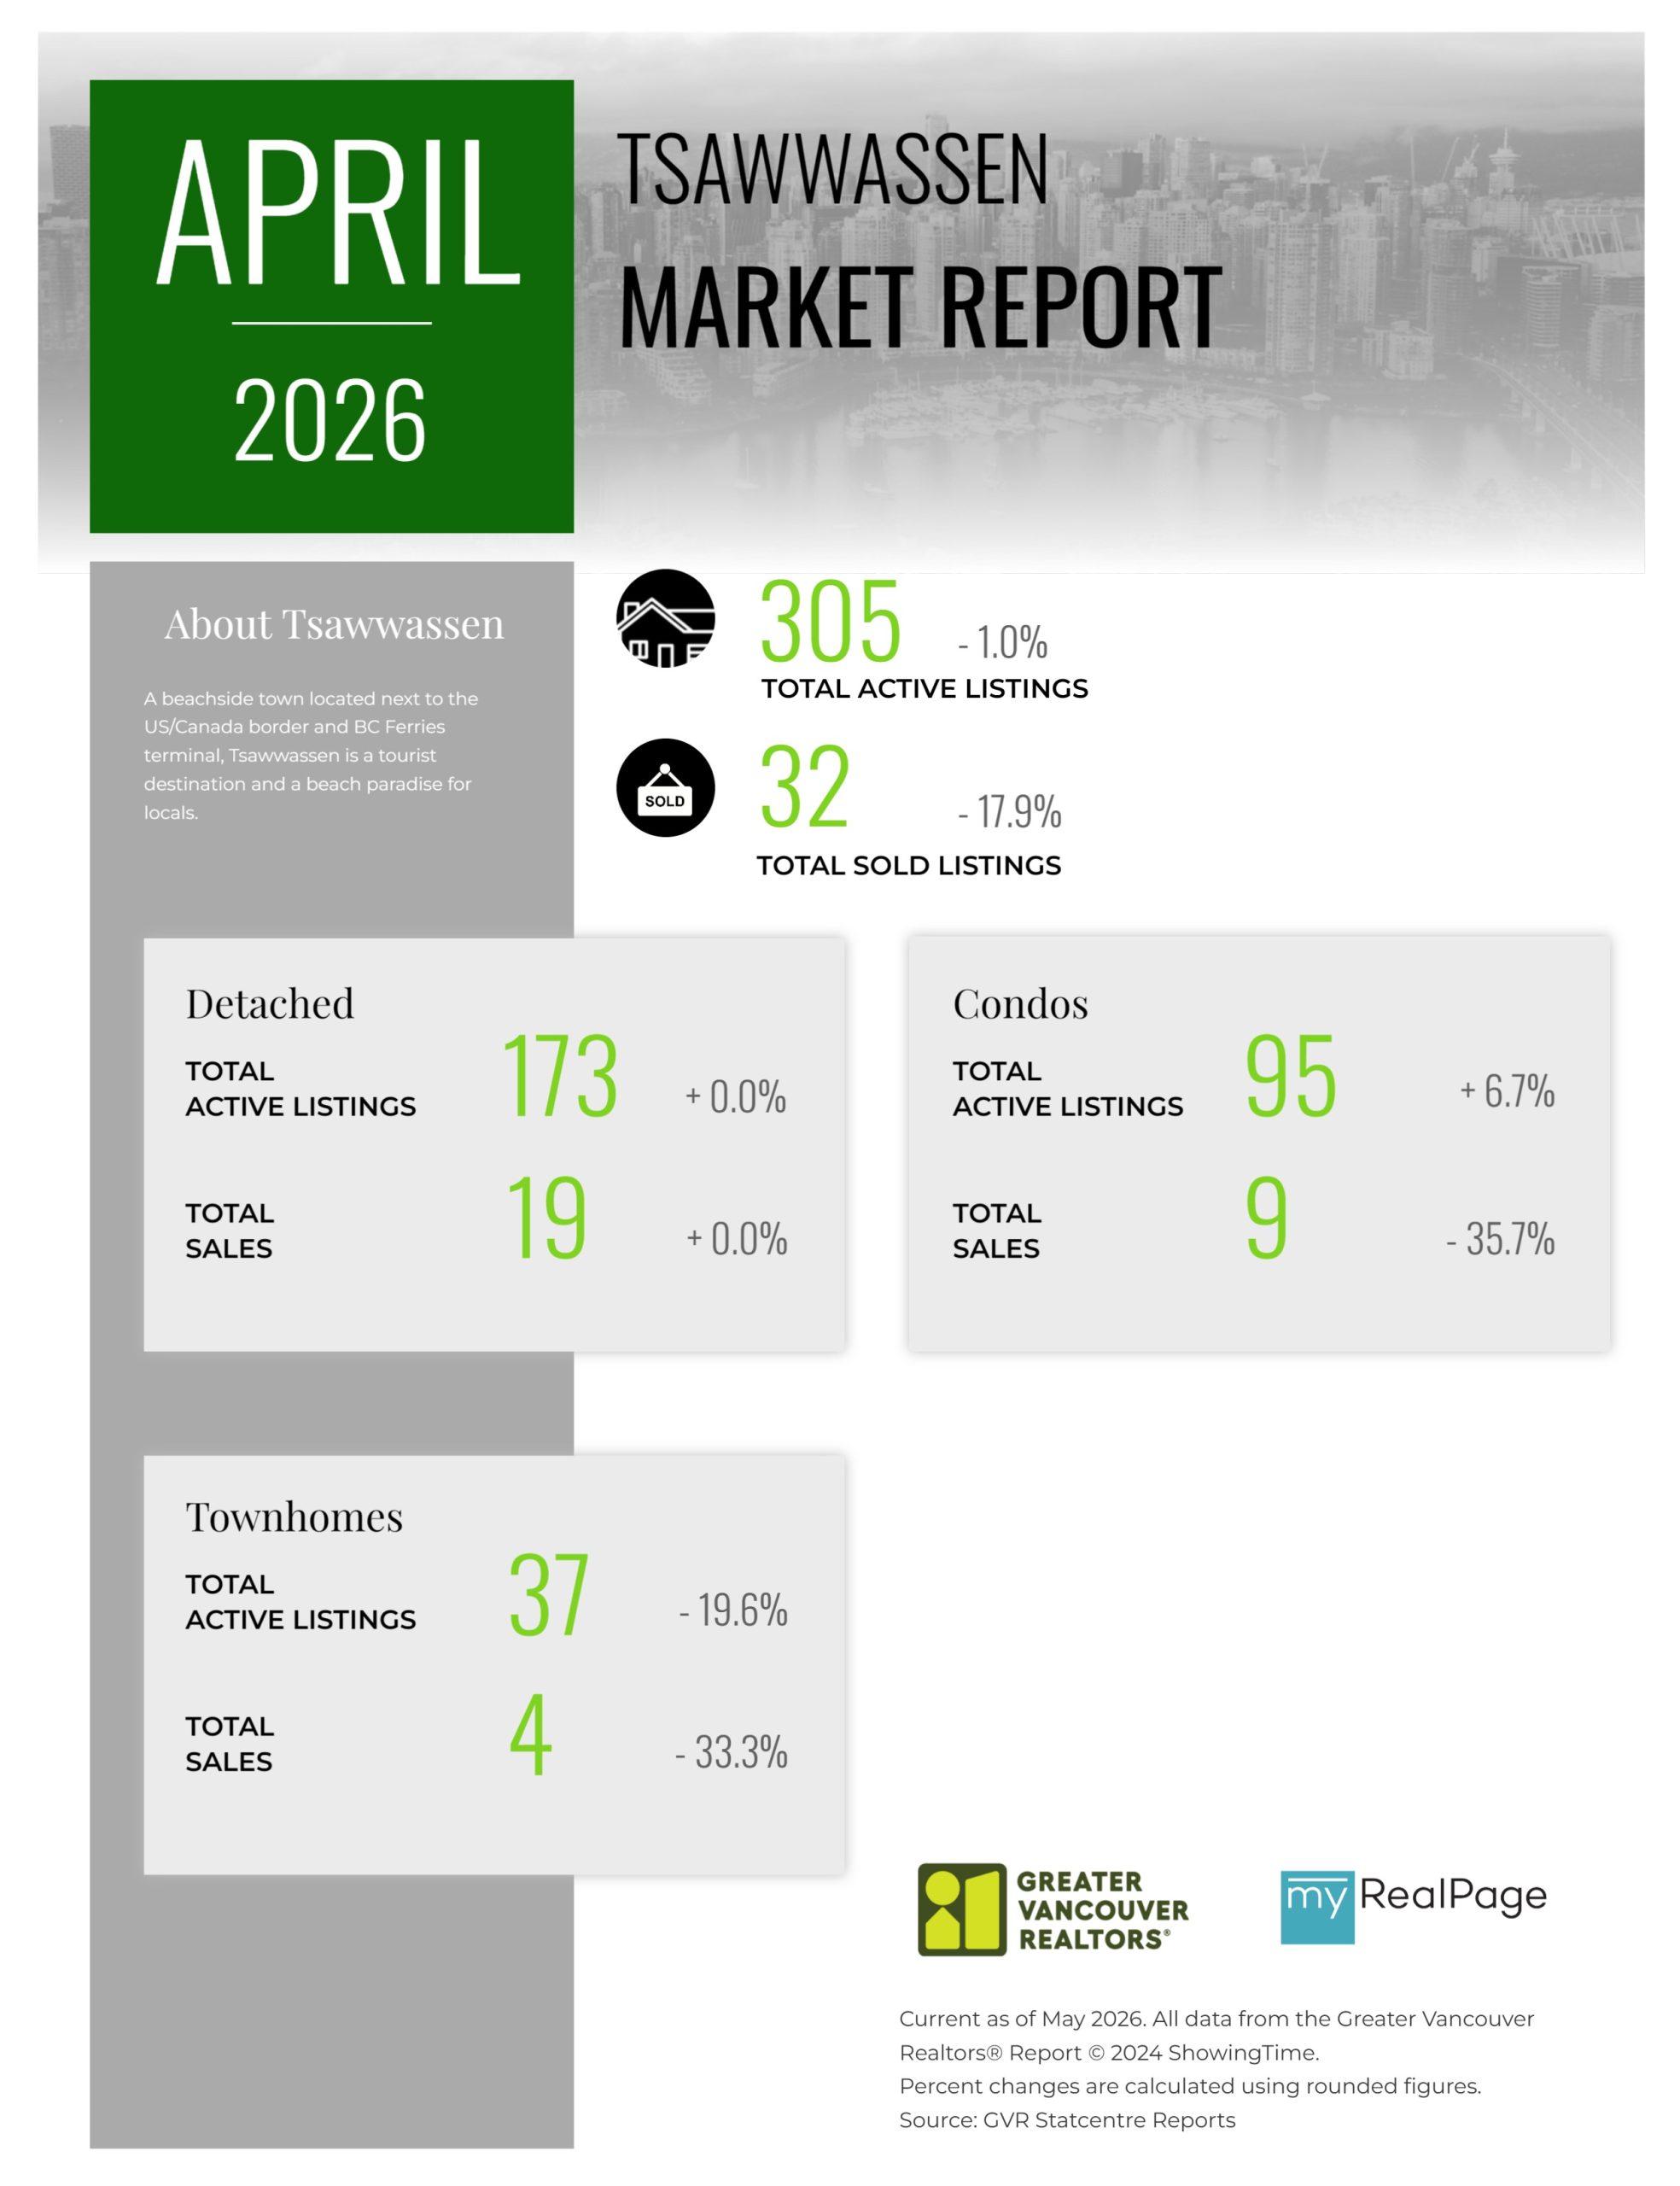
Printable Version – GVR April 2026 Data Infographics Report Tsawwassen


INFOGRAPHICS: March 2026 GVR Greater Vancouver Market Reports
Buyers and sellers adopting a wait-and-see approach to housing market
Home sales registered on the MLS® in Metro Vancouver continue evolving at a pace similar to last year, with the sales down roughly three per cent from last March.
The Greater Vancouver REALTORS® (GVR) reports that residential sales in the region totalled 2,032 in March 2026, a 2.8 per cent decrease from the 2,091 sales recorded in March 2025. This was 31.8 per cent below the 10-year seasonal average (2,981).
“Year-to-date, sales are tracking our forecast for the year closely, and the weakness in demand we continue to observe at the aggregate level is unsurprising. What’s interesting is that the aggregate total masks an emerging divergence among market segments. While the multifamily segment continues to see slower sales, the detached segment may be awakening with sales up, and new listings down from last year.” said Andrew Lis, GVR chief economist and vice-president data analytics
Read the full report on the REBGV website!
The following data is a comparison between March 2026 and March 2025 numbers, and is current as of April of 2026. For last month’s update, you can check out our previous post!
Or follow this link for all our GVR Infographics!
These infographics cover current trends in several areas within the Greater Vancouver region. Click on the images for a larger view!
Printable Version – GVR March 2026 Data Infographic Report North Vancouver
Printable Version – GVR March 2026 Data Infographics Report West Vancouver
Printable Version – GVR March 2026 Data Infographics Report Vancouver West
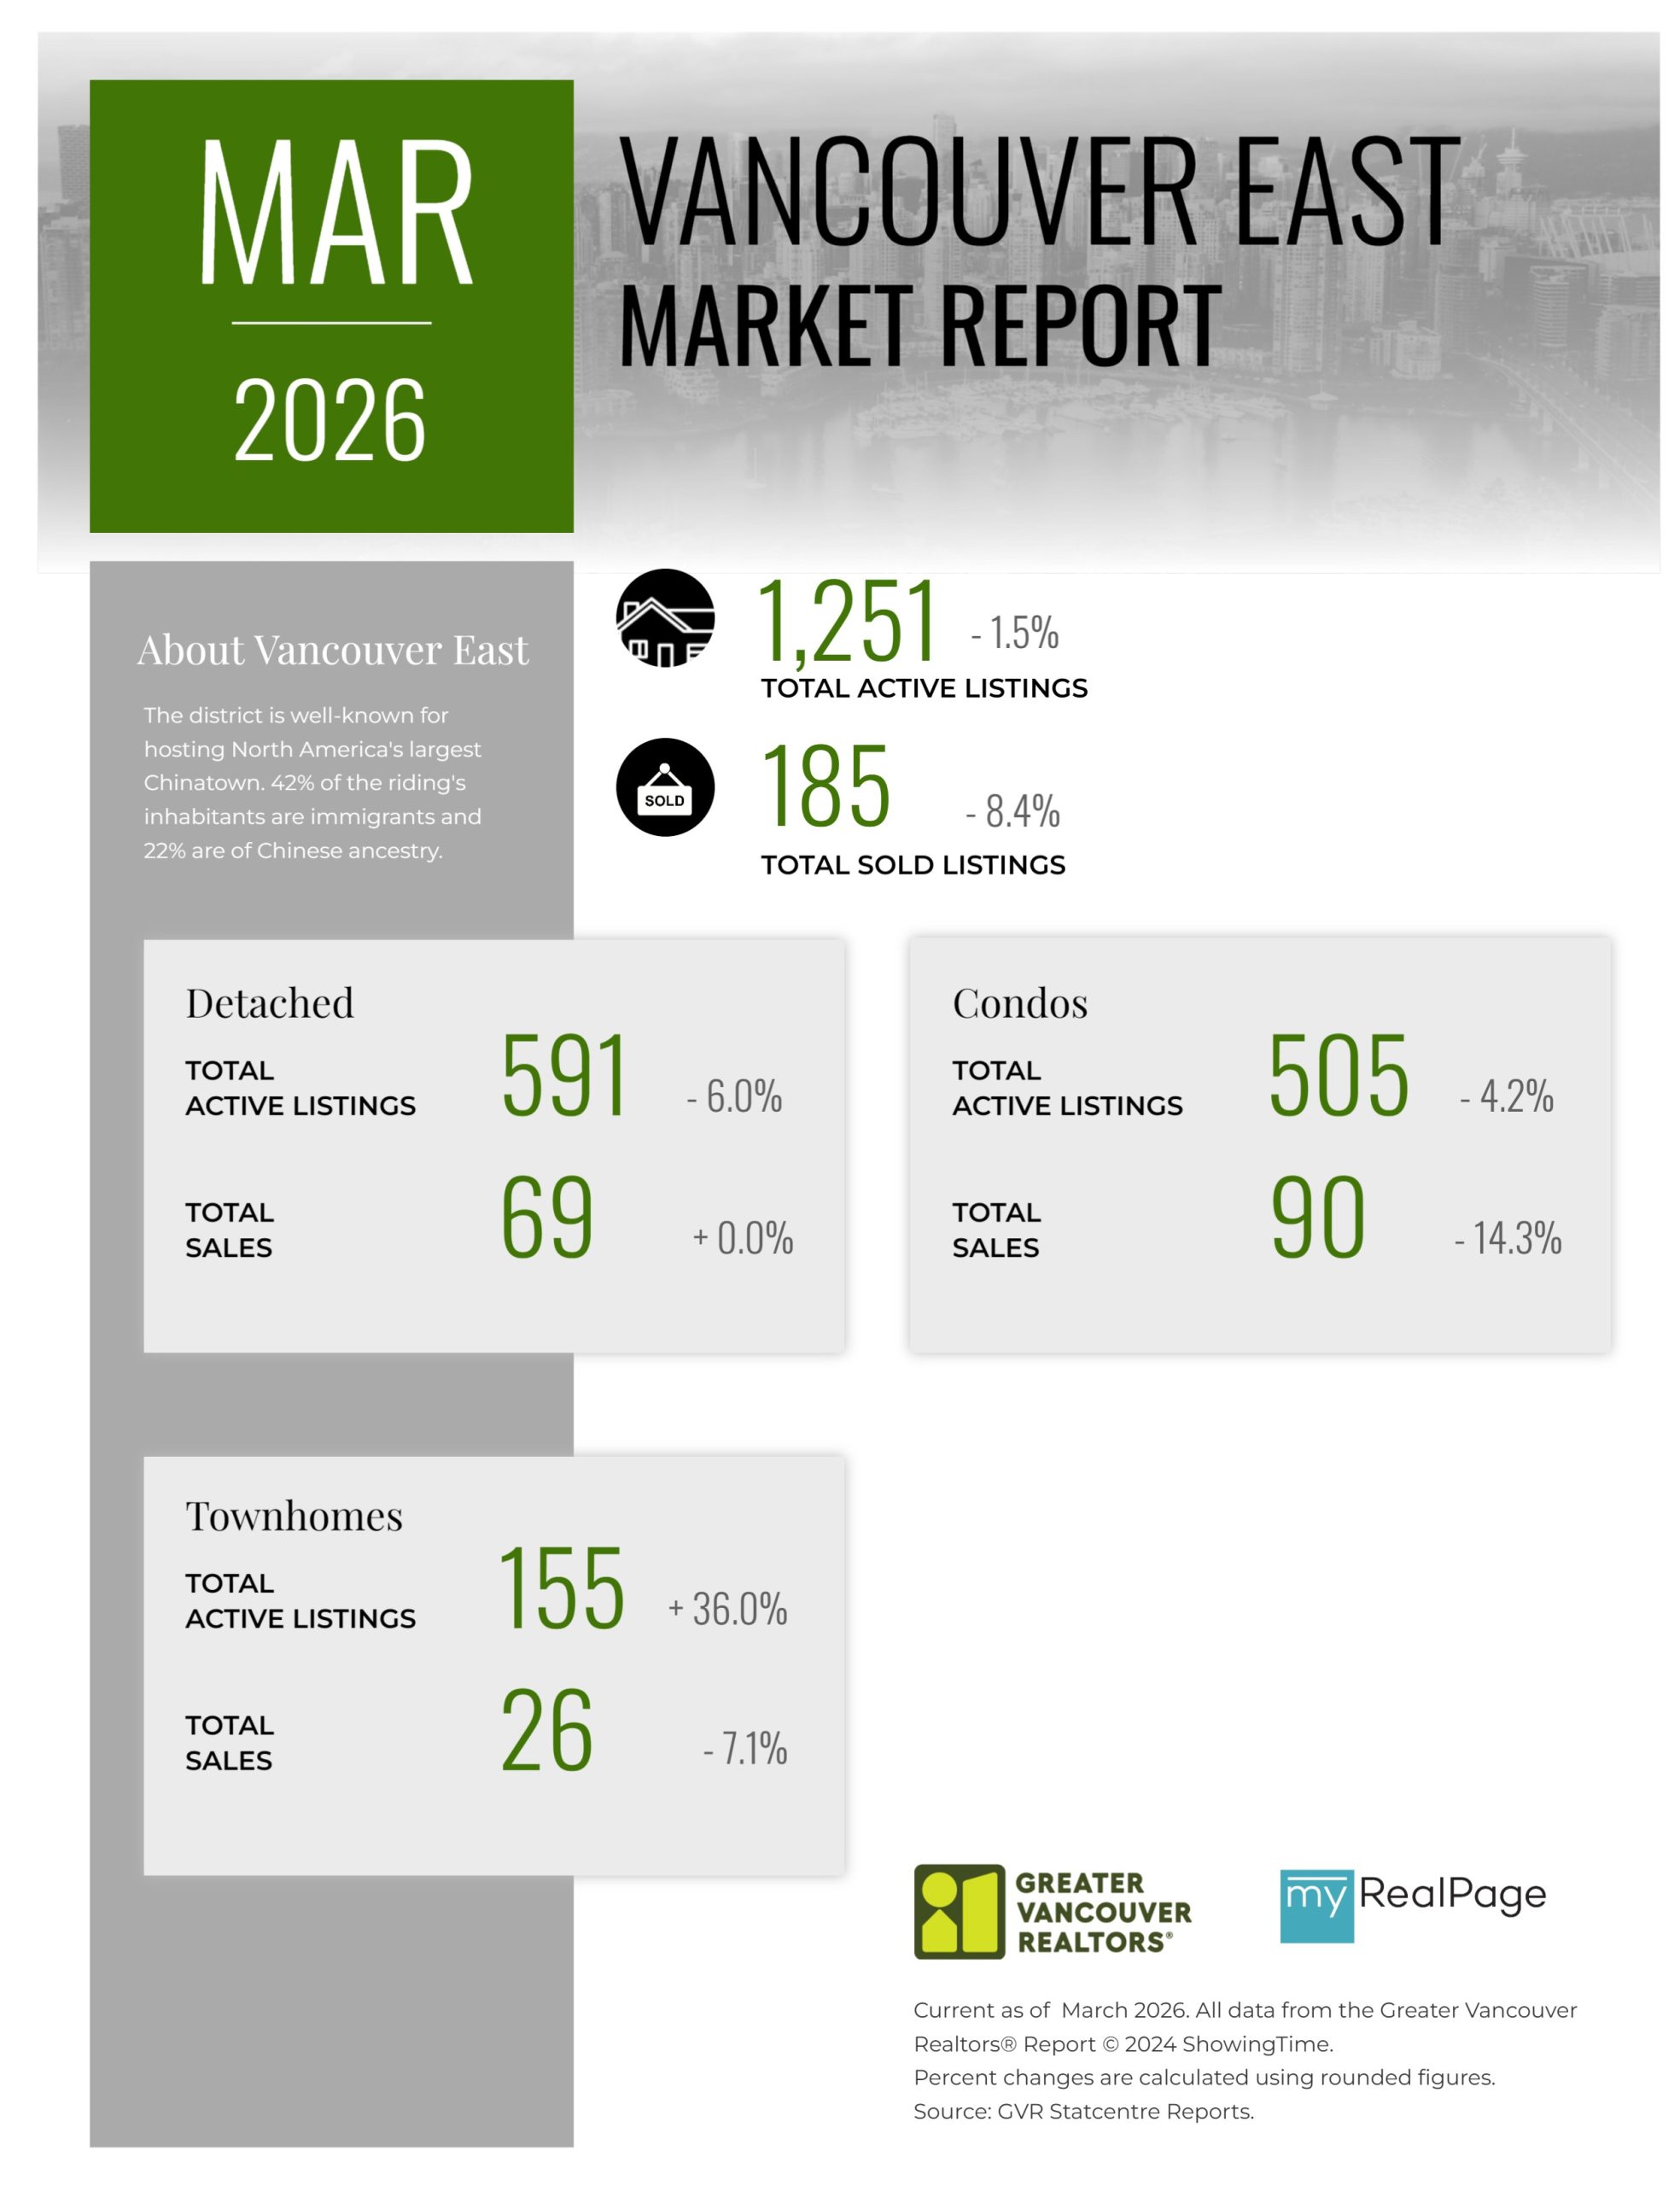
Printable Version – GVR March 2026 Data Infographics Report Vancouver East
Printable Version – GVR March 2026 Data Infographic Report Maple Ridge
Printable Version – GVR March 2026 Data Infographics Report Pitt Meadows
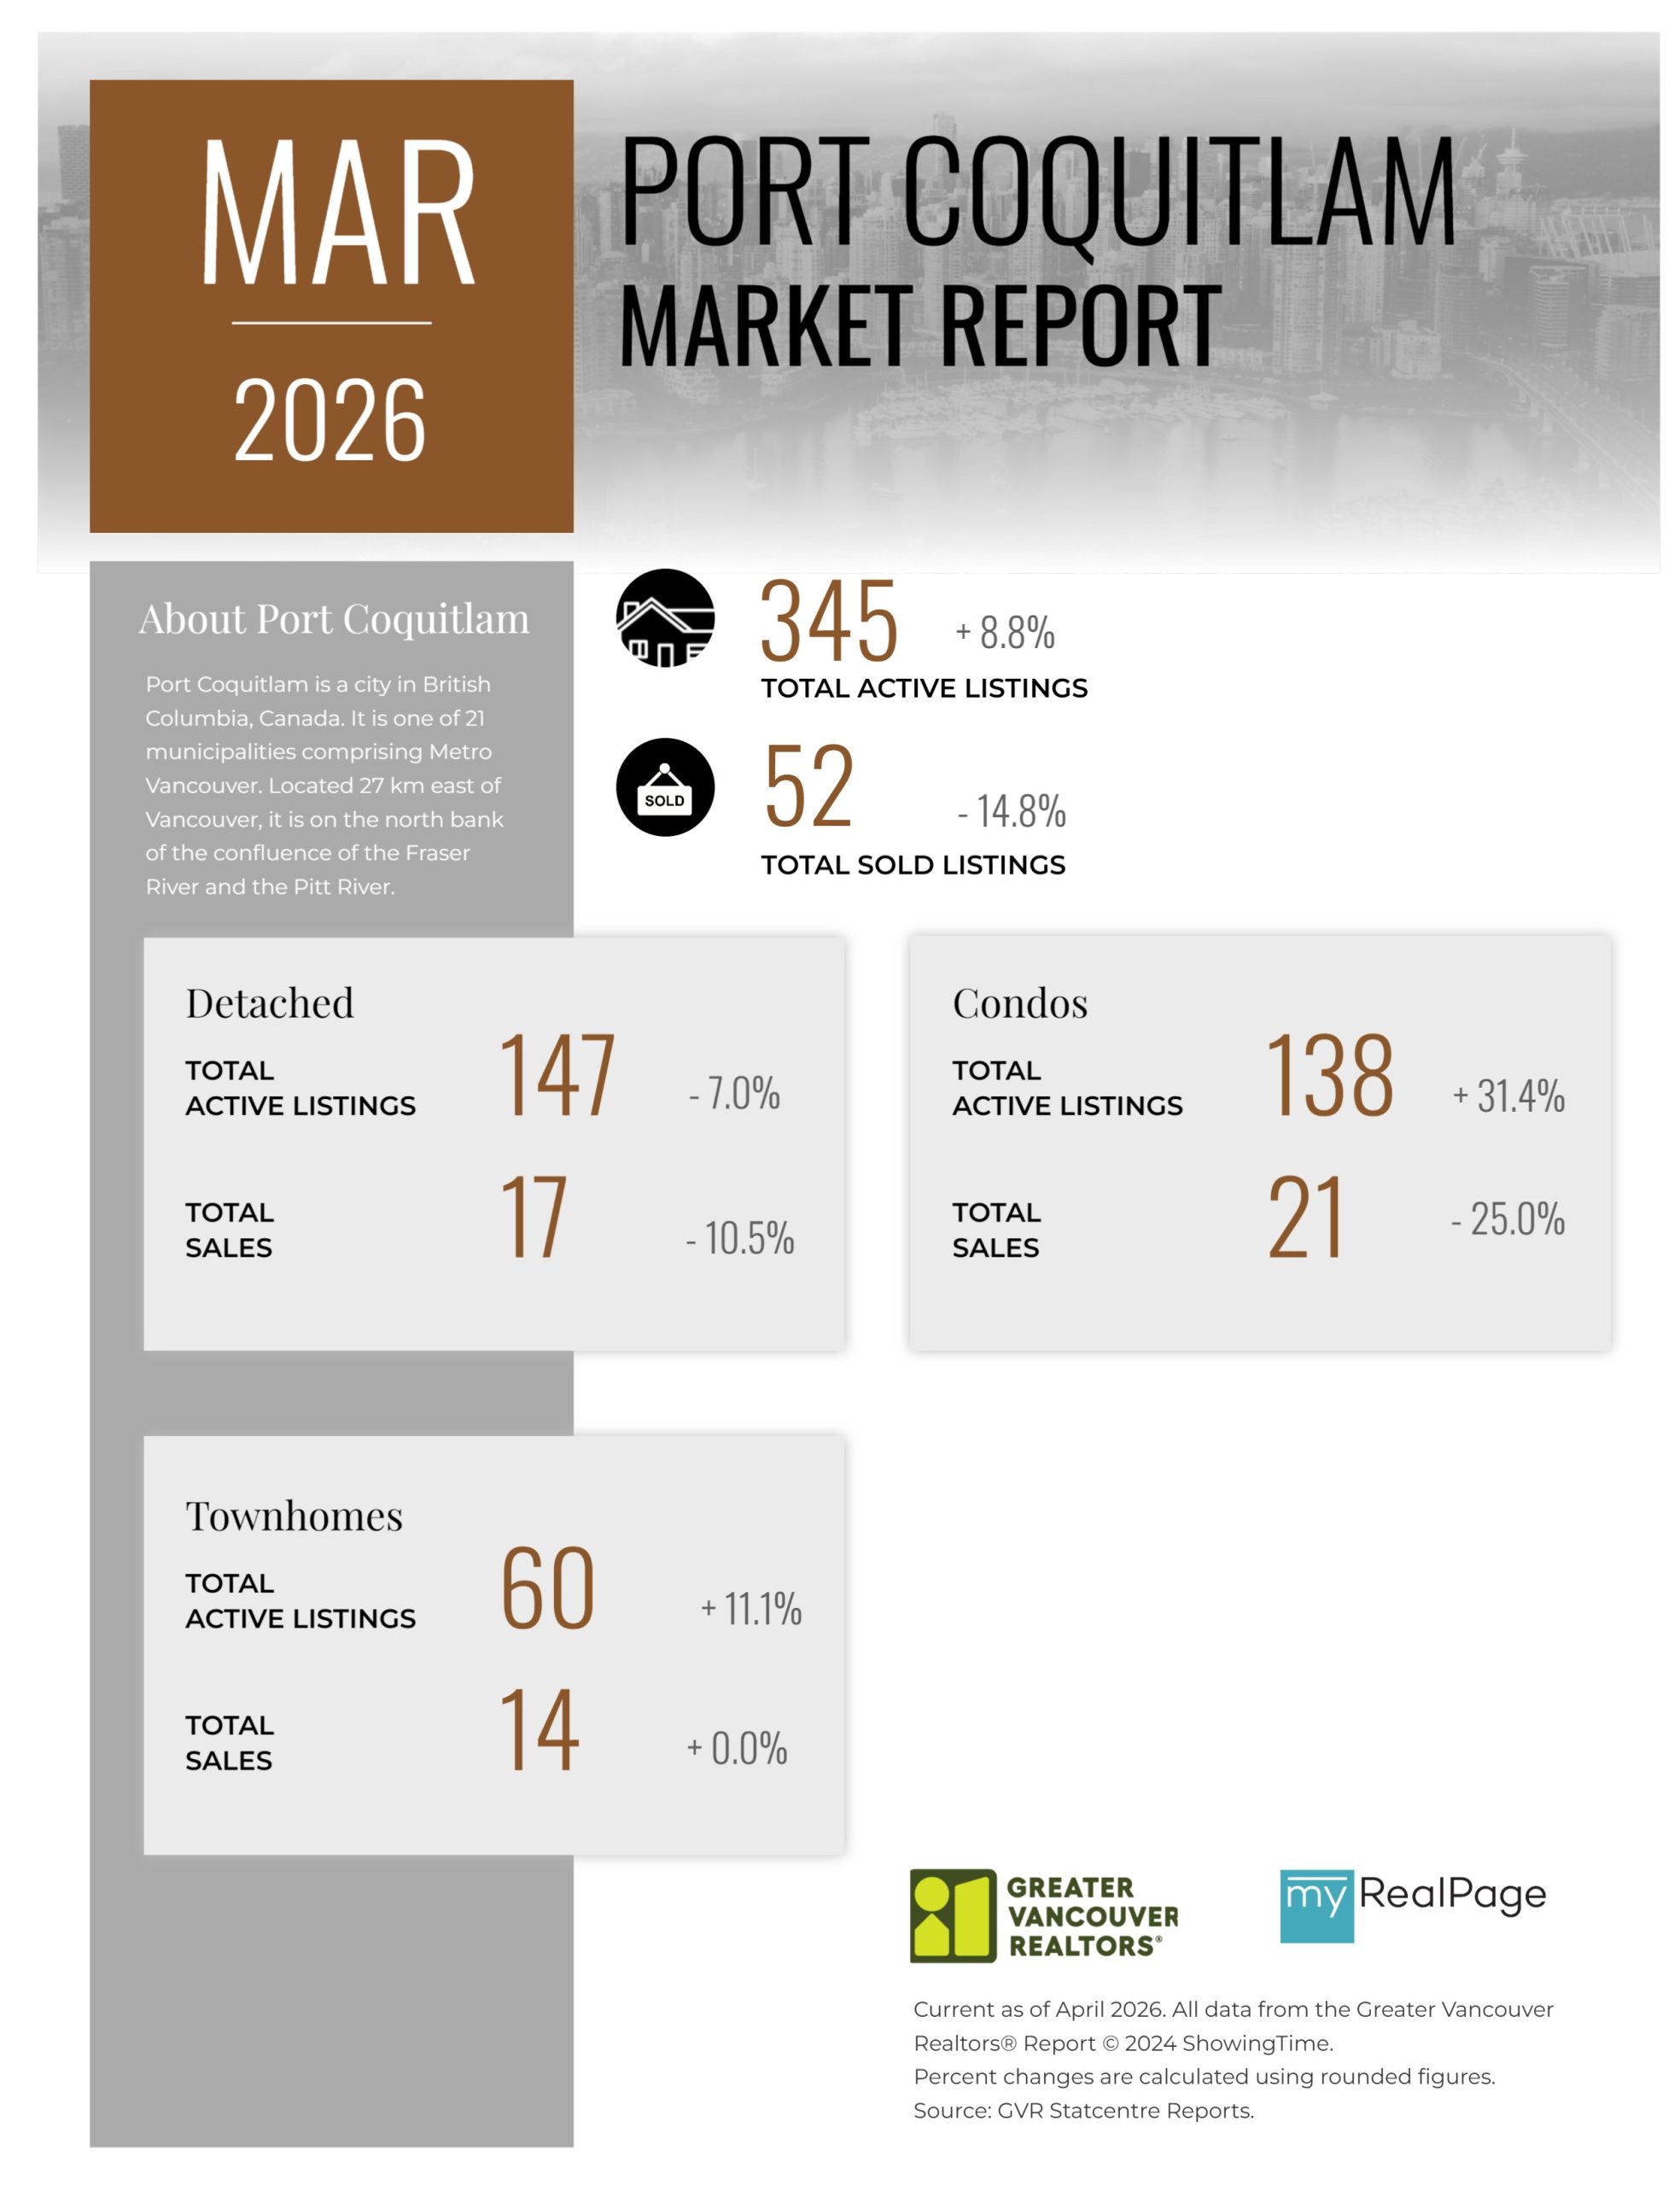
Printable Version – GVR March 2026 Data Infographics Report Port Coquitlam
Printable Version – GVR March 2026 Data Infographics Report Coquitlam
Printable Version – GVR March 2026 Data Infographic Report Burnaby North
Printable Version – GVR March 2026 Data Infographics Report Burnaby South
Printable Version – GVR March 2026 Data Infographics Report Burnaby East
Printable Version – GVR March 2026 Data Infographics Report New Westminster
Printable Version – GVR March 2026 Data Infographics Report Richmond
Printable Version – GVR March 2026 Data Infographics Report Squamish
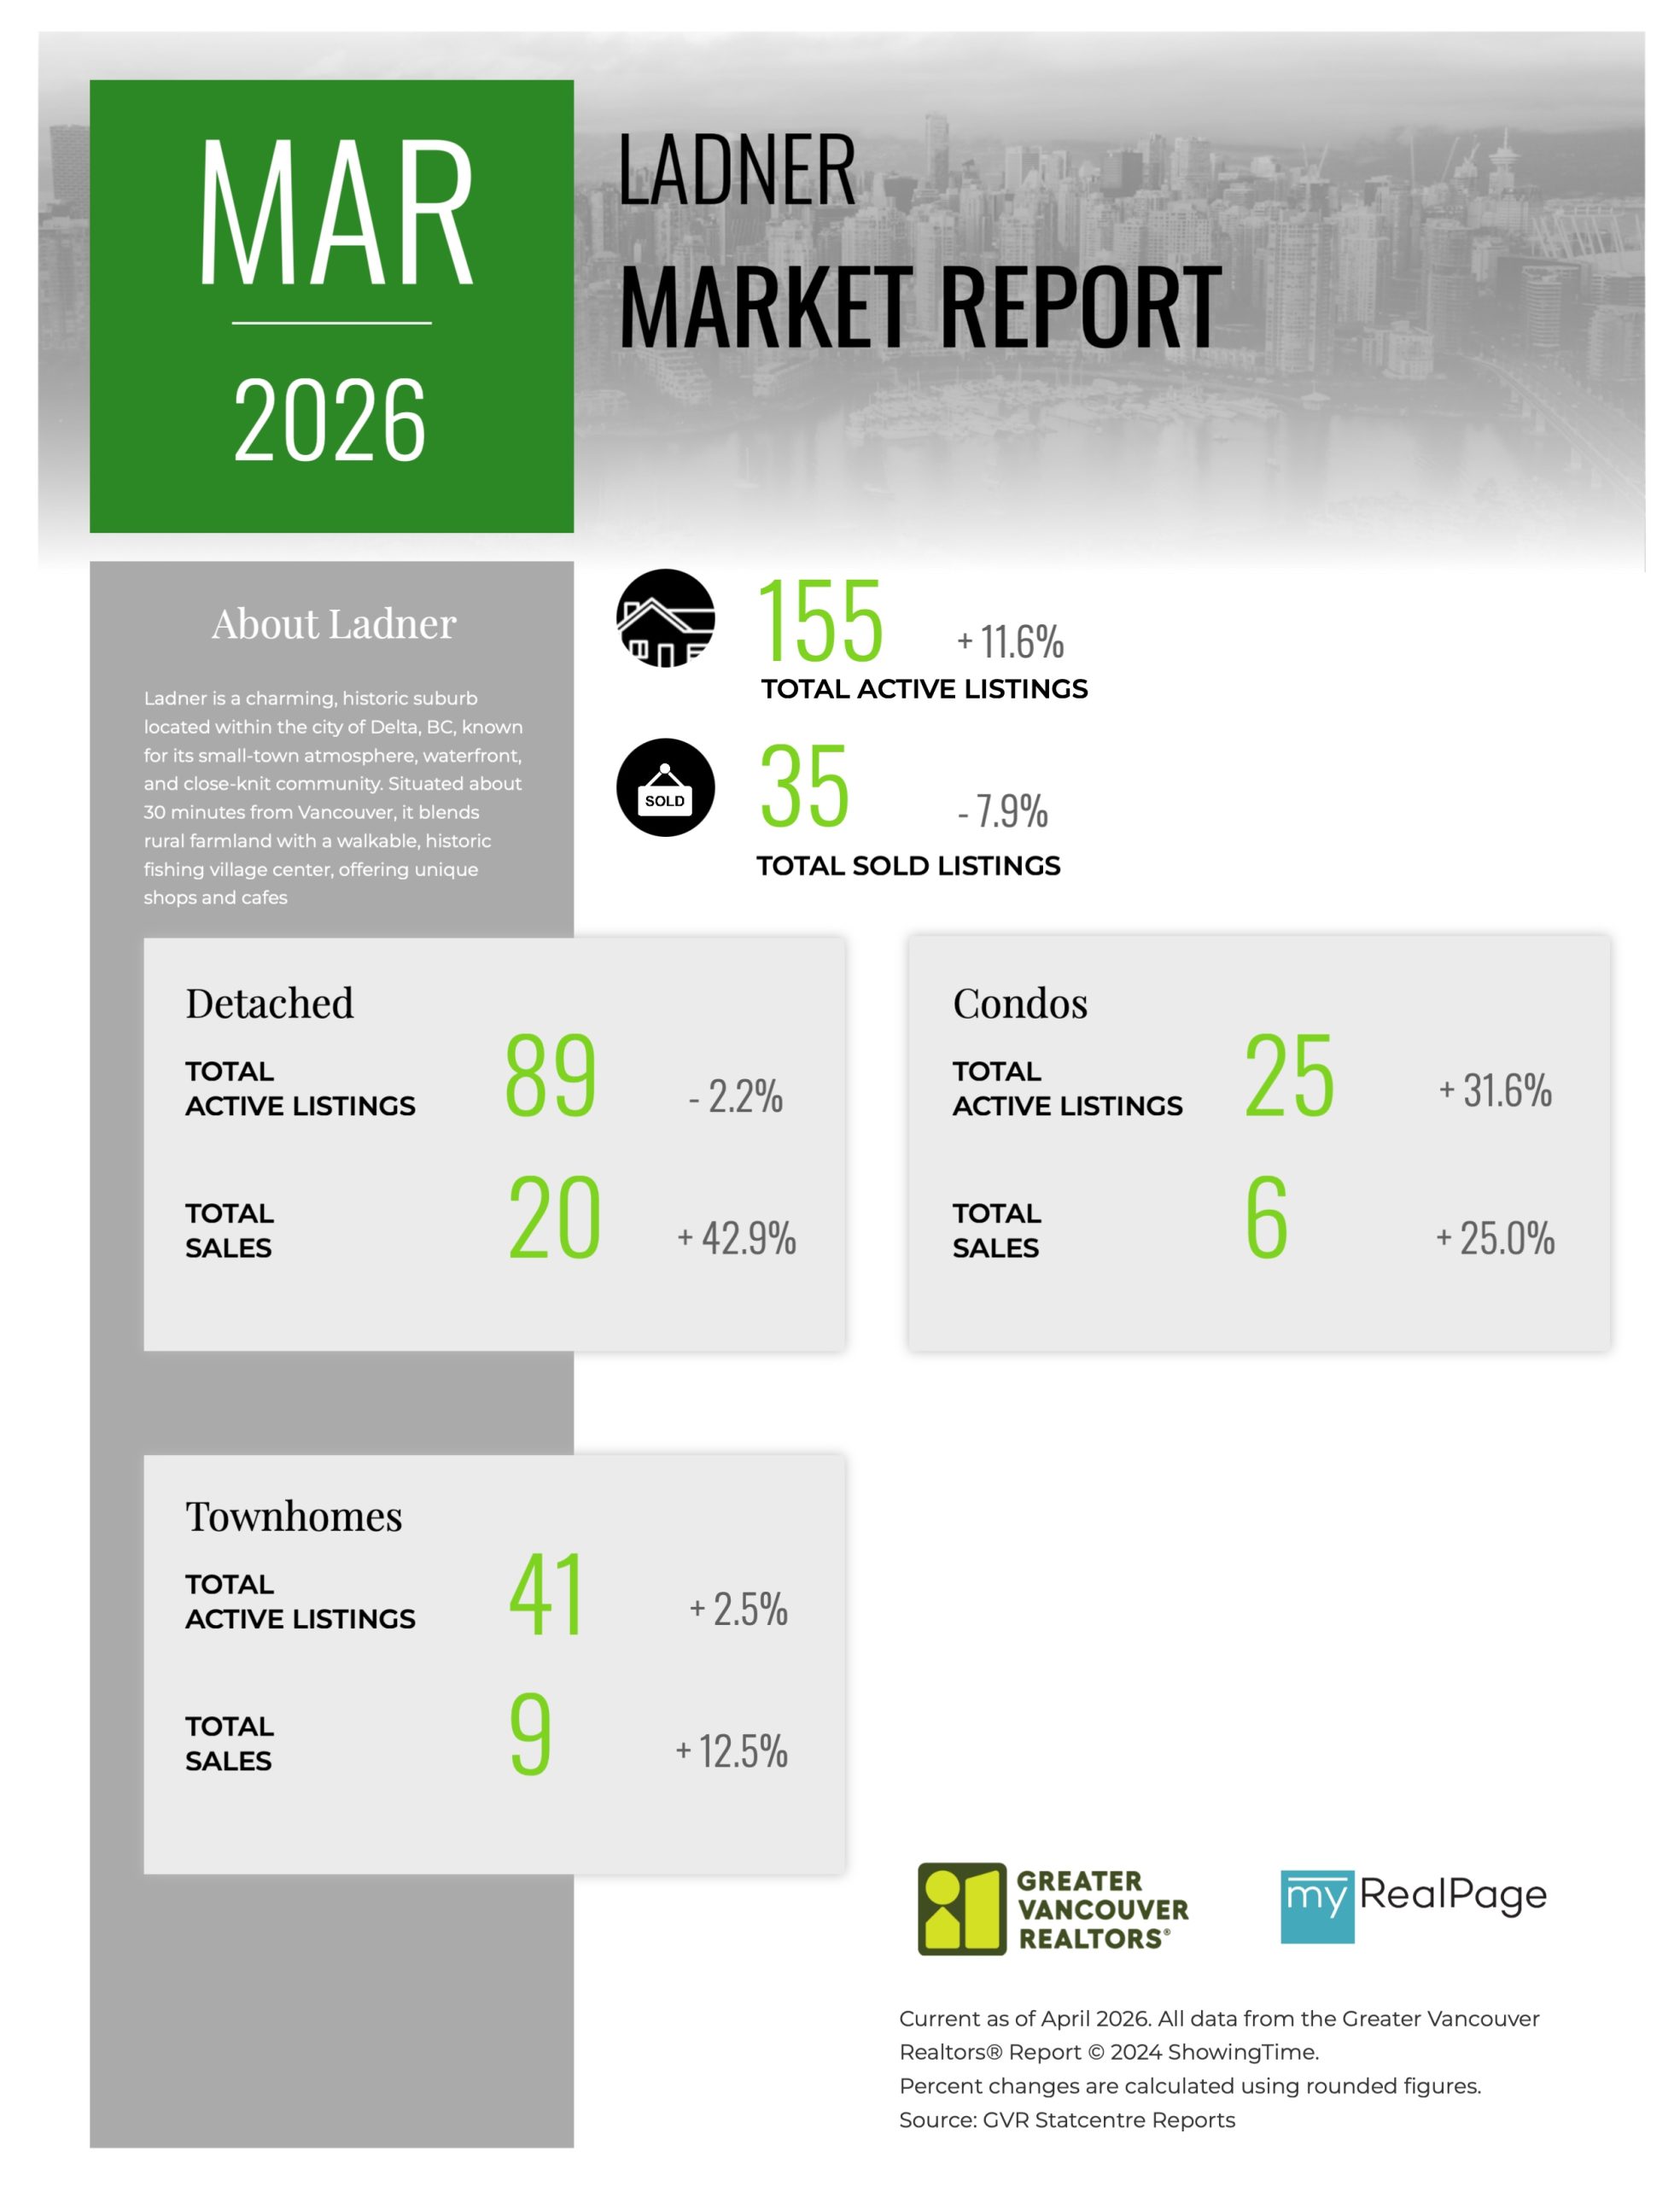
Printable Version – GVR March 2026 Data Infographics Report Ladner
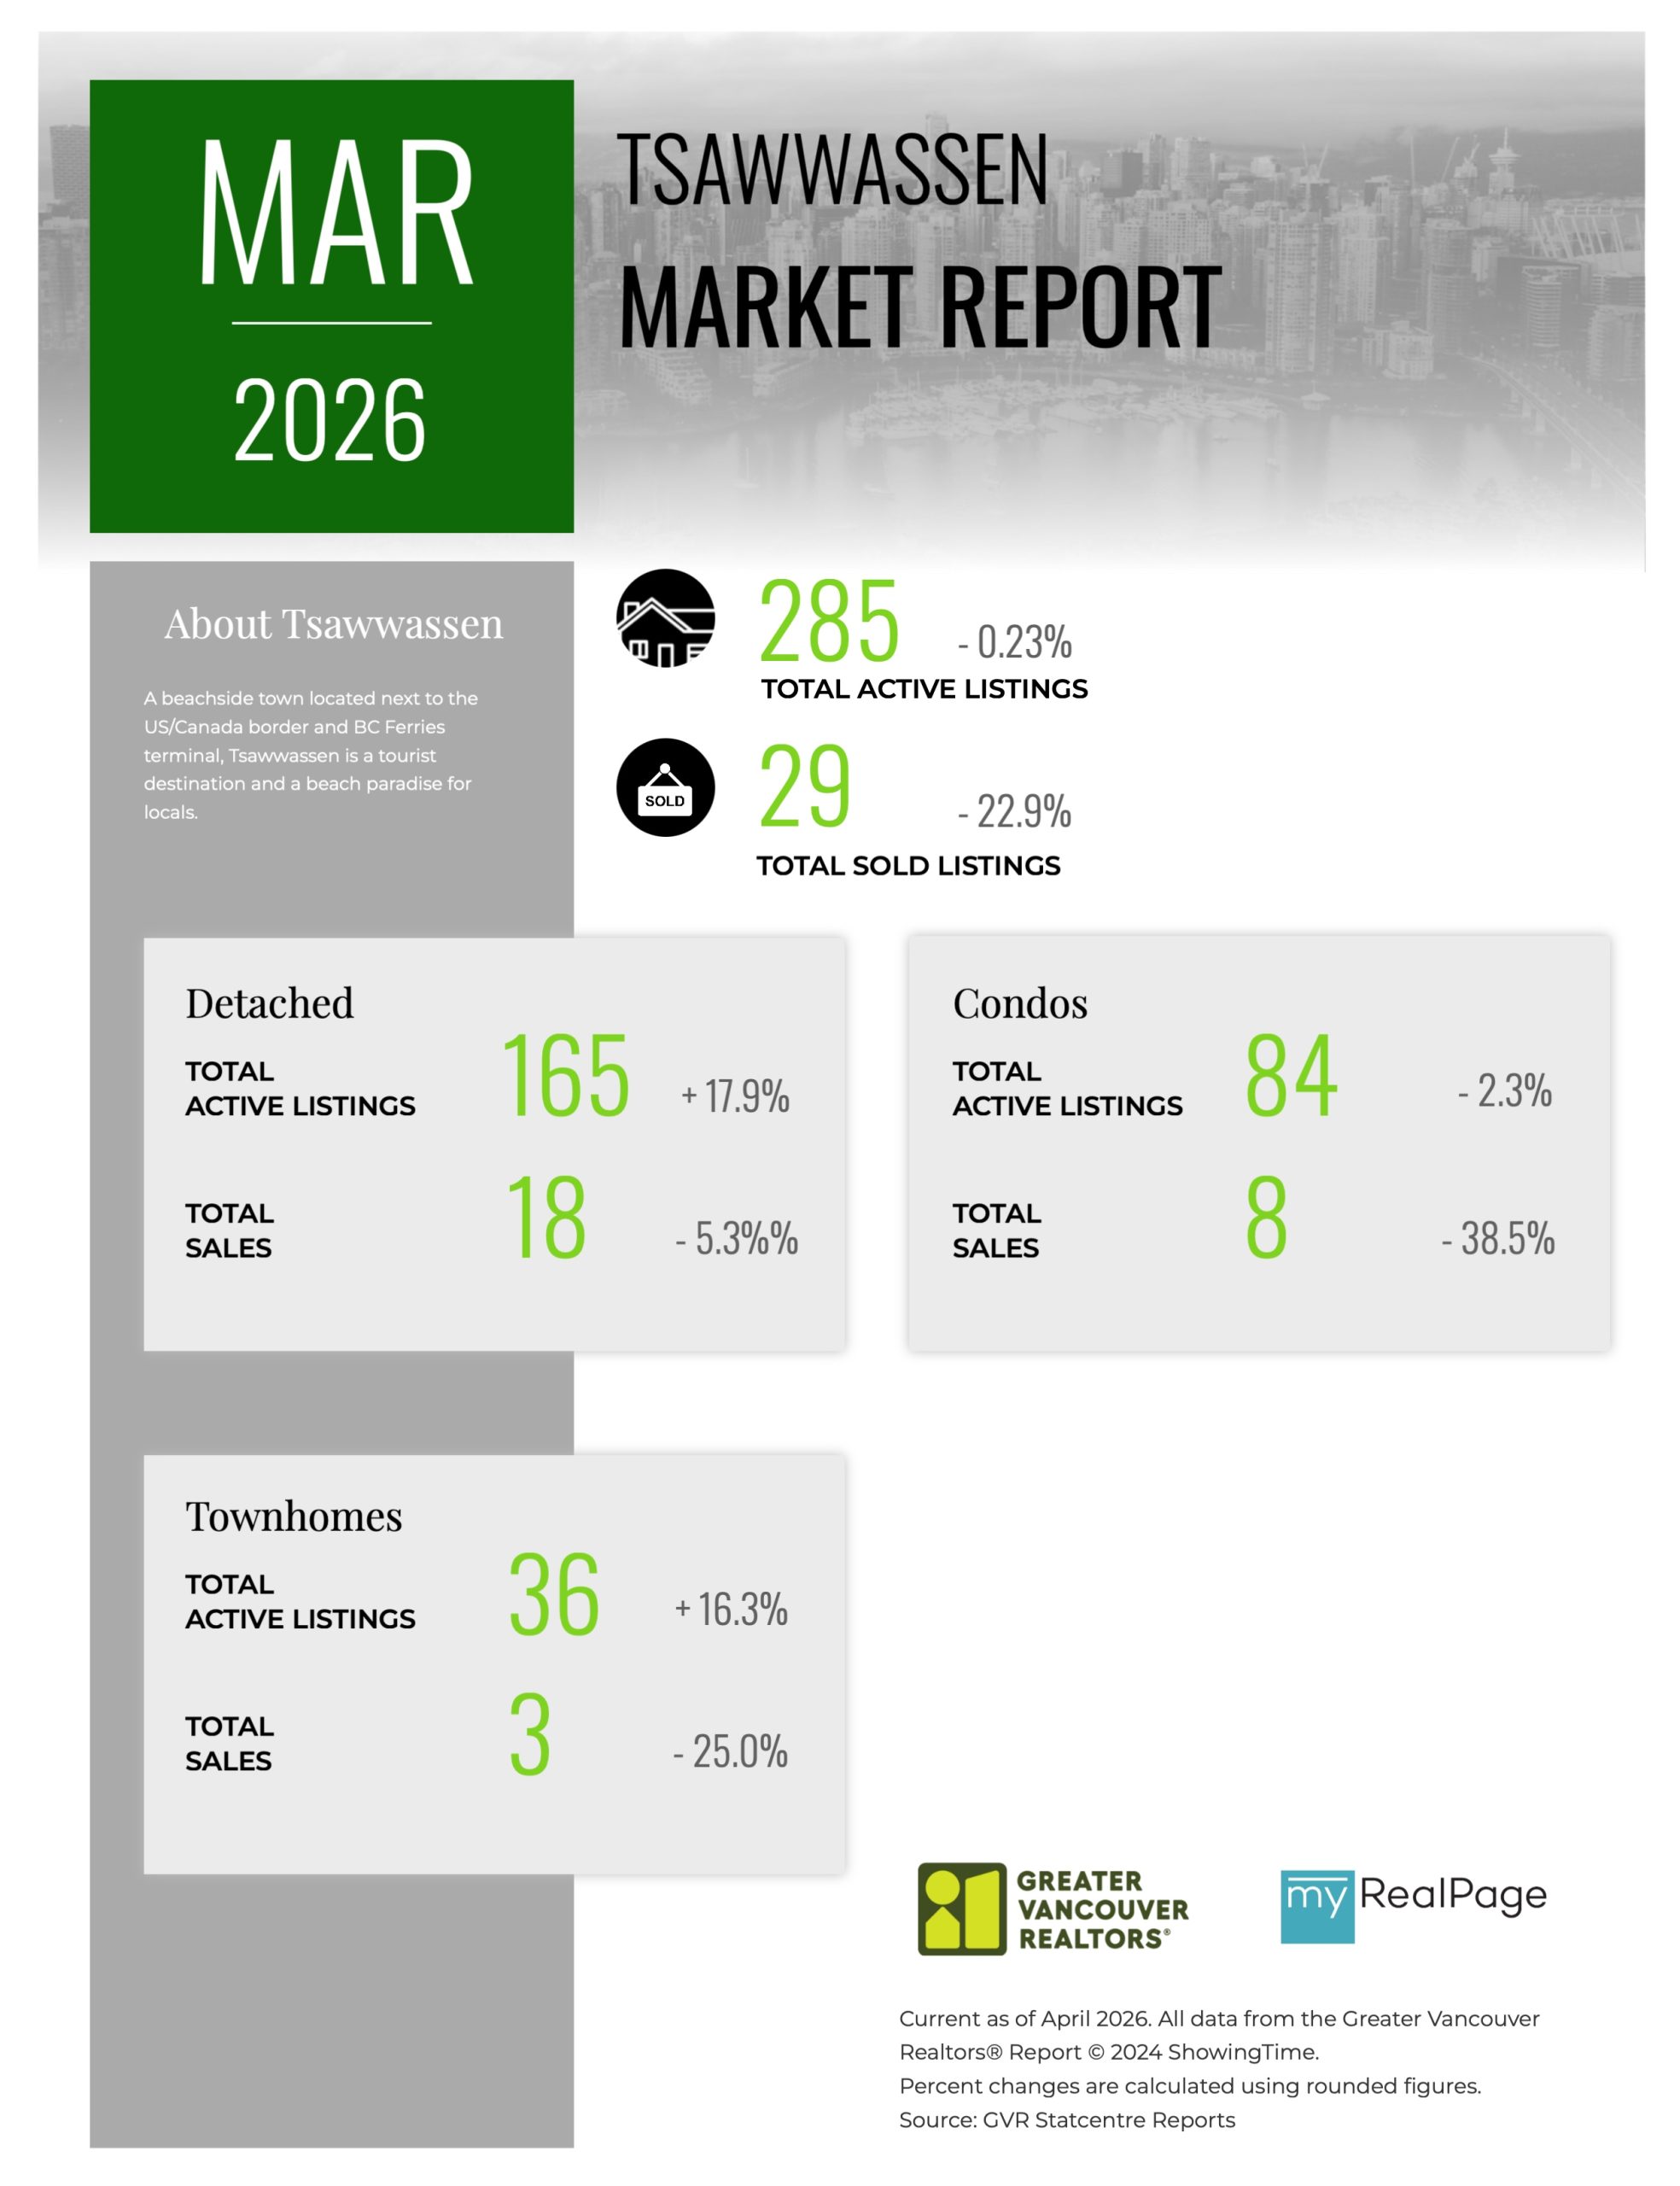
Printable Version – GVR March 2026 Data Infographics Report Tsawwassen


INFOGRAPHICS: February 2026 GVR Greater Vancouver Market Reports
New normal for Metro Vancouver’s housing market continues
Metro Vancouver home sales registered on the MLS® in February continued the recent trend of slower-than-average sales, seeing a ten per cent decline over the same period last year.
The Greater Vancouver REALTORS® (GVR) reports that residential sales in the region totalled 1,648 in February 2026, a 9.8 per cent decrease from the 1,827 sales recorded in February 2025. This was 28.7 per cent below the 10-year seasonal average (2,310).
“With each passing data point, the pace of sales running well-below long-term averages are no longer a surprise – it’s become the new norm. A surprising finding this February, however, is that home sellers appear less eager to list their homes relative to last year with new listings down about seven percent, mostly driven by fewer listings in the apartment segment.” Andrew Lis, GVR chief economist and vice-president data analytics
Read the full report on the REBGV website!
The following data is a comparison between February 2026 and February 2025 numbers, and is current as of March of 2026. For last month’s update, you can check out our previous post!
Or follow this link for all our GVR Infographics!
These infographics cover current trends in several areas within the Greater Vancouver region. Click on the images for a larger view!
Printable Version – GVR February 2026 Data Infographic Report North Vancouver
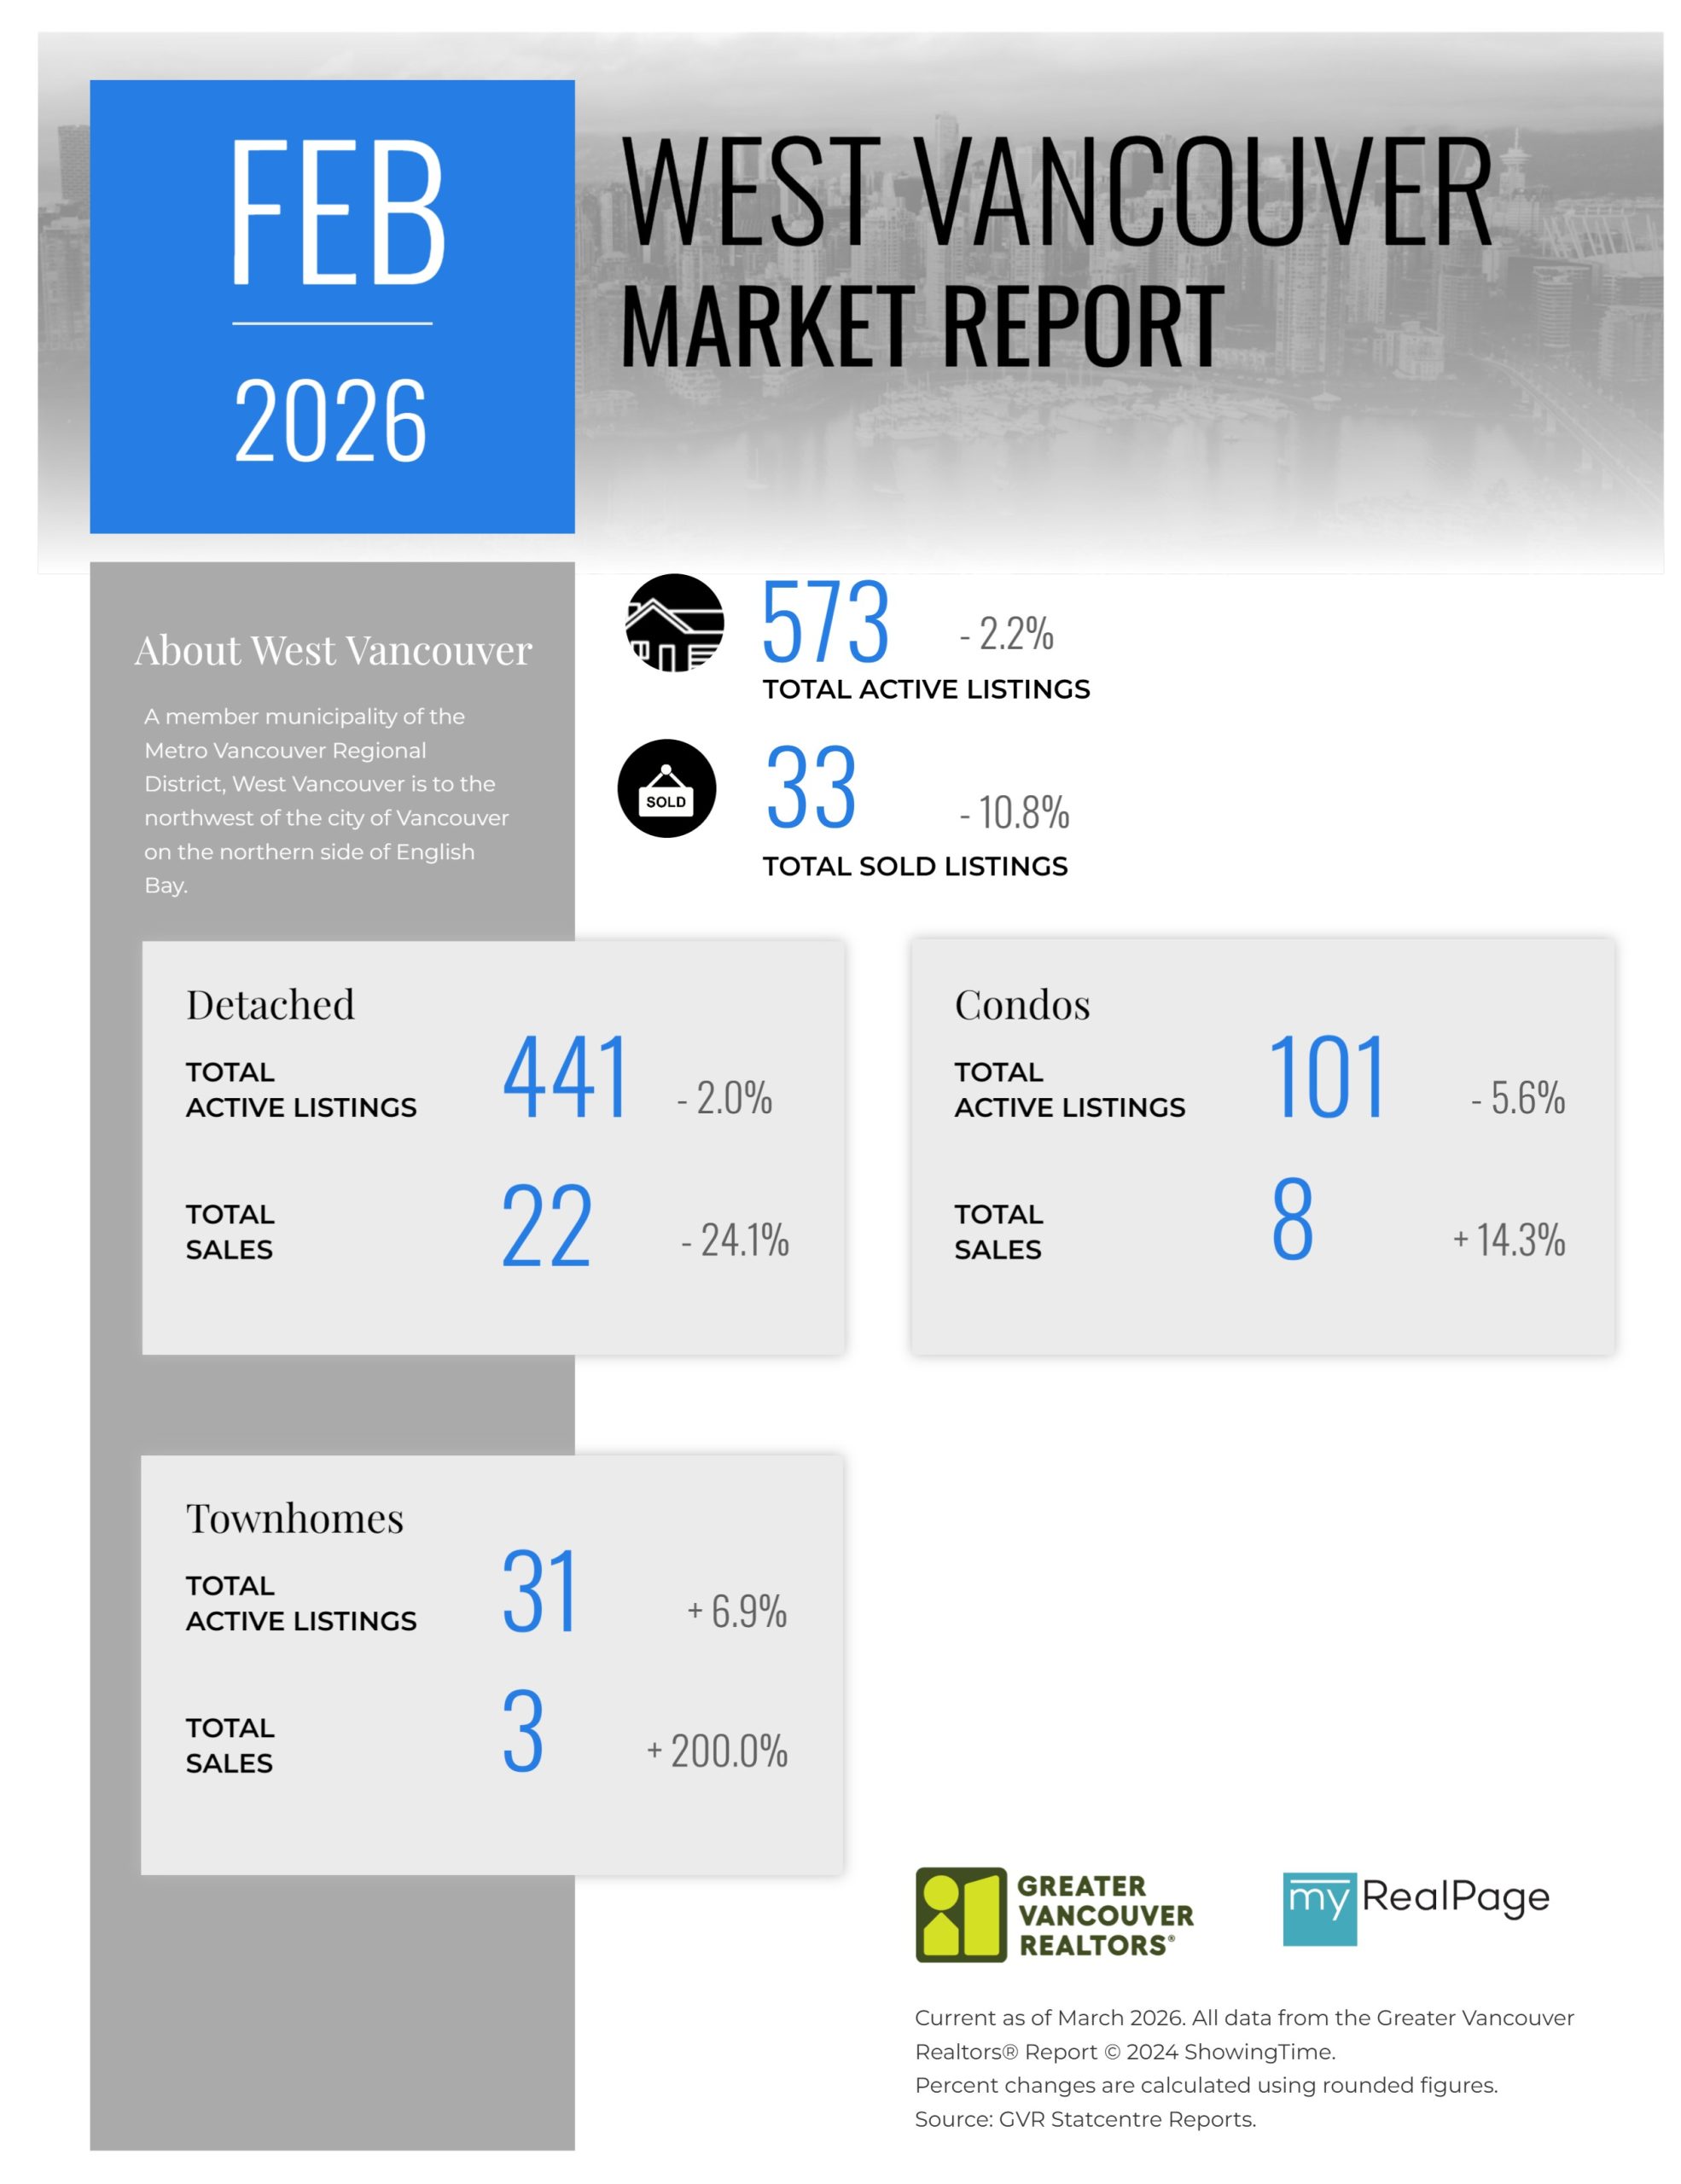
Printable Version – GVR February 2026 Data Infographics Report West Vancouver
Printable Version – GVR February 2026 Data Infographics Report Vancouver West
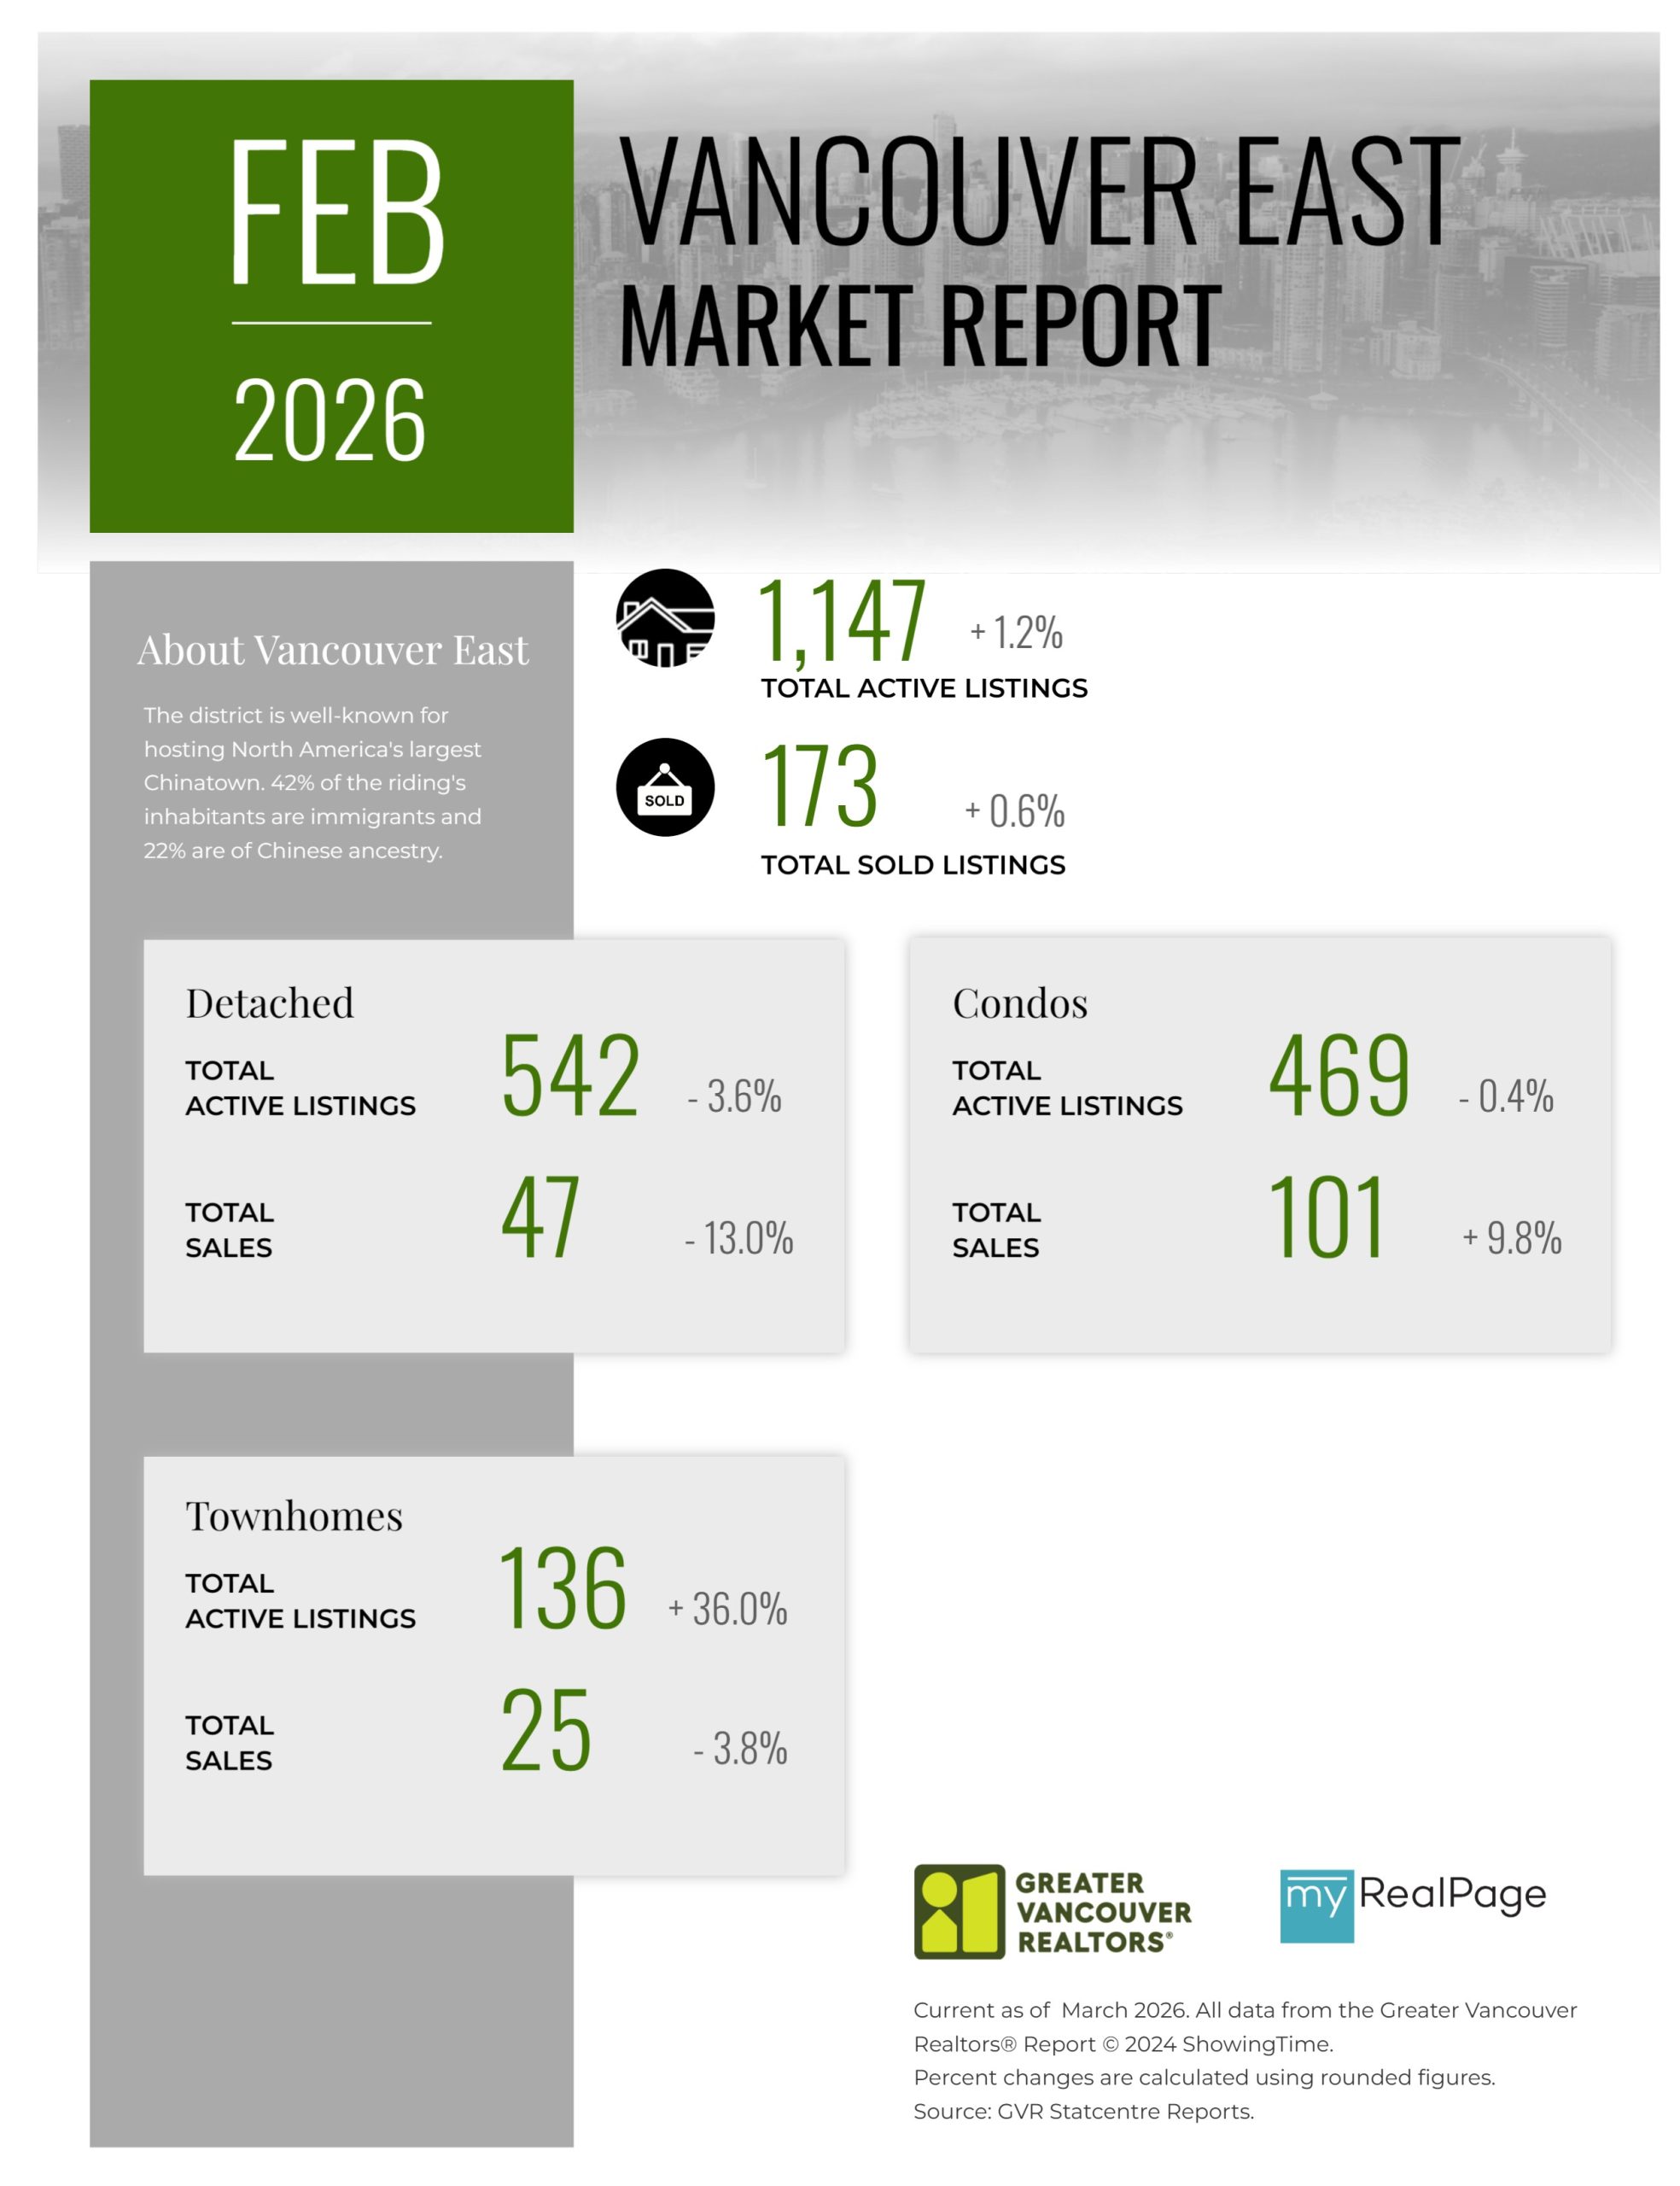
Printable Version – GVR February 2026 Data Infographics Report Vancouver East
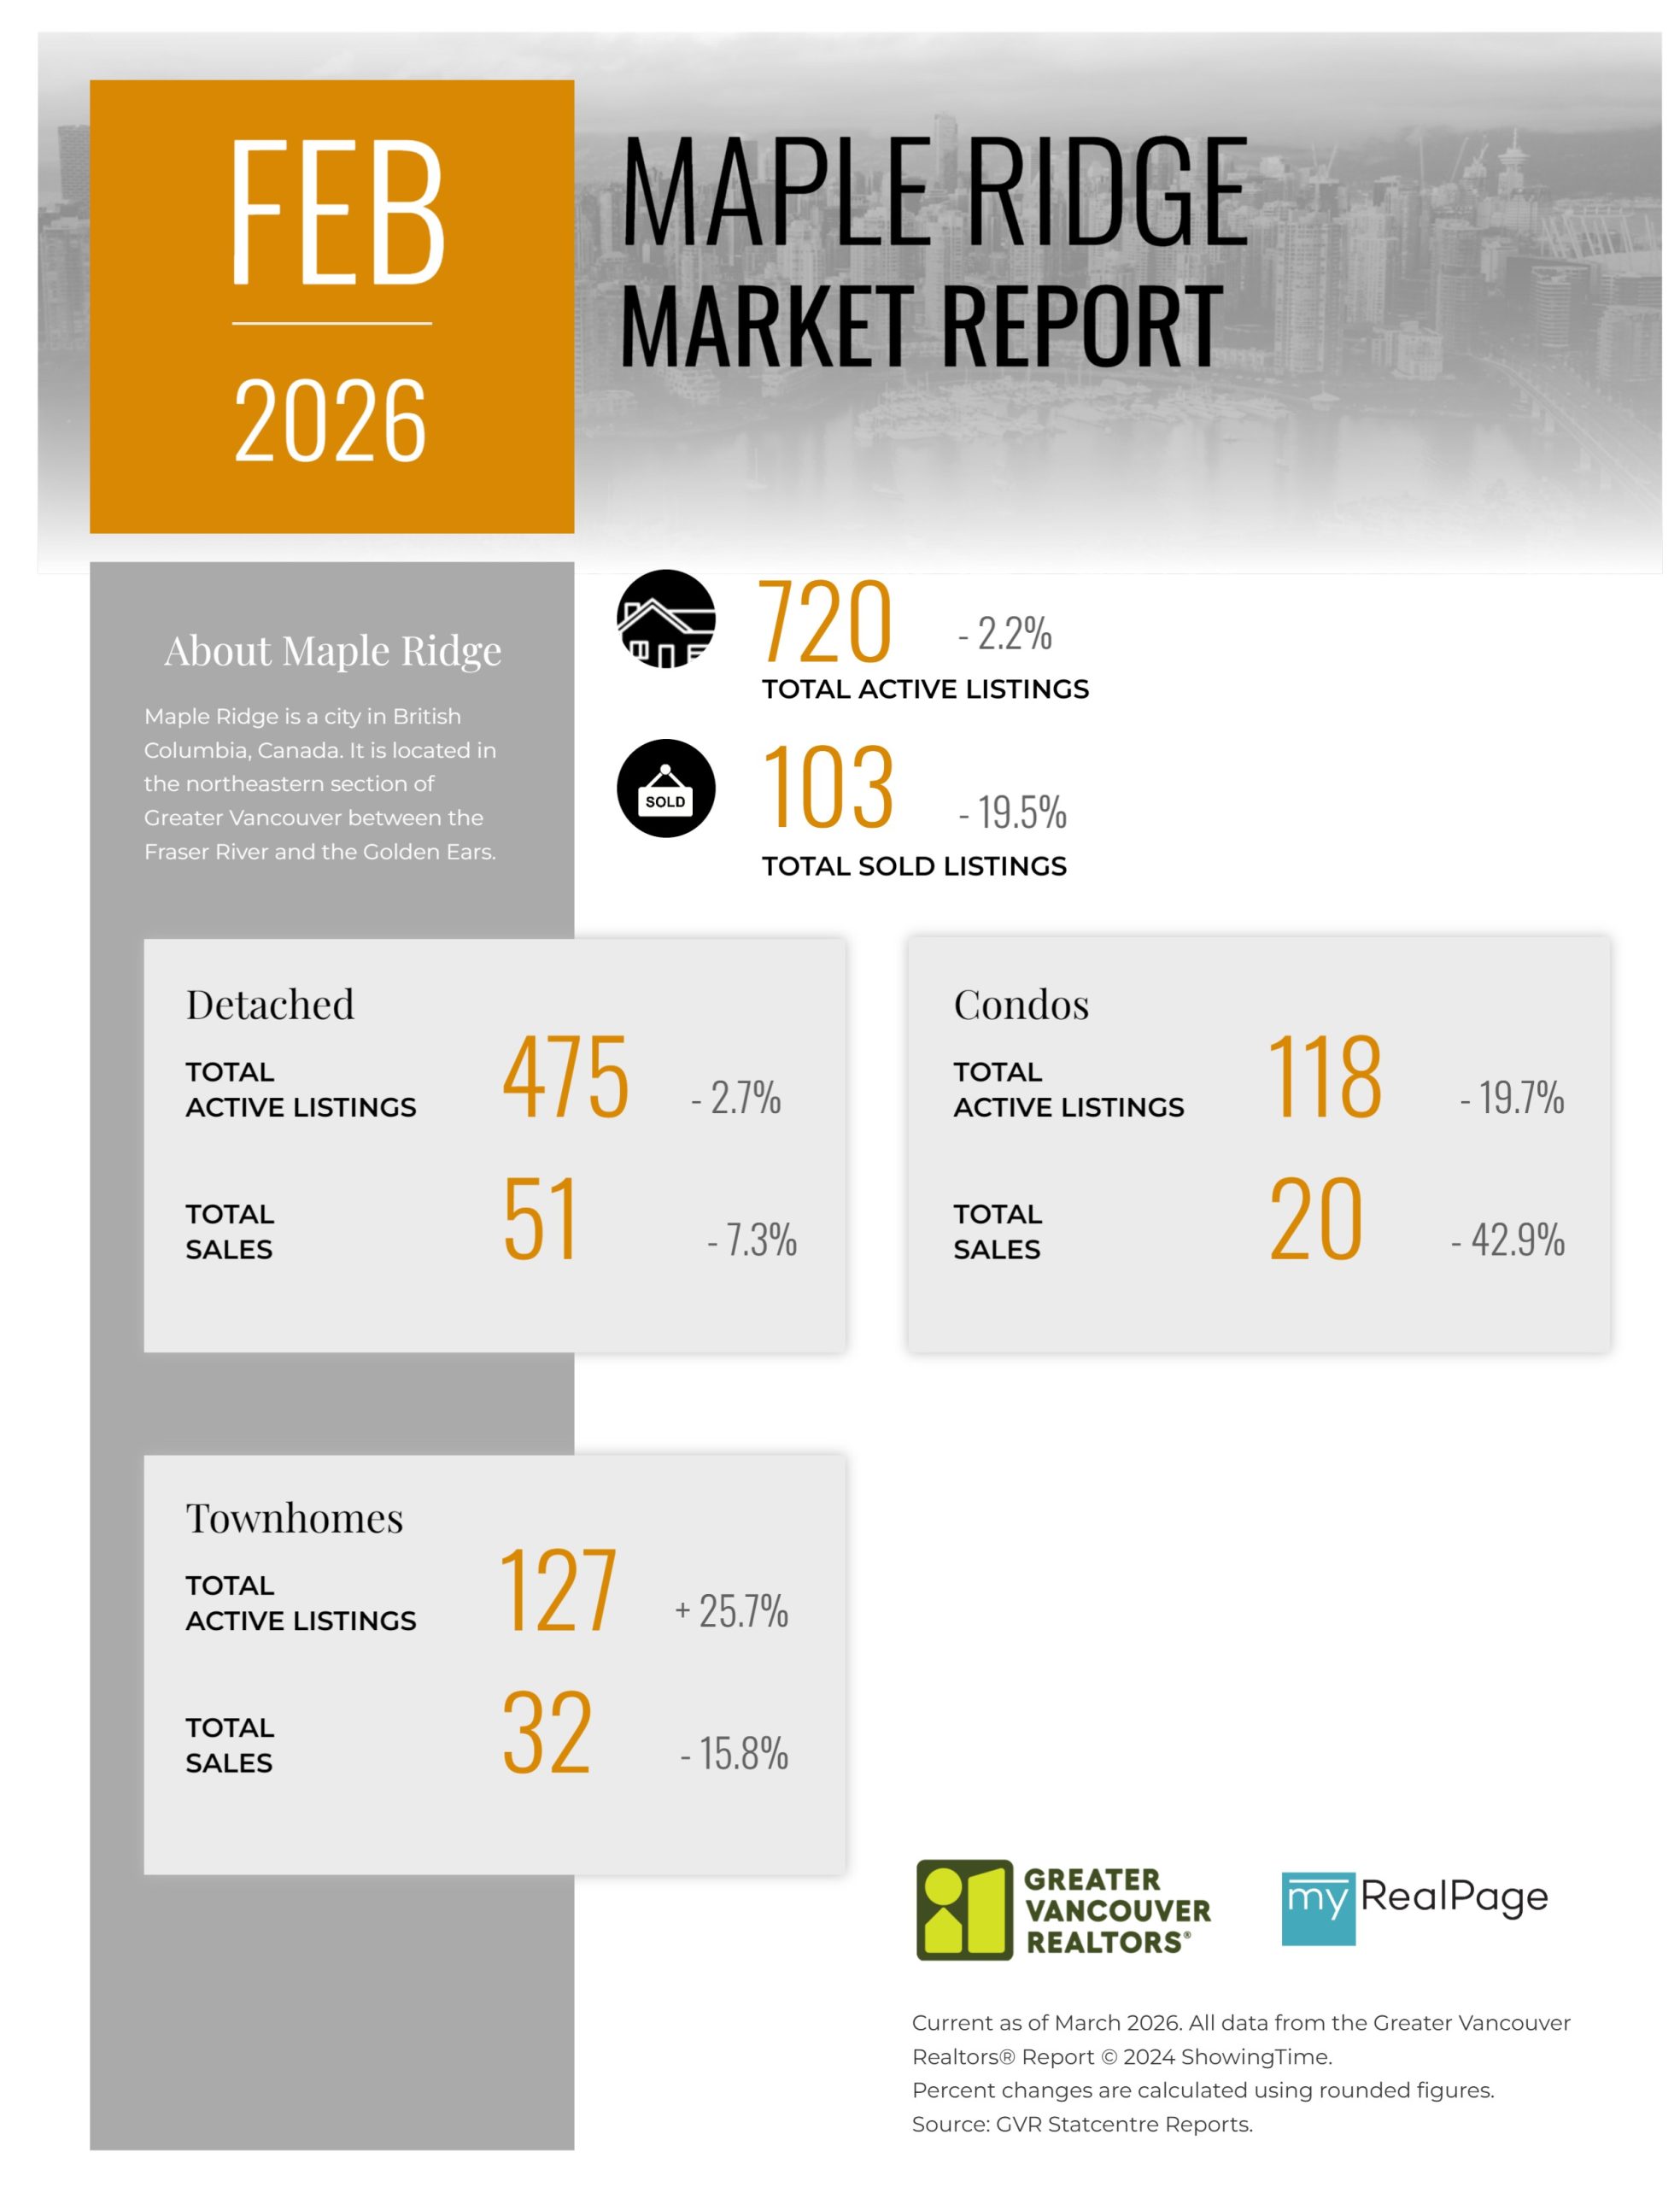
Printable Version – GVR February 2026 Data Infographic Report Maple Ridge
Printable Version – GVR February 2026 Data Infographics Report Pitt Meadows
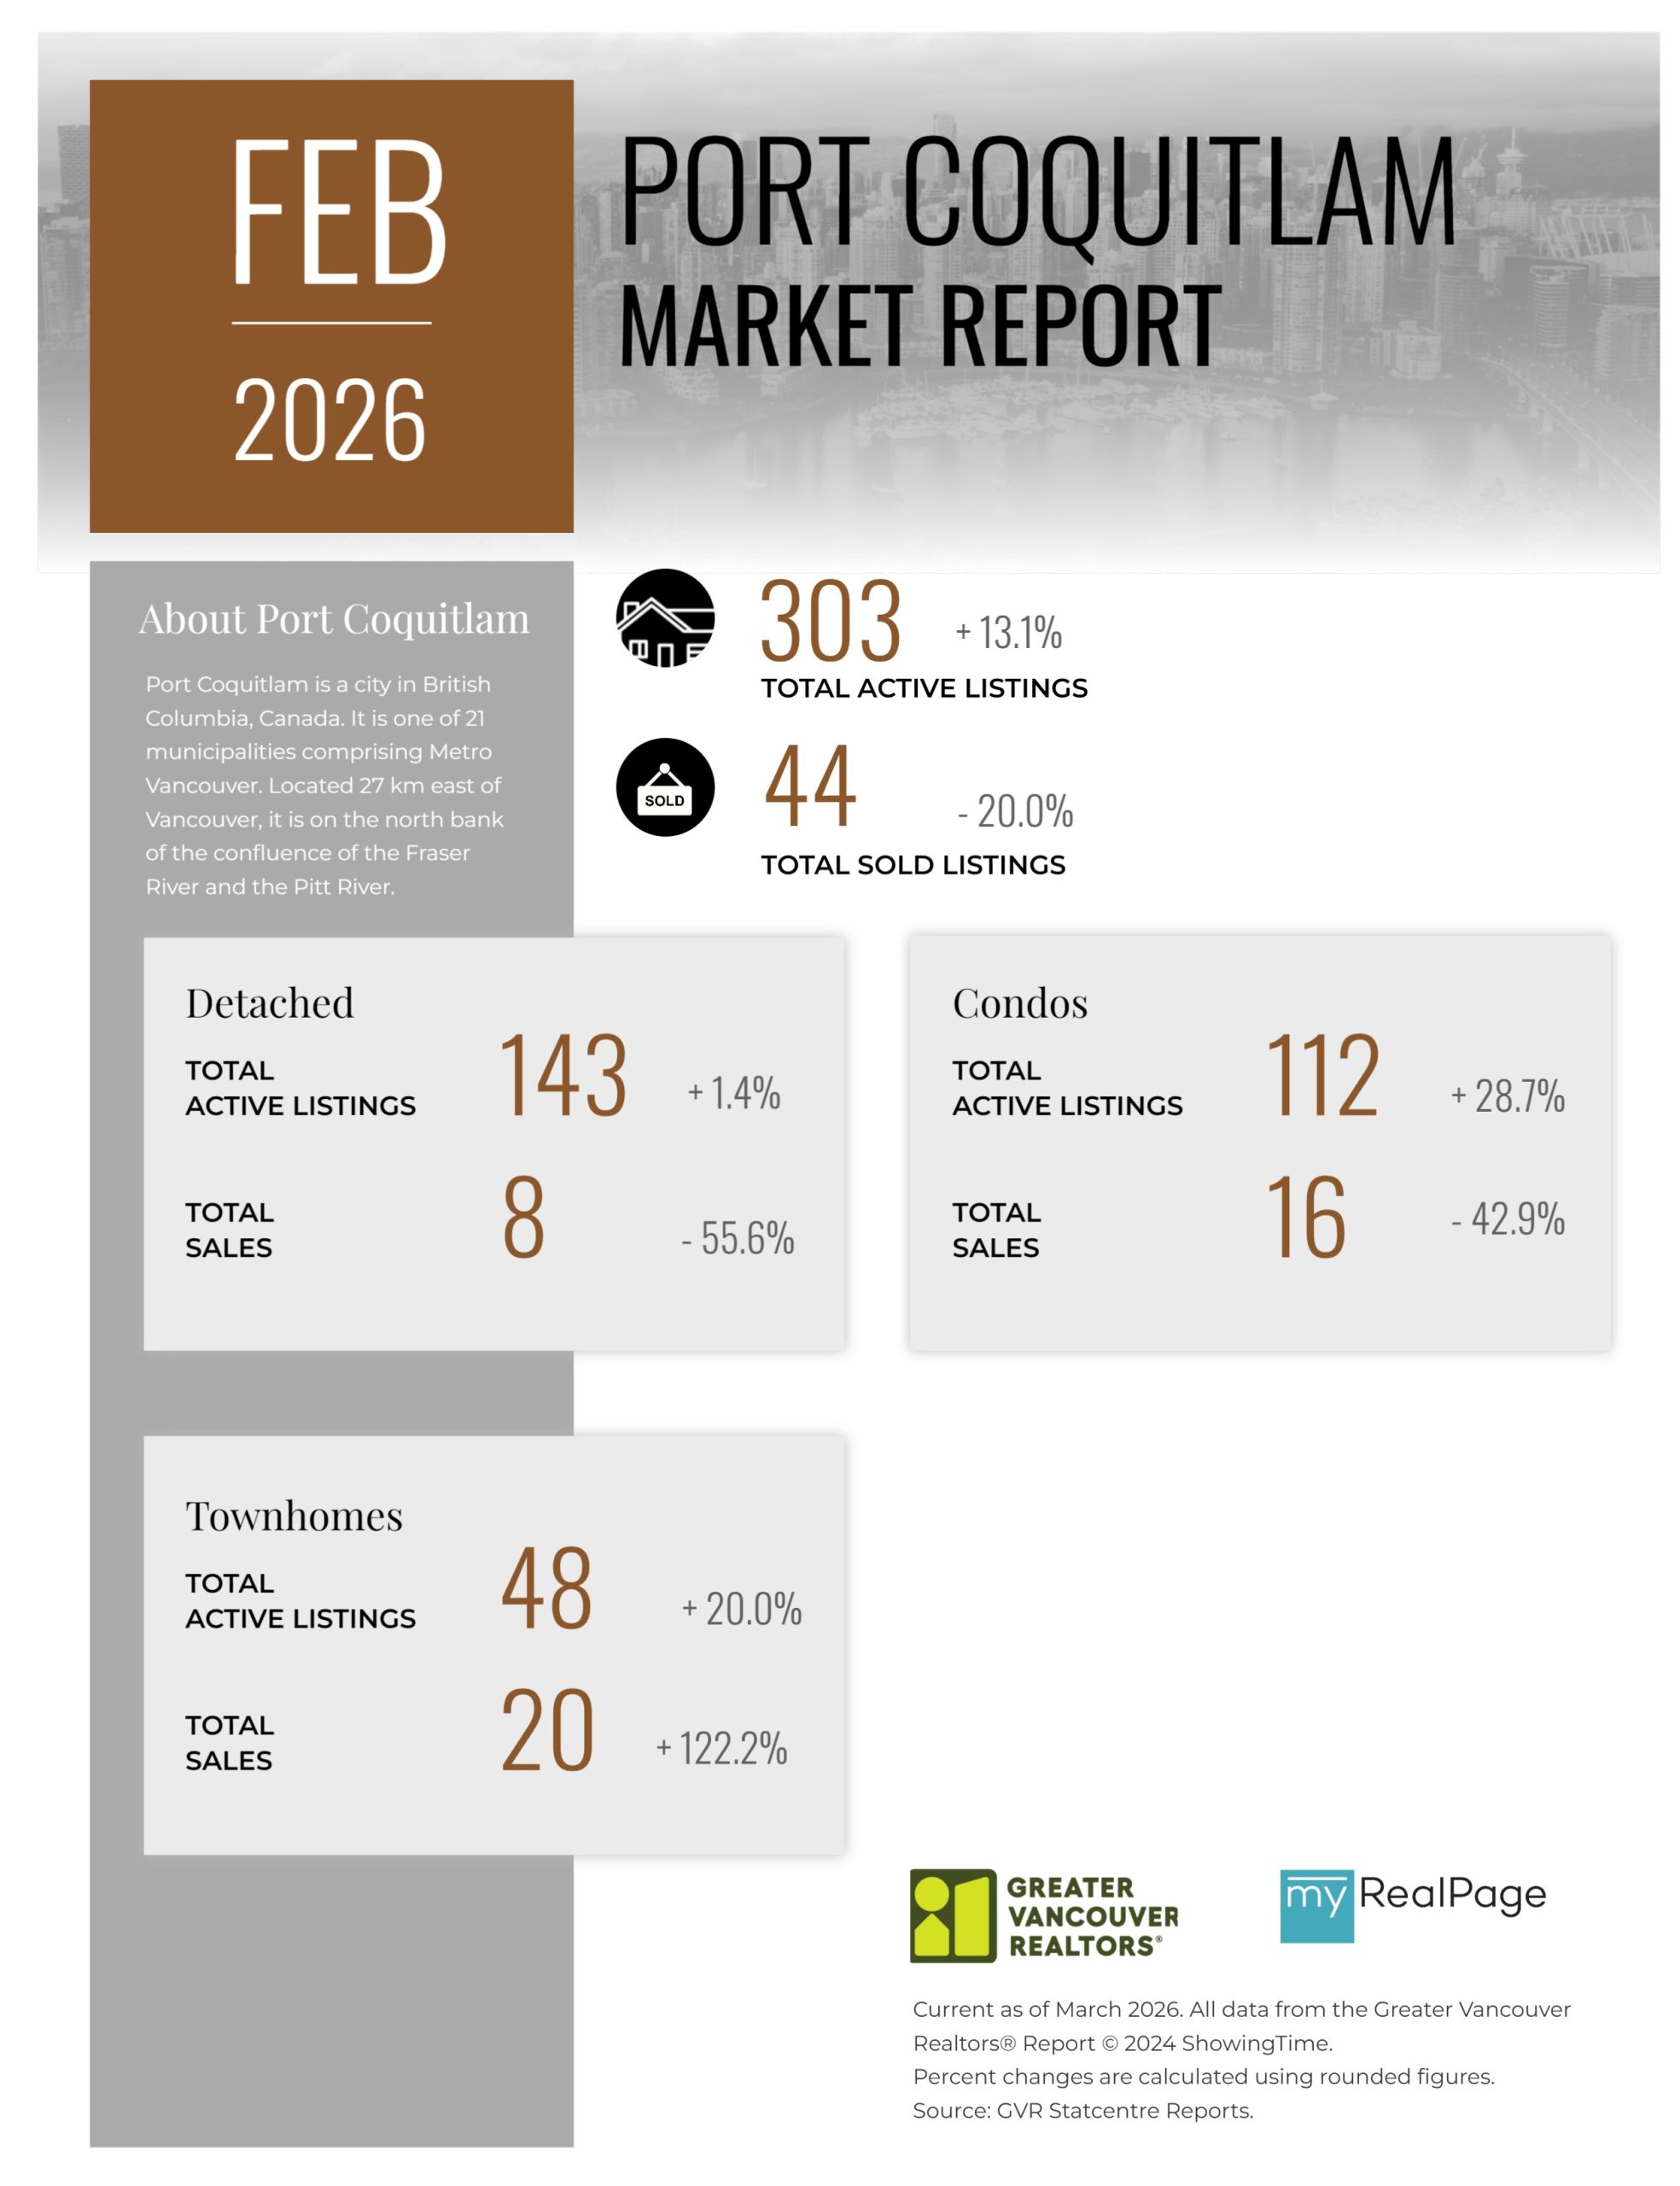
Printable Version – GVR February 2026 Data Infographics Report Port Coquitlam
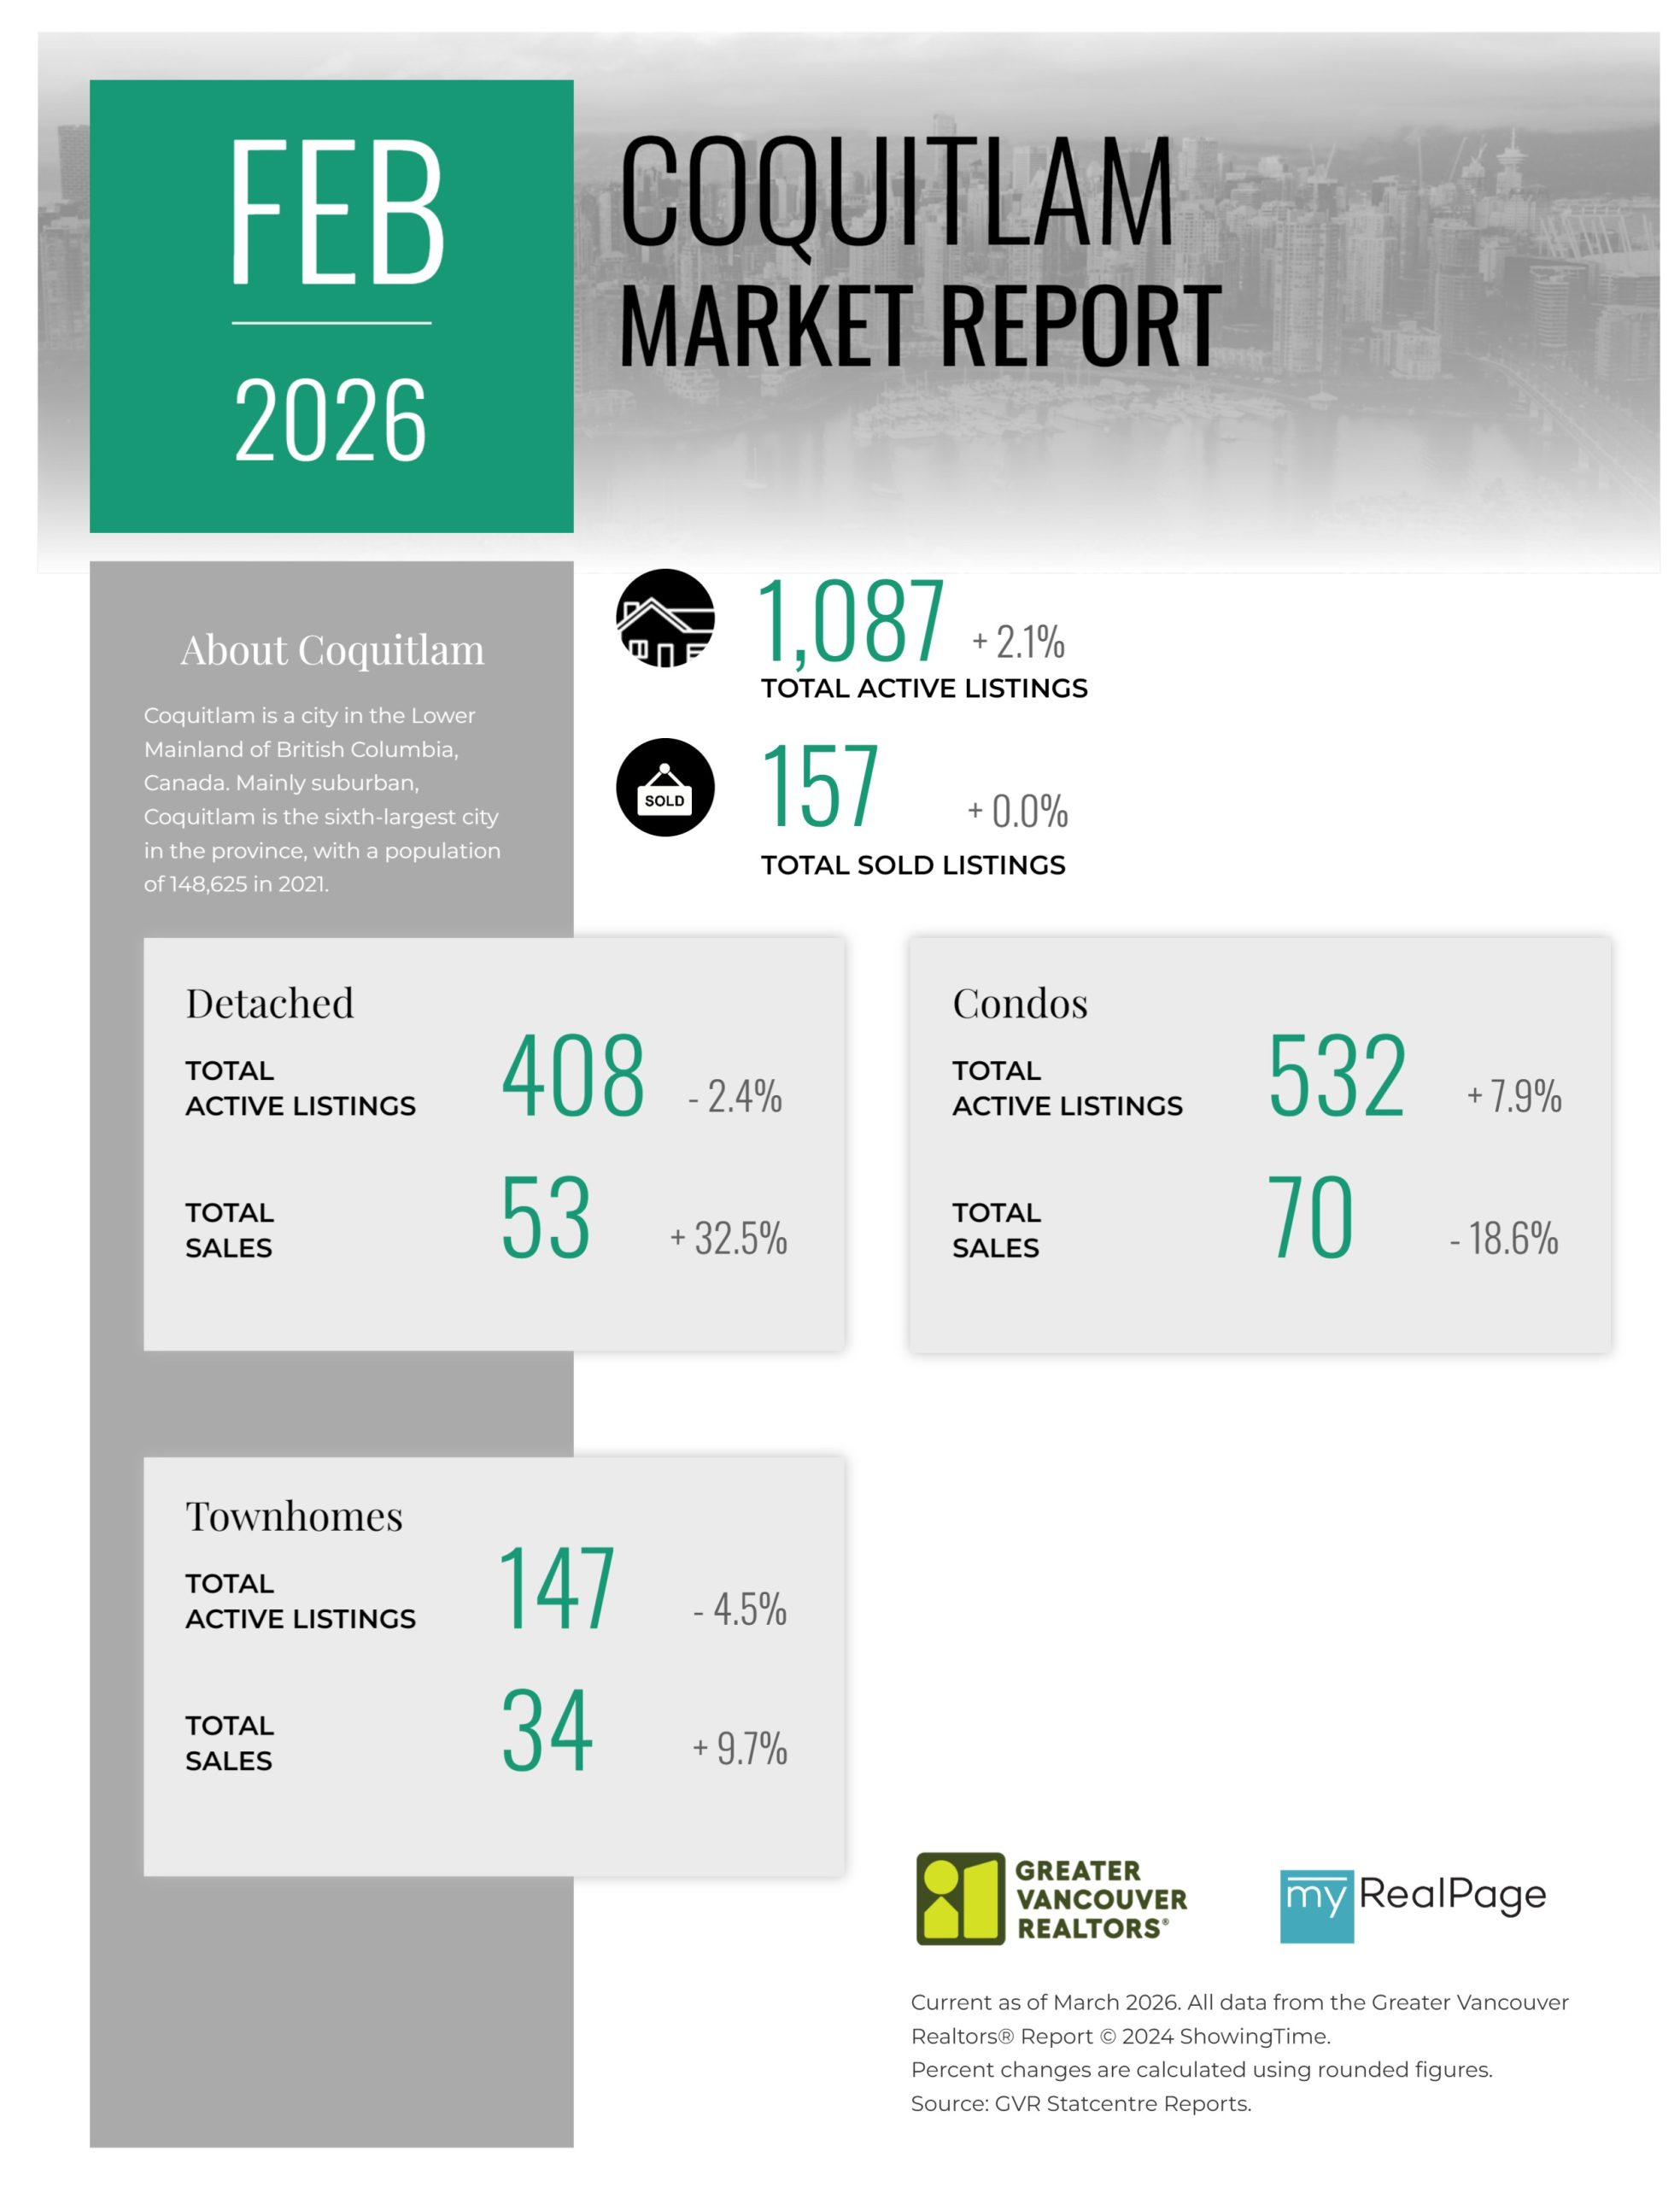
Printable Version – GVR February 2026 Data Infographics Report Coquitlam
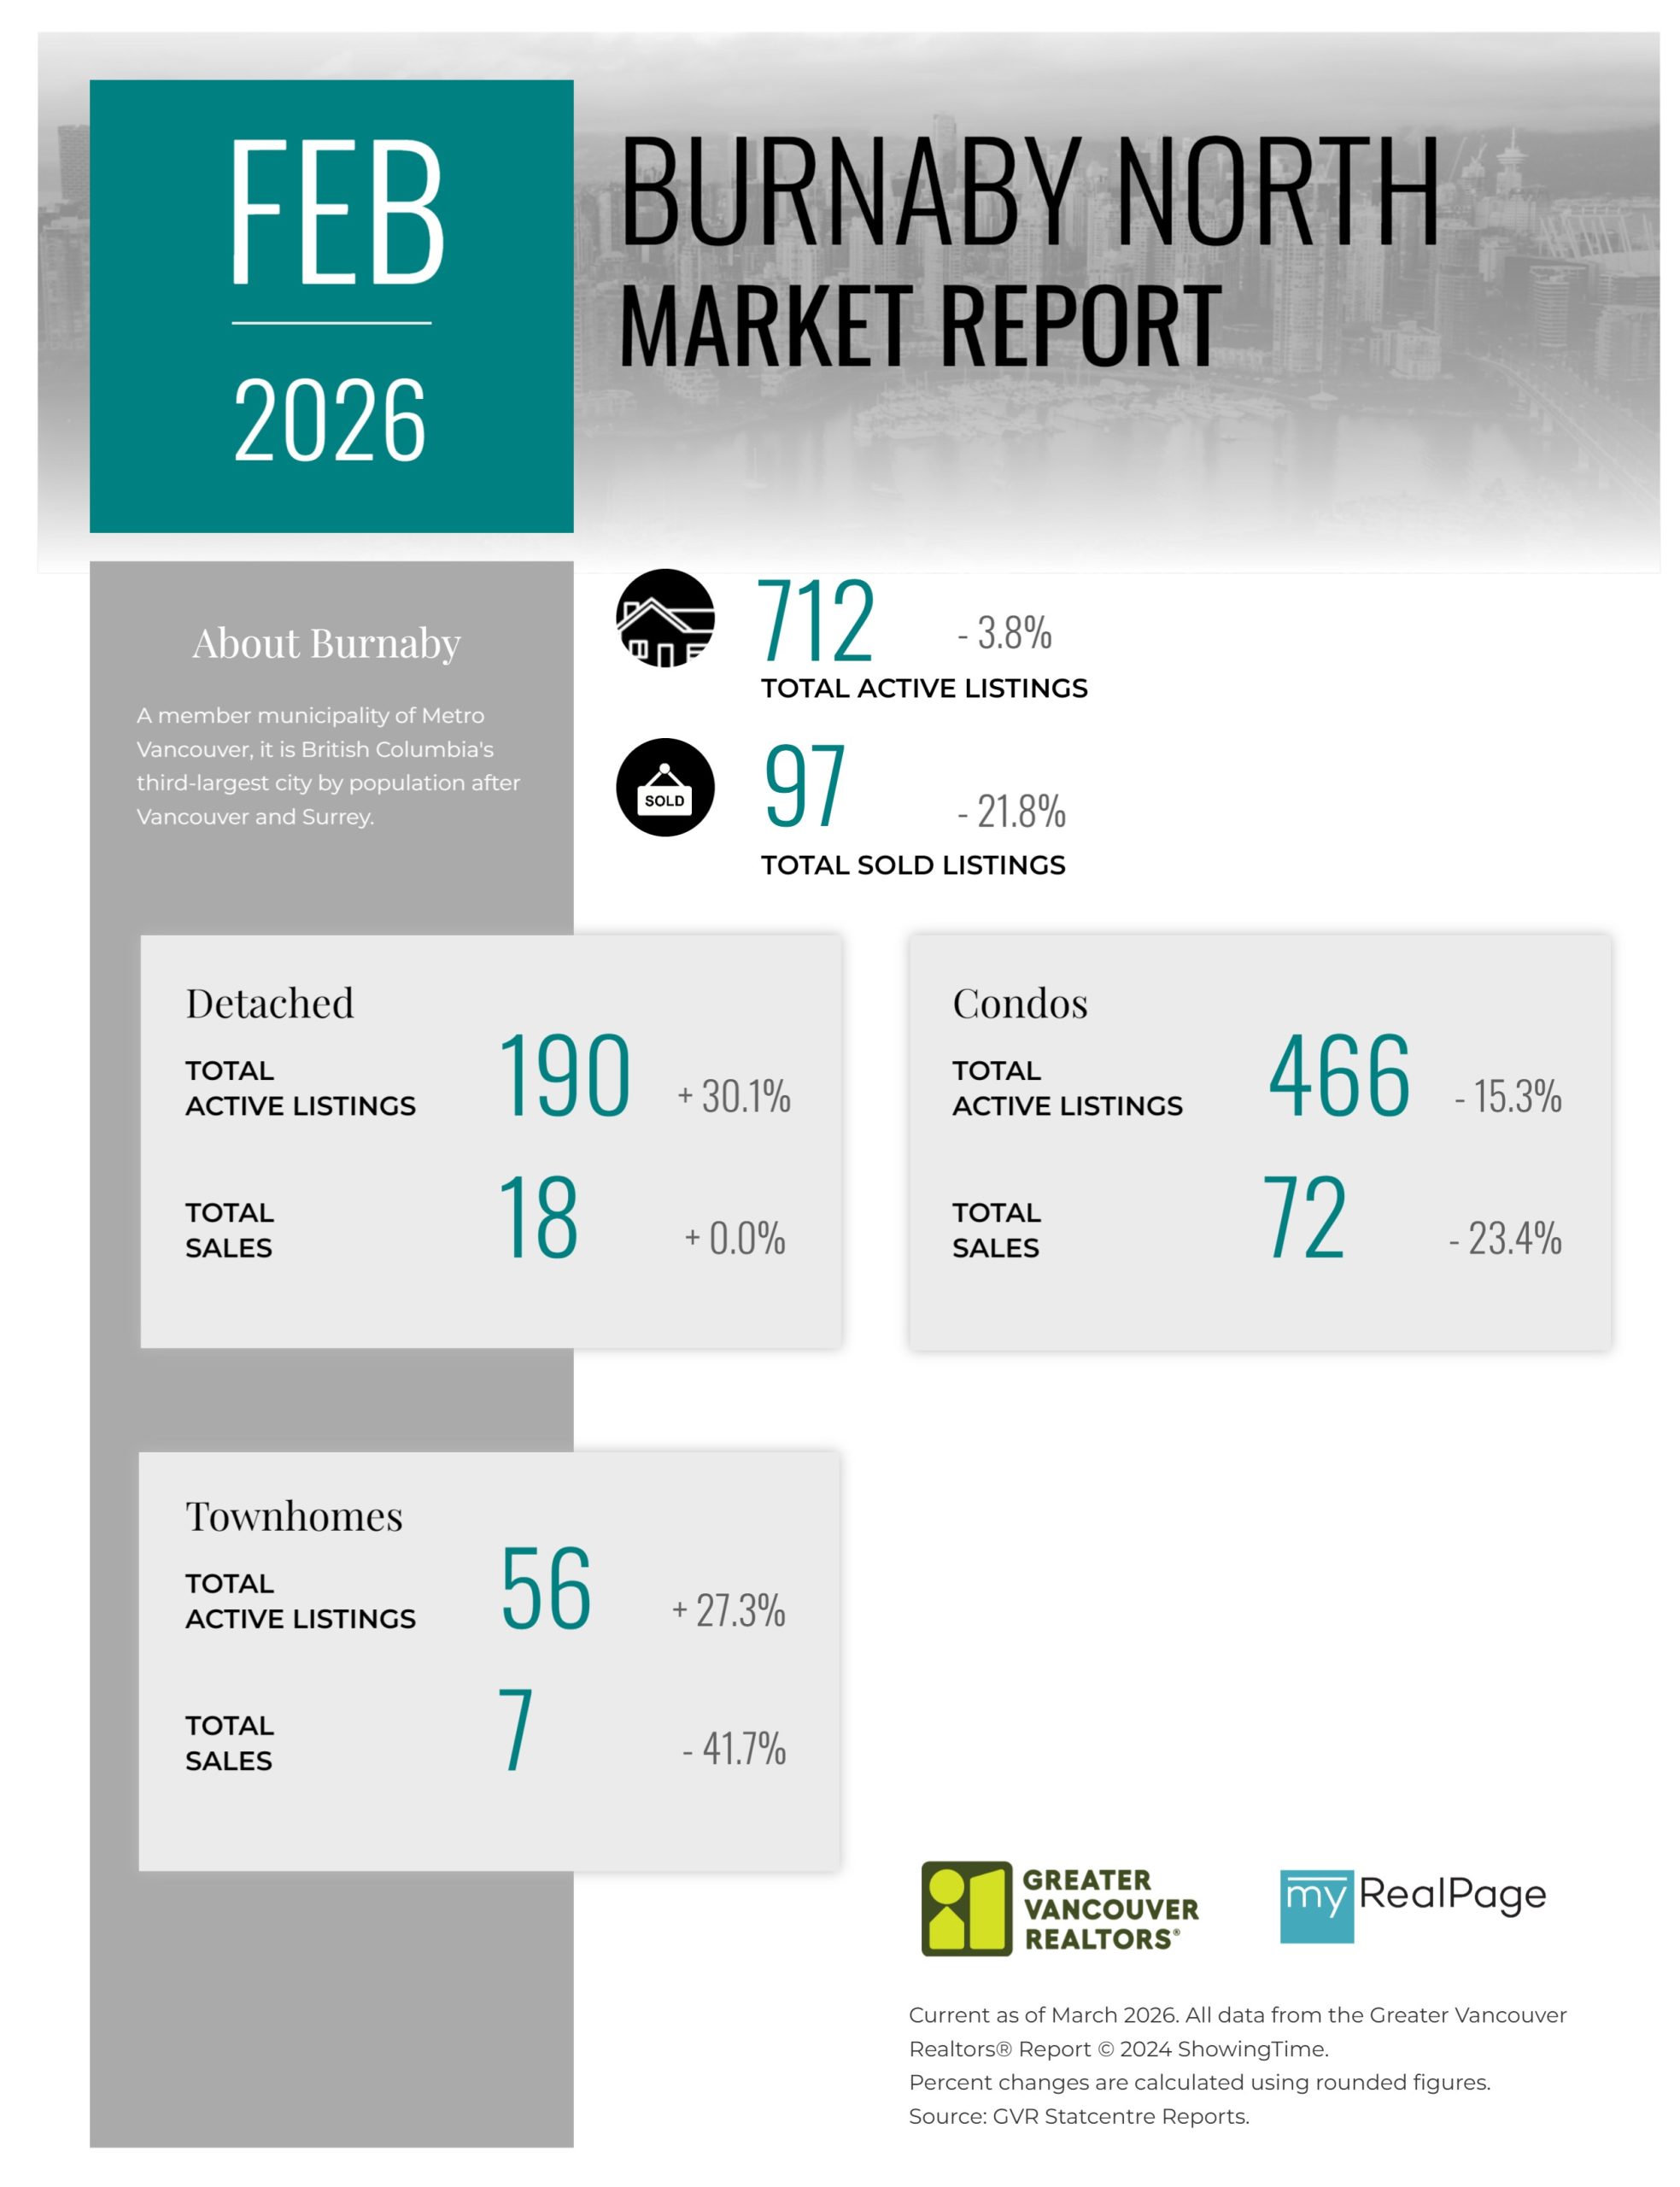
Printable Version – GVR February 2026 Data Infographic Report Burnaby North
Printable Version – GVR February 2026 Data Infographics Report Burnaby South
Printable Version – GVR February 2026 Data Infographics Report Burnaby East
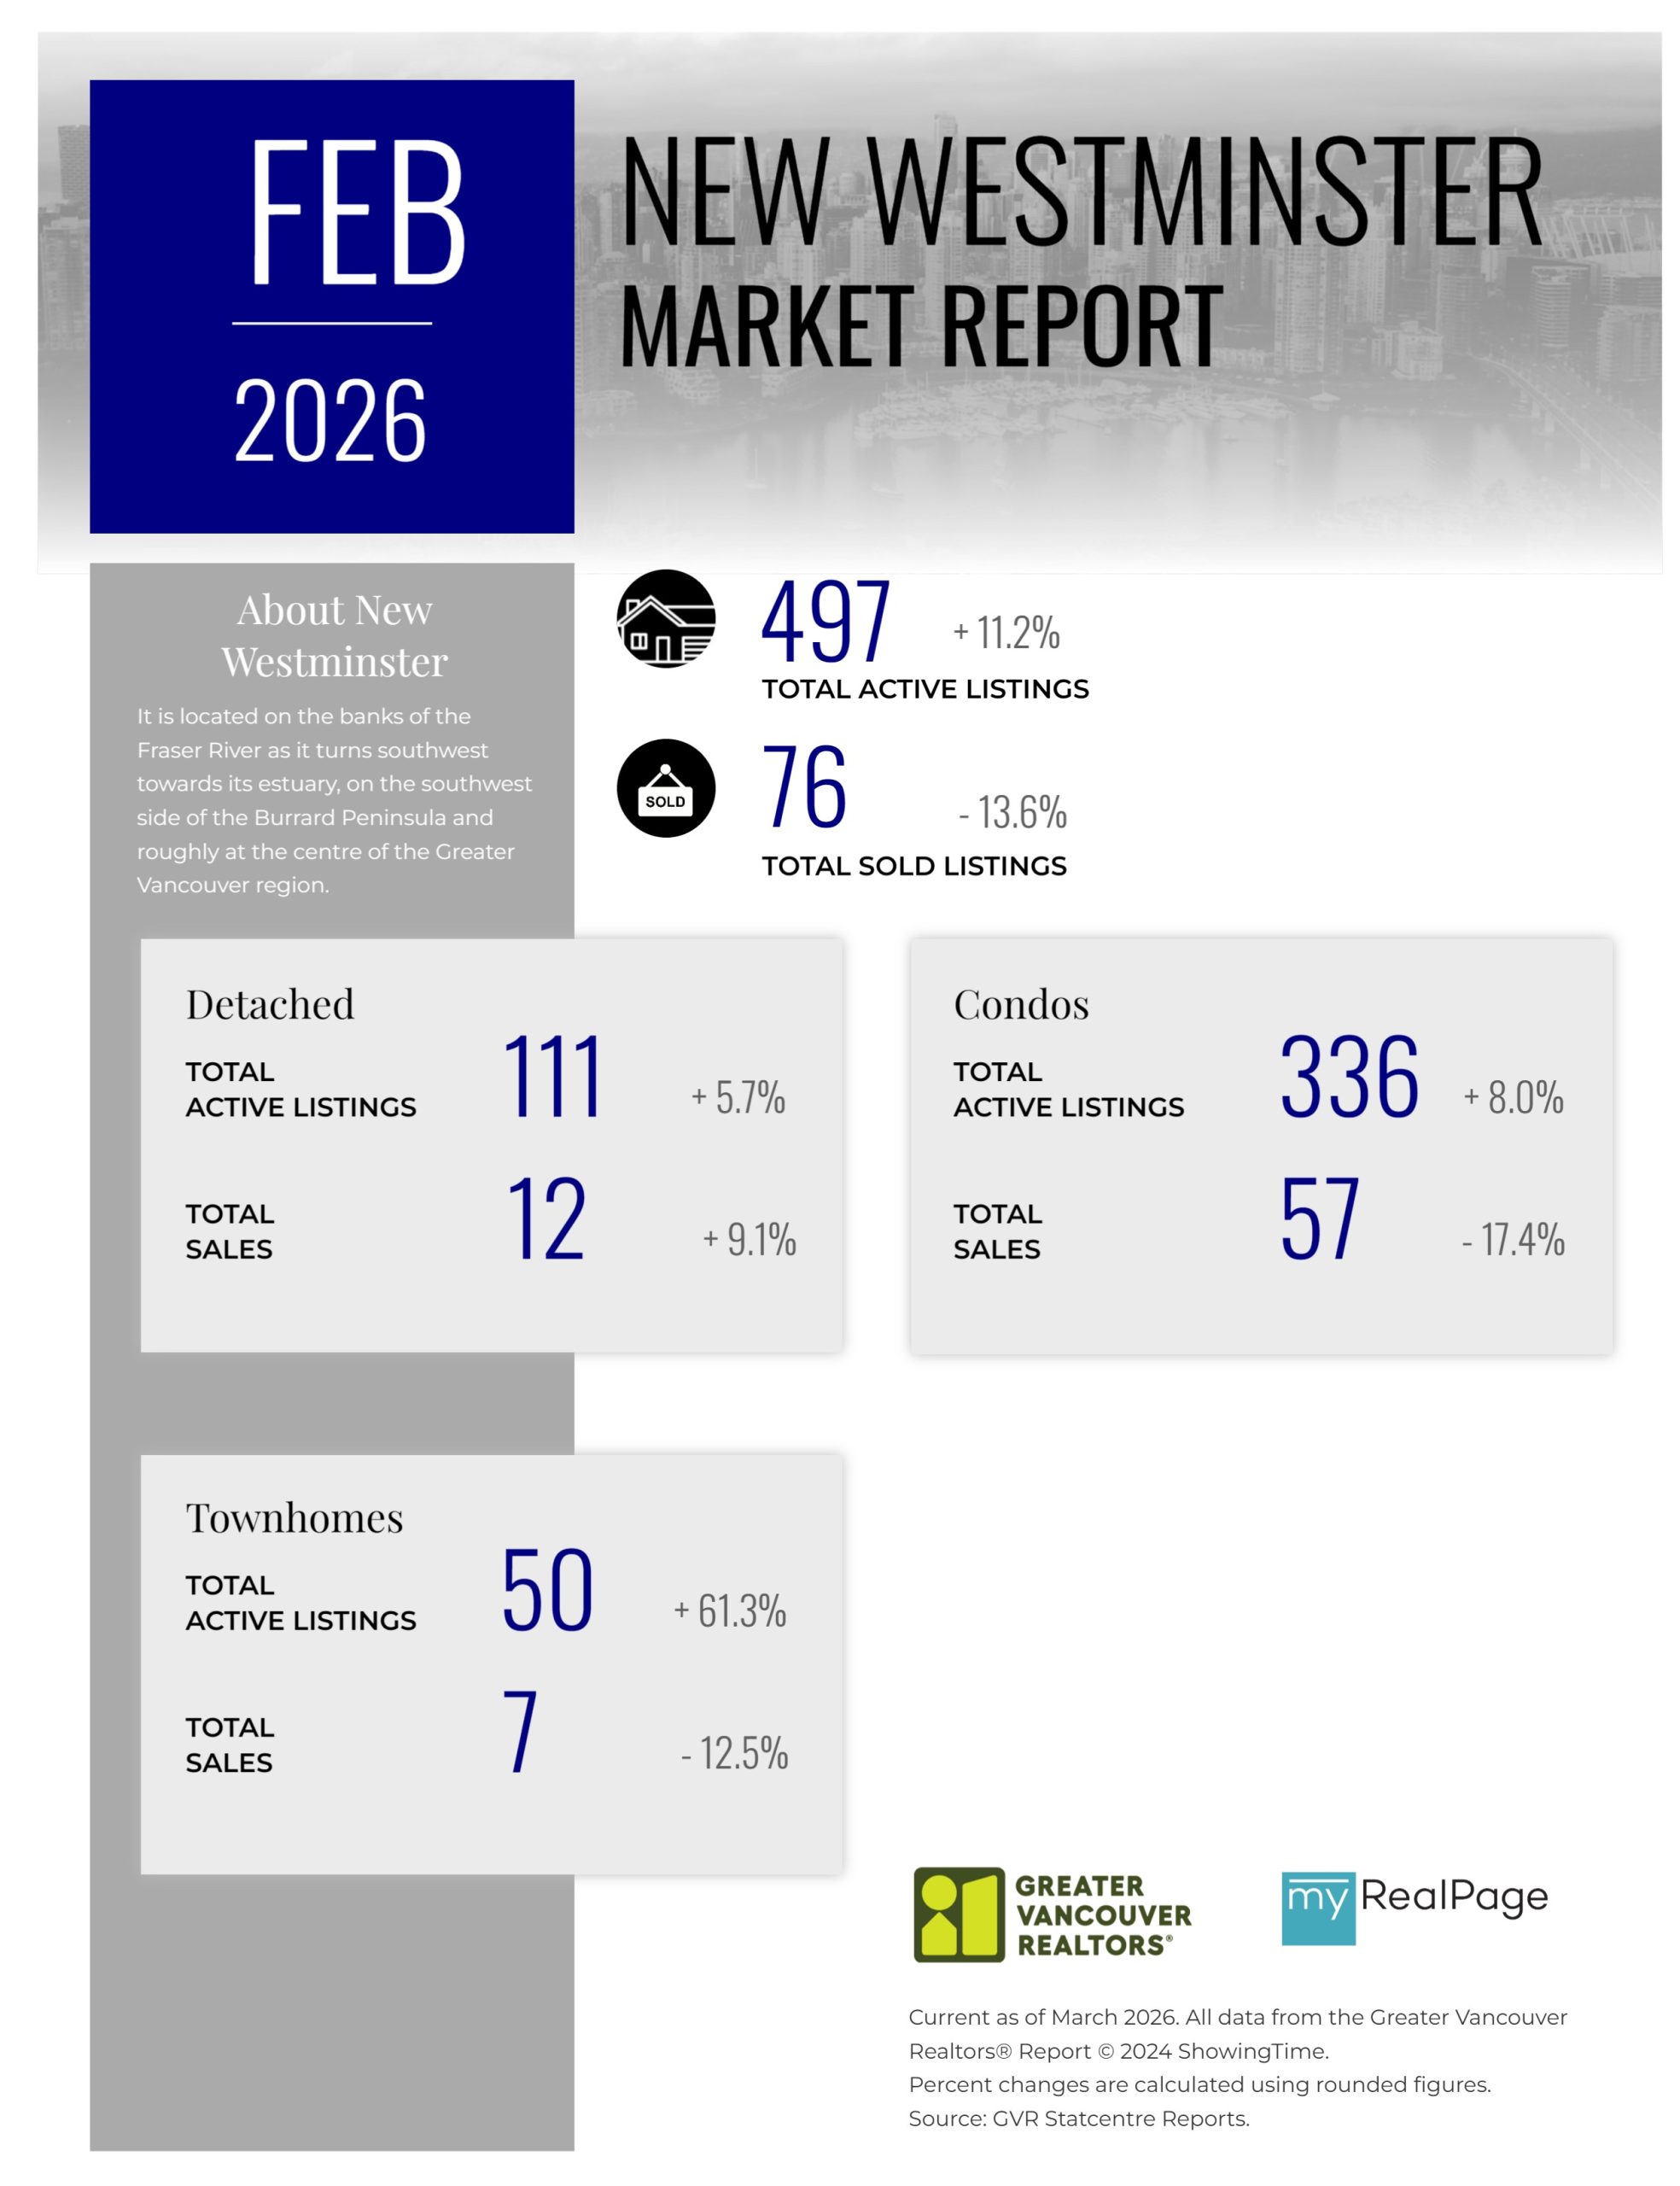
Printable Version – GVR February 2026 Data Infographics Report New Westminster
Printable Version – GVR February 2026 Data Infographics Report Richmond
Printable Version – GVR February 2026 Data Infographics Report Squamish


INFOGRAPHICS: January 2026 GVR Greater Vancouver Market Reports
New year, same housing market in Metro Vancouver
Last year’s market trends continued in January as home sales registered on the MLS® in Metro Vancouver* were 28.5 per cent lower than last year, setting the year off to a quieter start.
The Greater Vancouver REALTORS® (GVR) reports that residential sales in the region totalled 1,107 in January 2026, a 28.7 per cent decrease from the 1,552 sales recorded in January 2025. This was 30.9 per cent below the 10-year seasonal average (1,602).
“On their own, the January sales appear alarming, but it’s important to put these figures in the context of the past few years. Last year ended with one of the lowest sales totals in over two decades, and so it’s not surprising that the January sales figures were fourth slowest in over two decades as well. Market momentum is a slowly evolving force, and in many ways, the January figures represent a market that continues slowly evolving to what may be a new normal.” Andrew Lis, GVR chief economist and vice-president data analytics
Read the full report on the REBGV website!
The following data is a comparison between January 2026 and January 2025 numbers, and is current as of February of 2026. For last month’s update, you can check out our previous post!
Or follow this link for all our GVR Infographics!
These infographics cover current trends in several areas within the Greater Vancouver region. Click on the images for a larger view!
Printable Version – GVR January 2026 Data Infographic Report North Vancouver
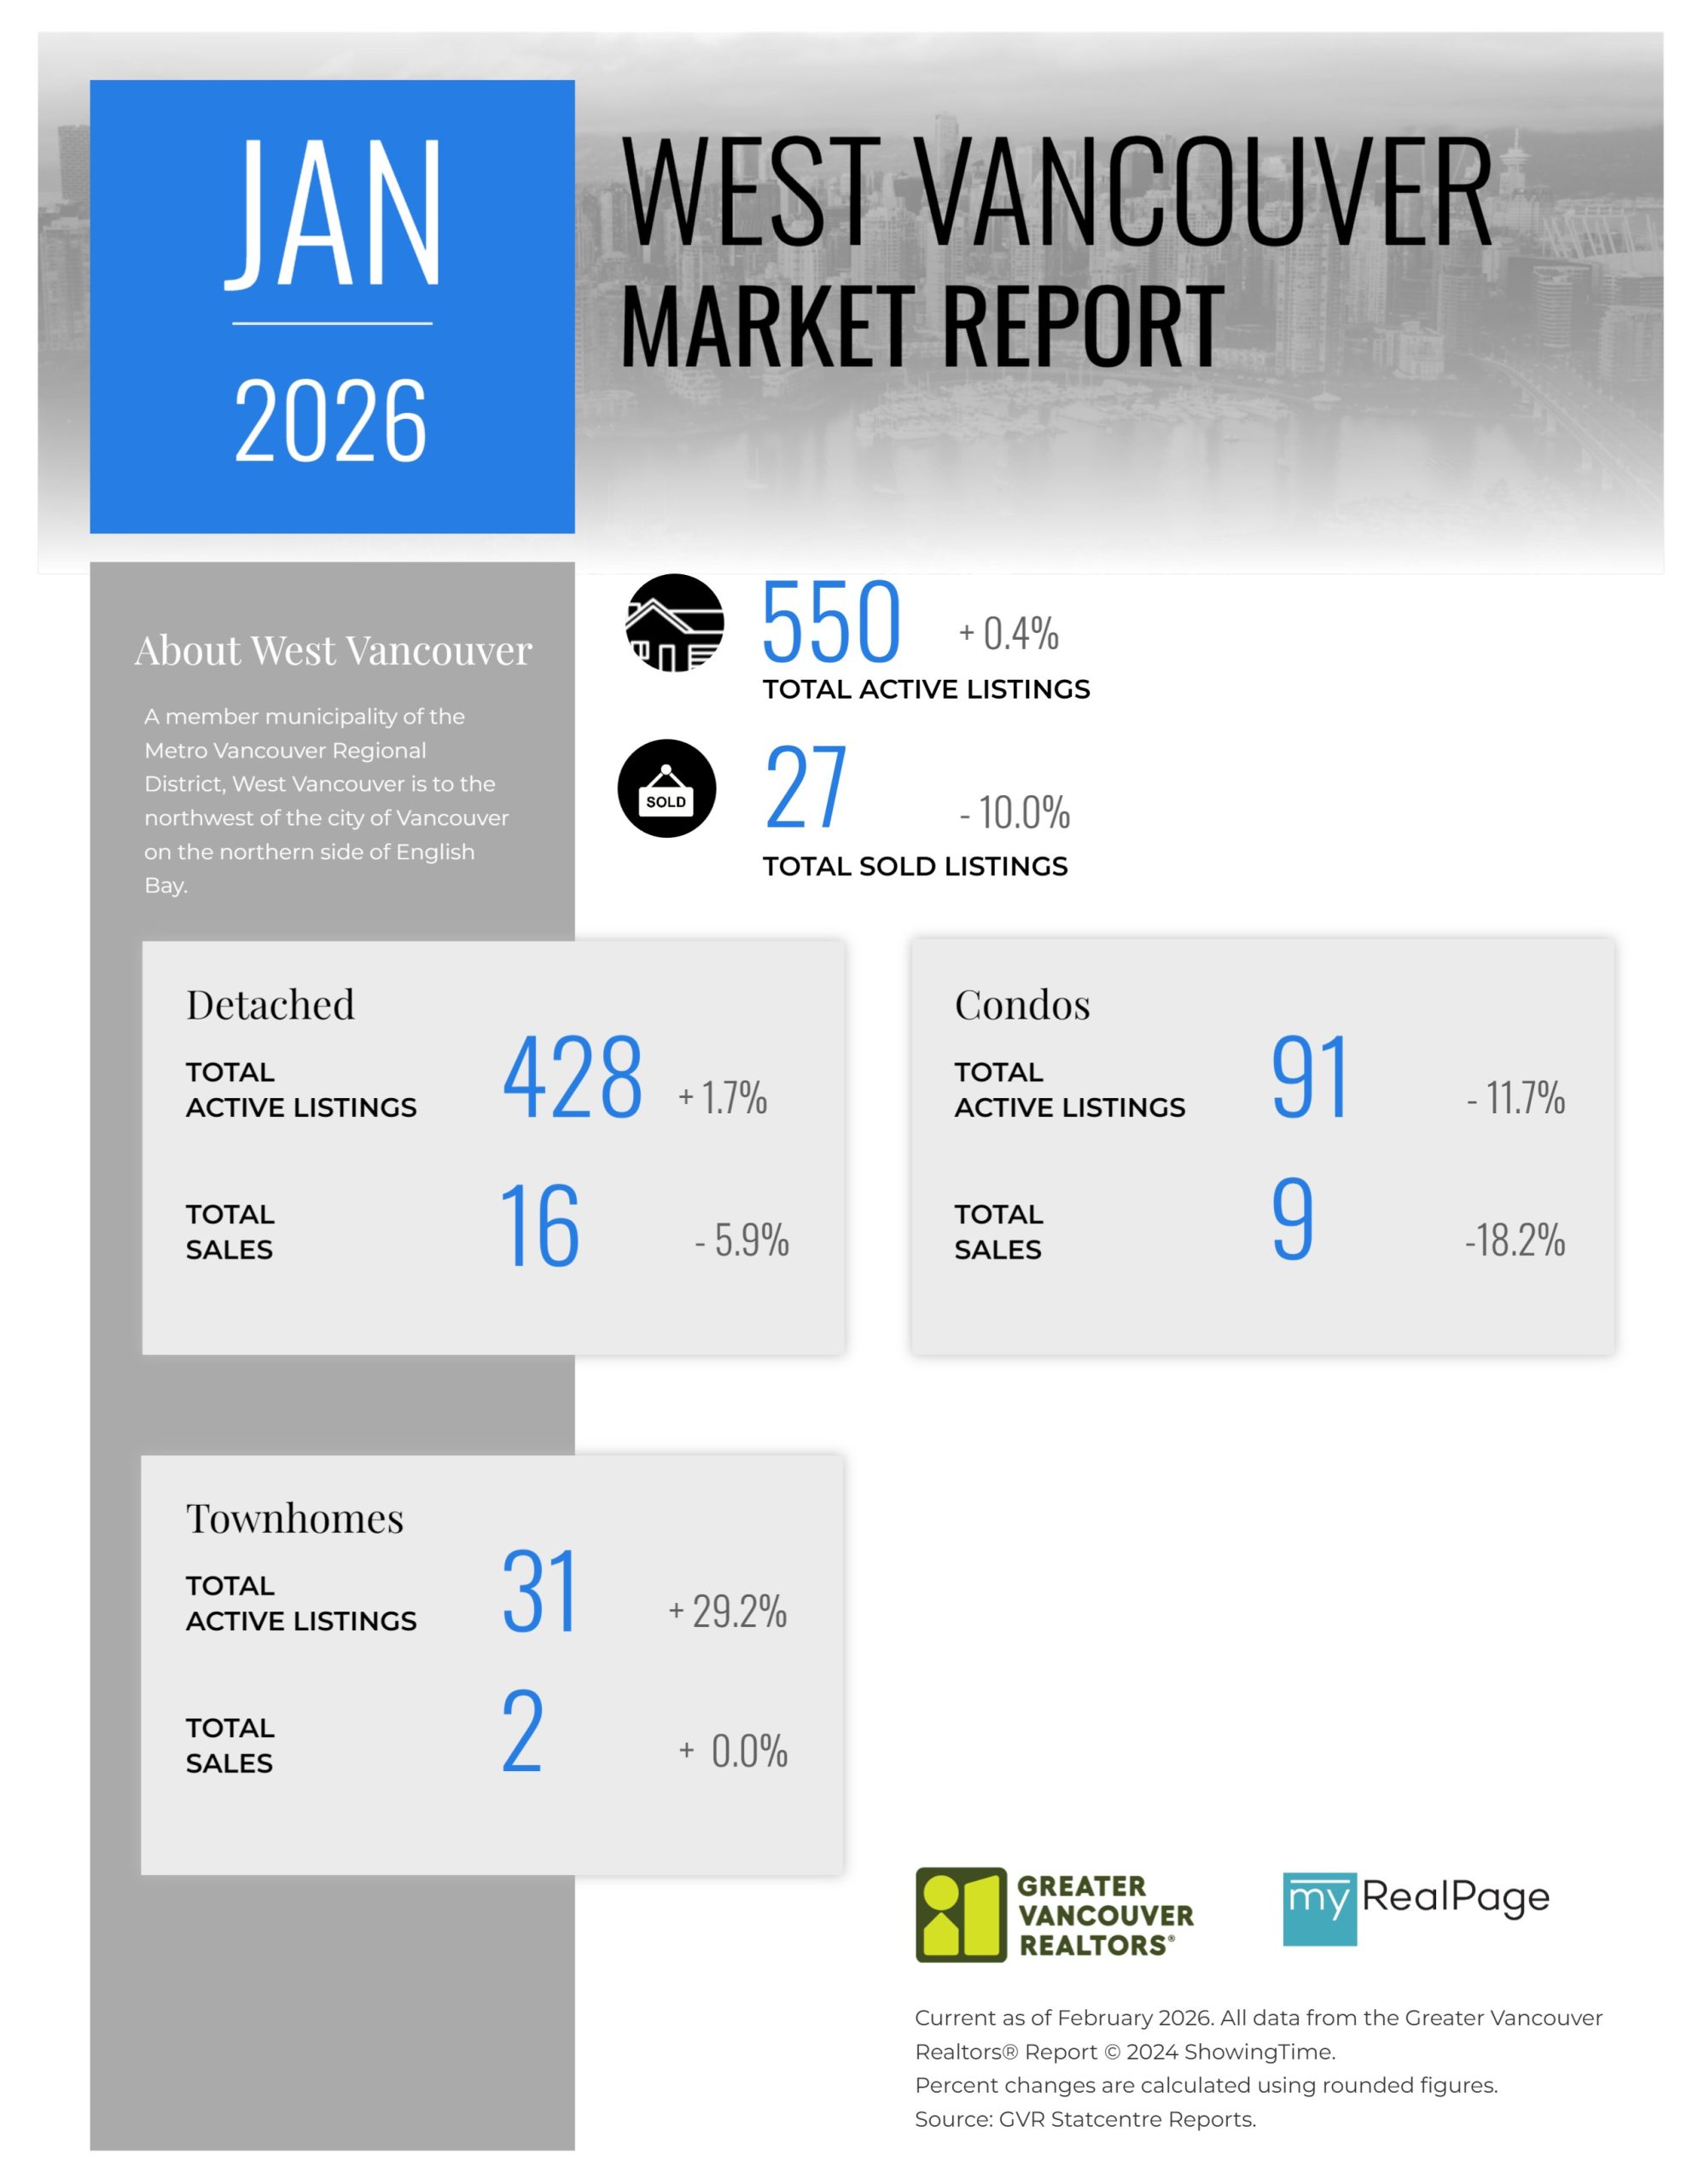
Printable Version – GVR January 2026 Data Infographics Report West Vancouver
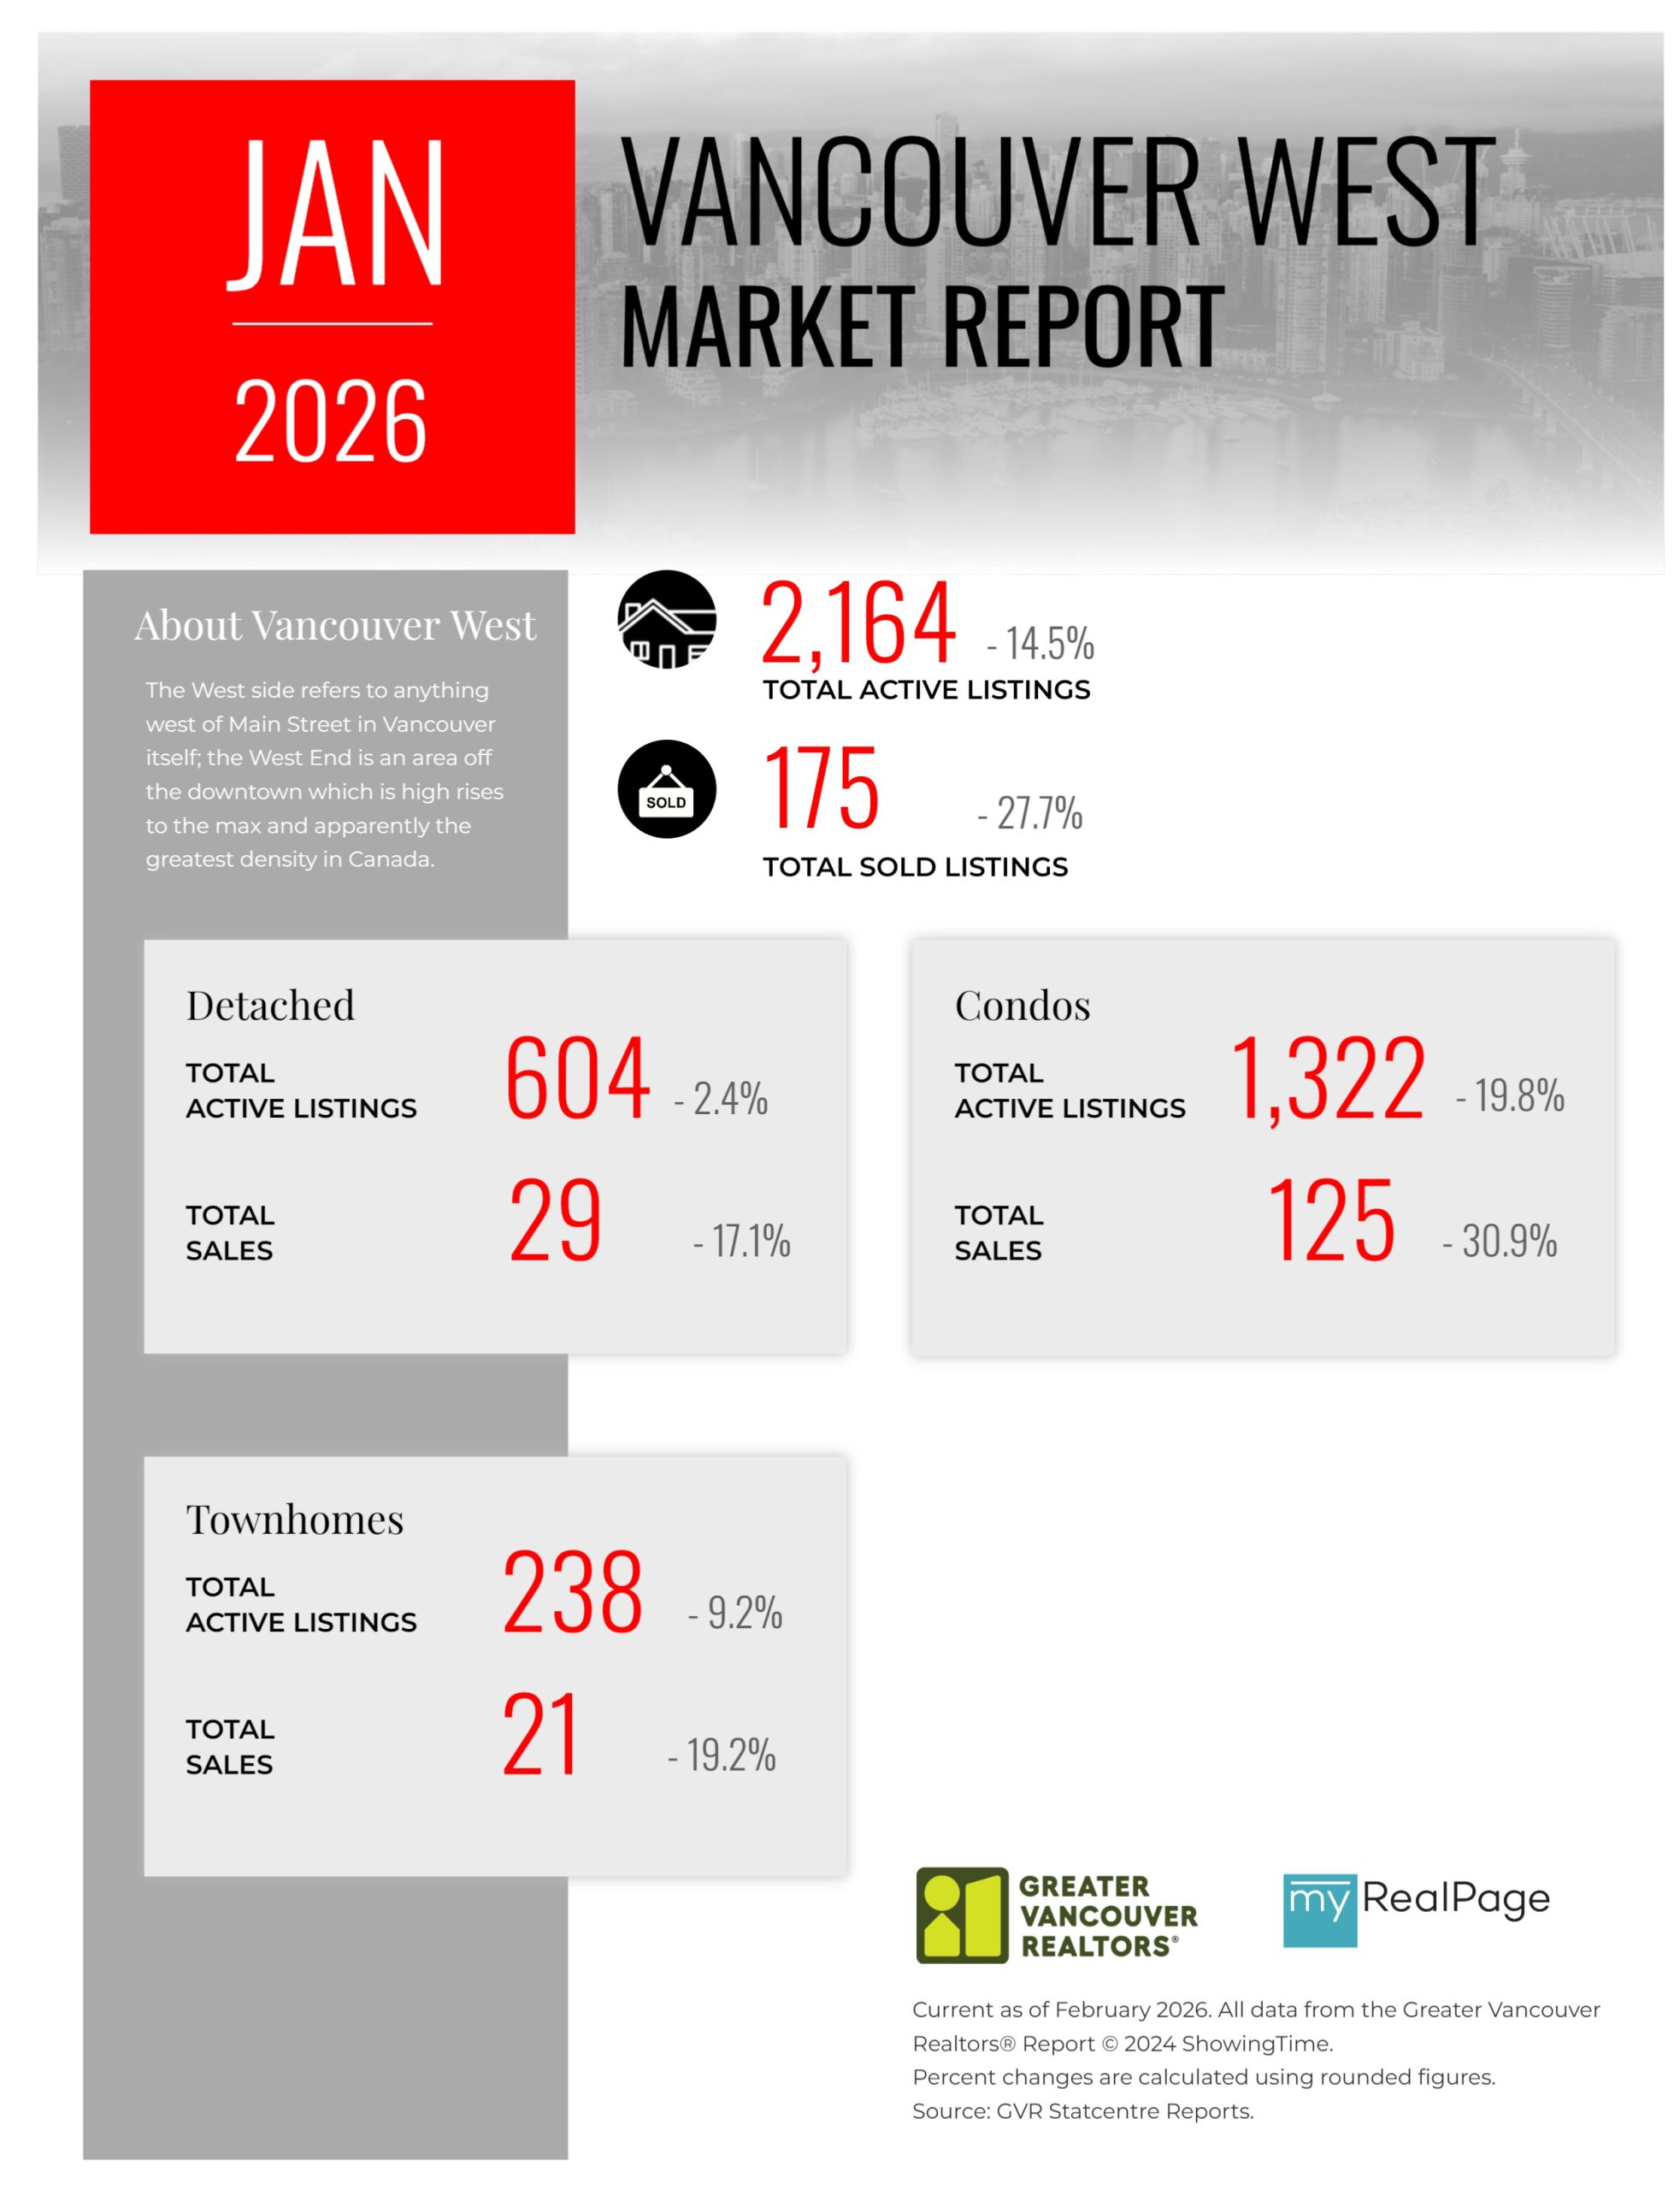
Printable Version – GVR January 2026 Data Infographics Report Vancouver West
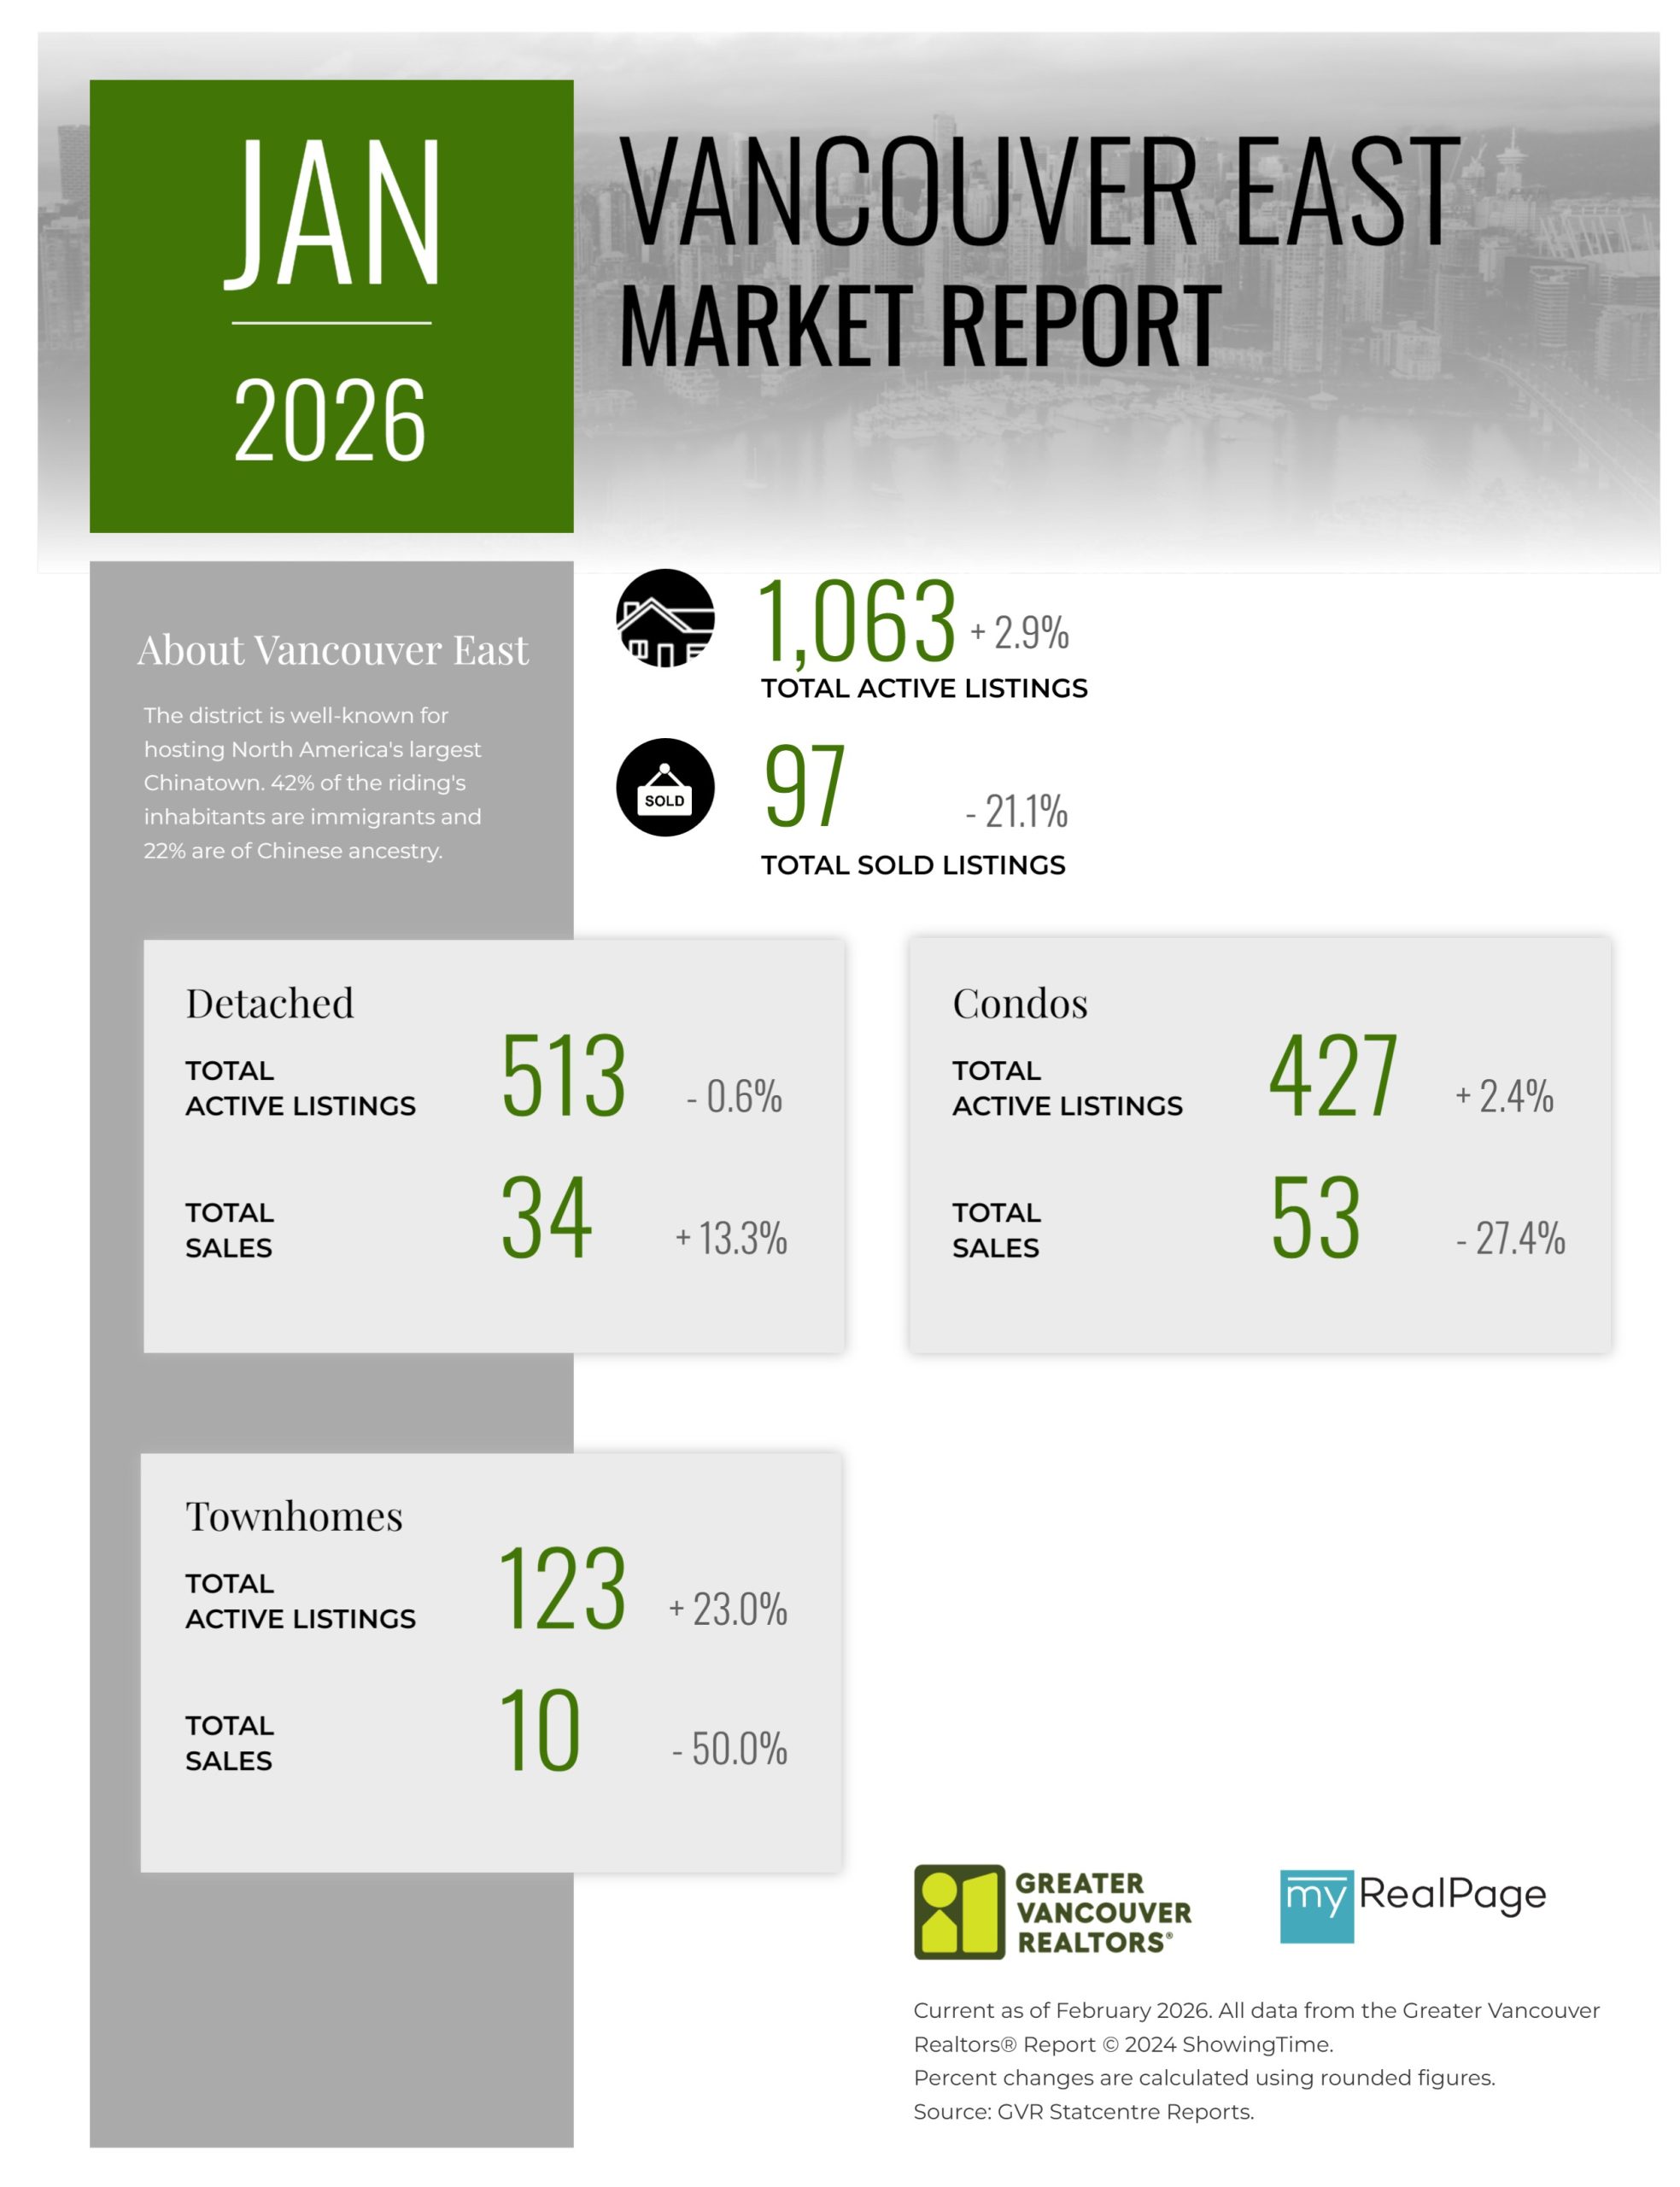
Printable Version – GVR January 2026 Data Infographics Report Vancouver East
Printable Version – GVR January 2026 Data Infographic Report Maple Ridge
Printable Version – GVR January 2026 Data Infographics Report Pitt Meadows
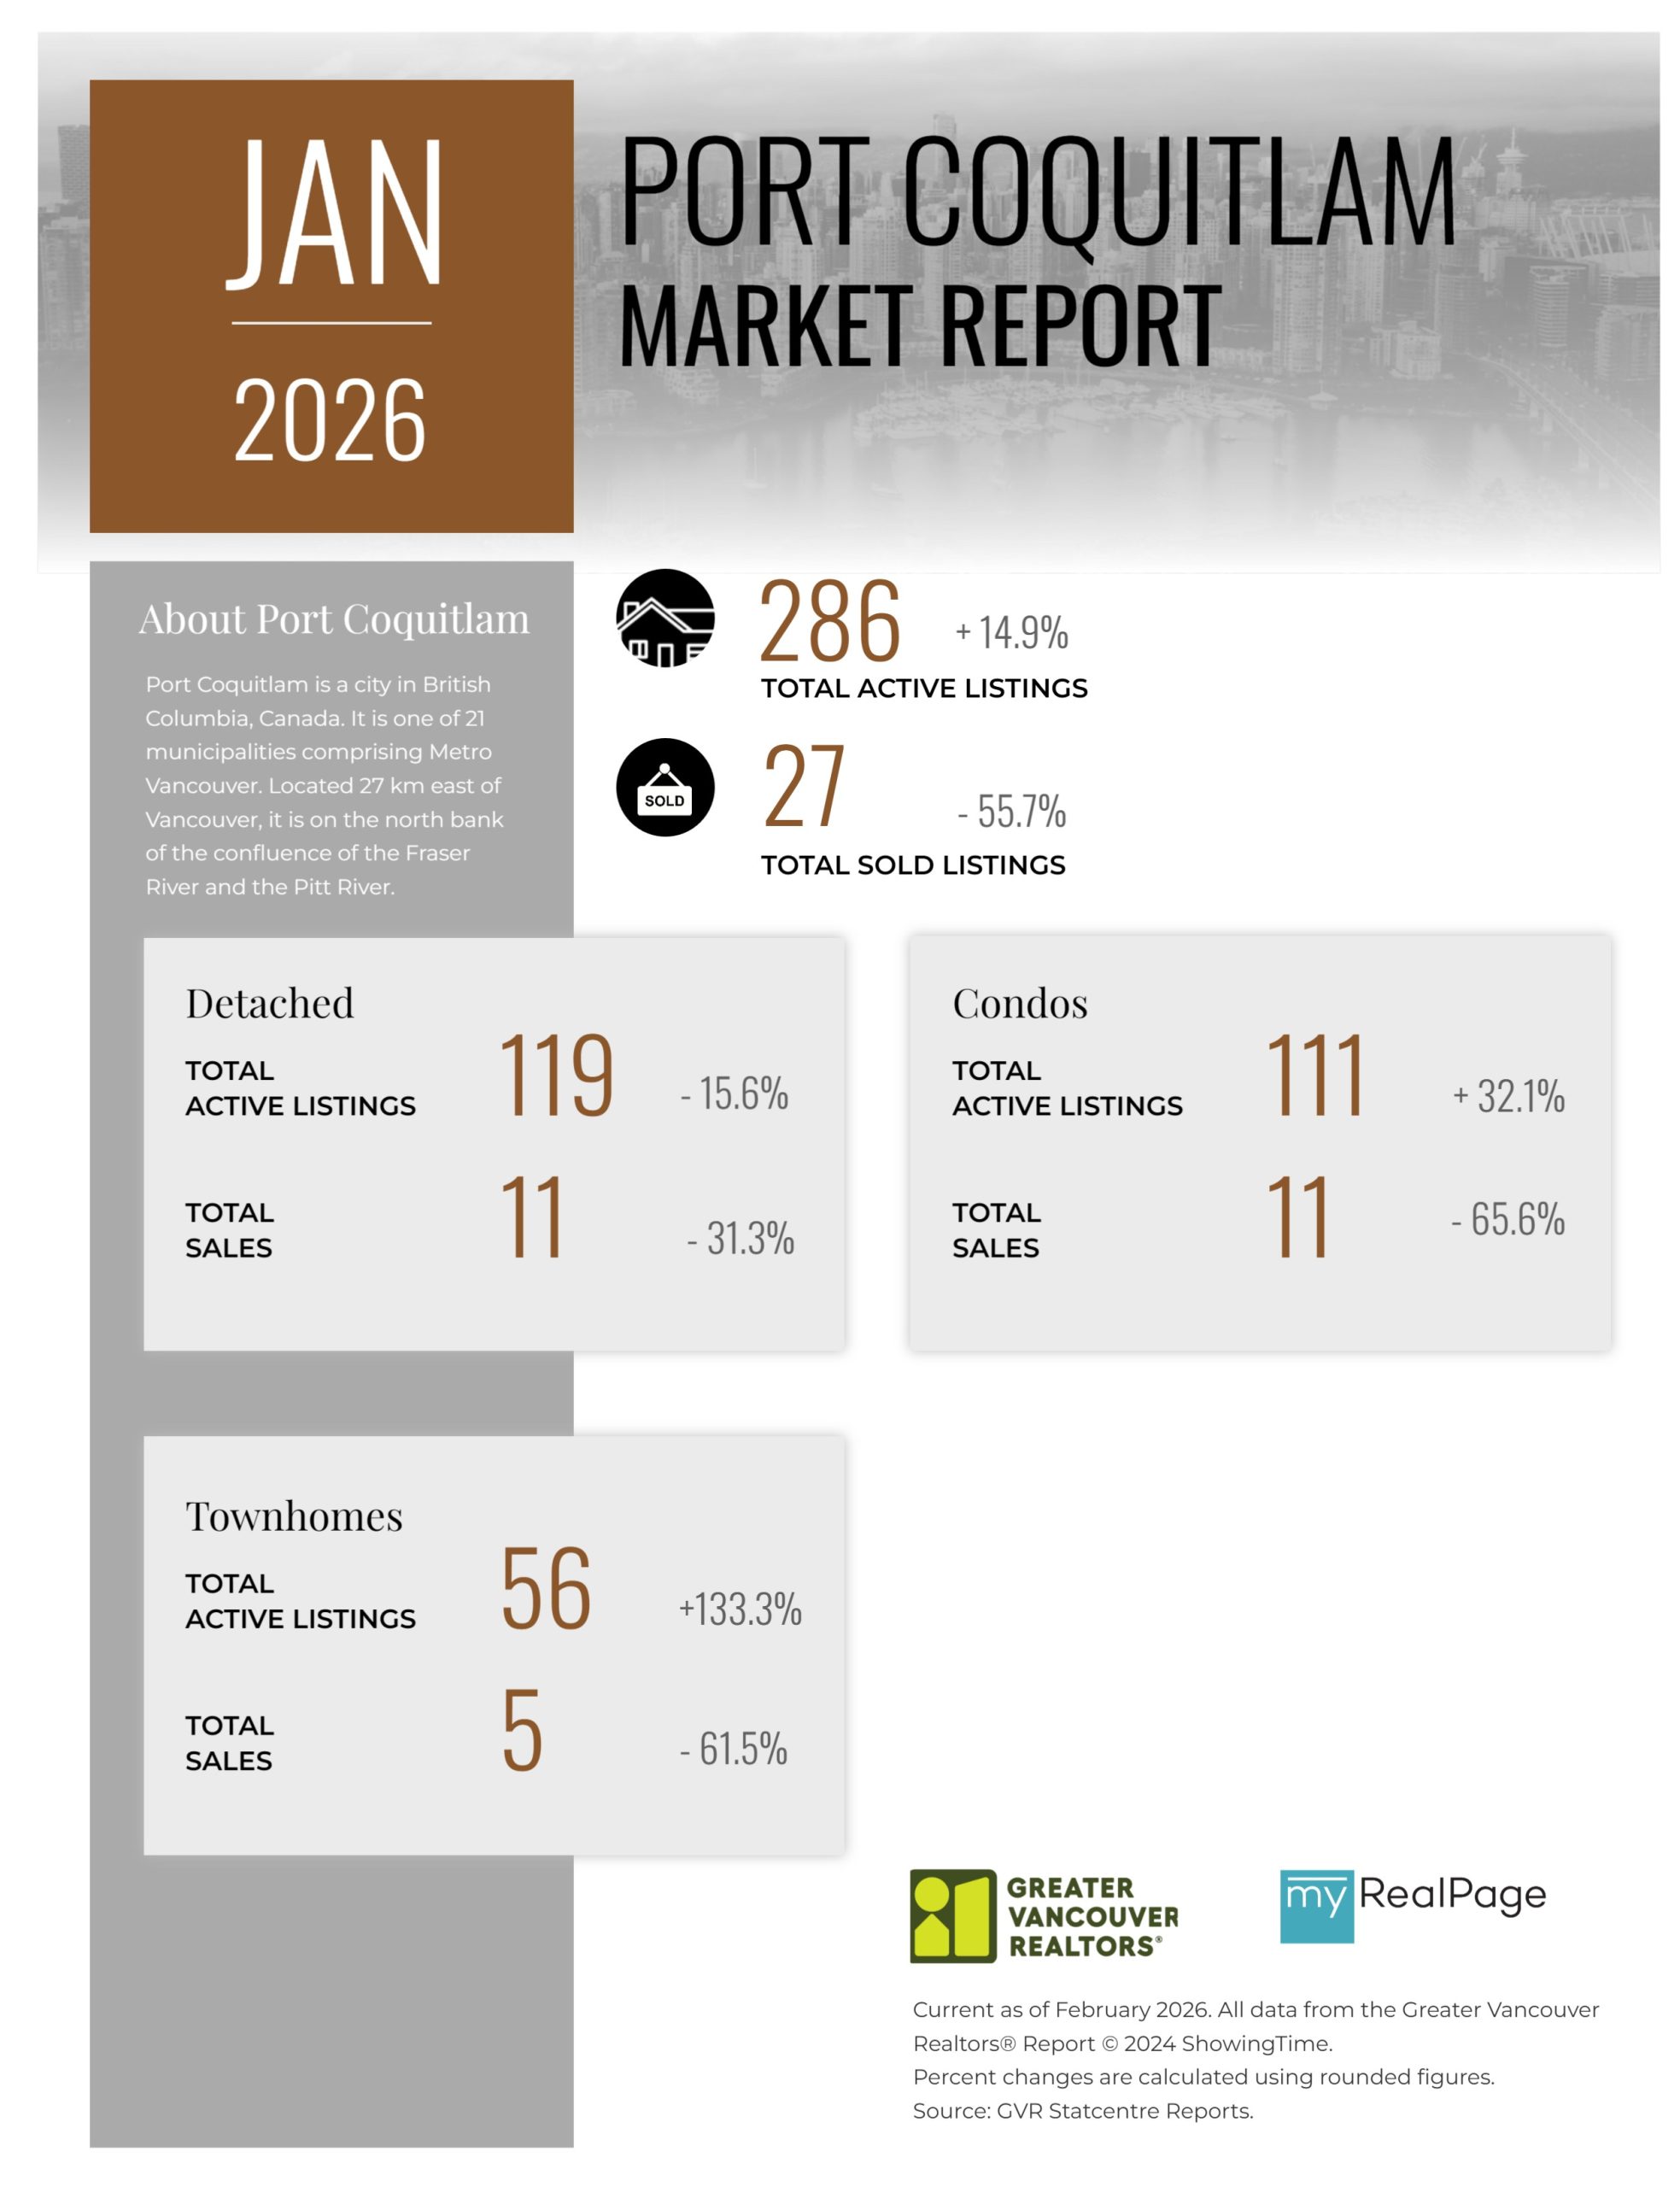
Printable Version – GVR January 2026 Data Infographics Report Port Coquitlam
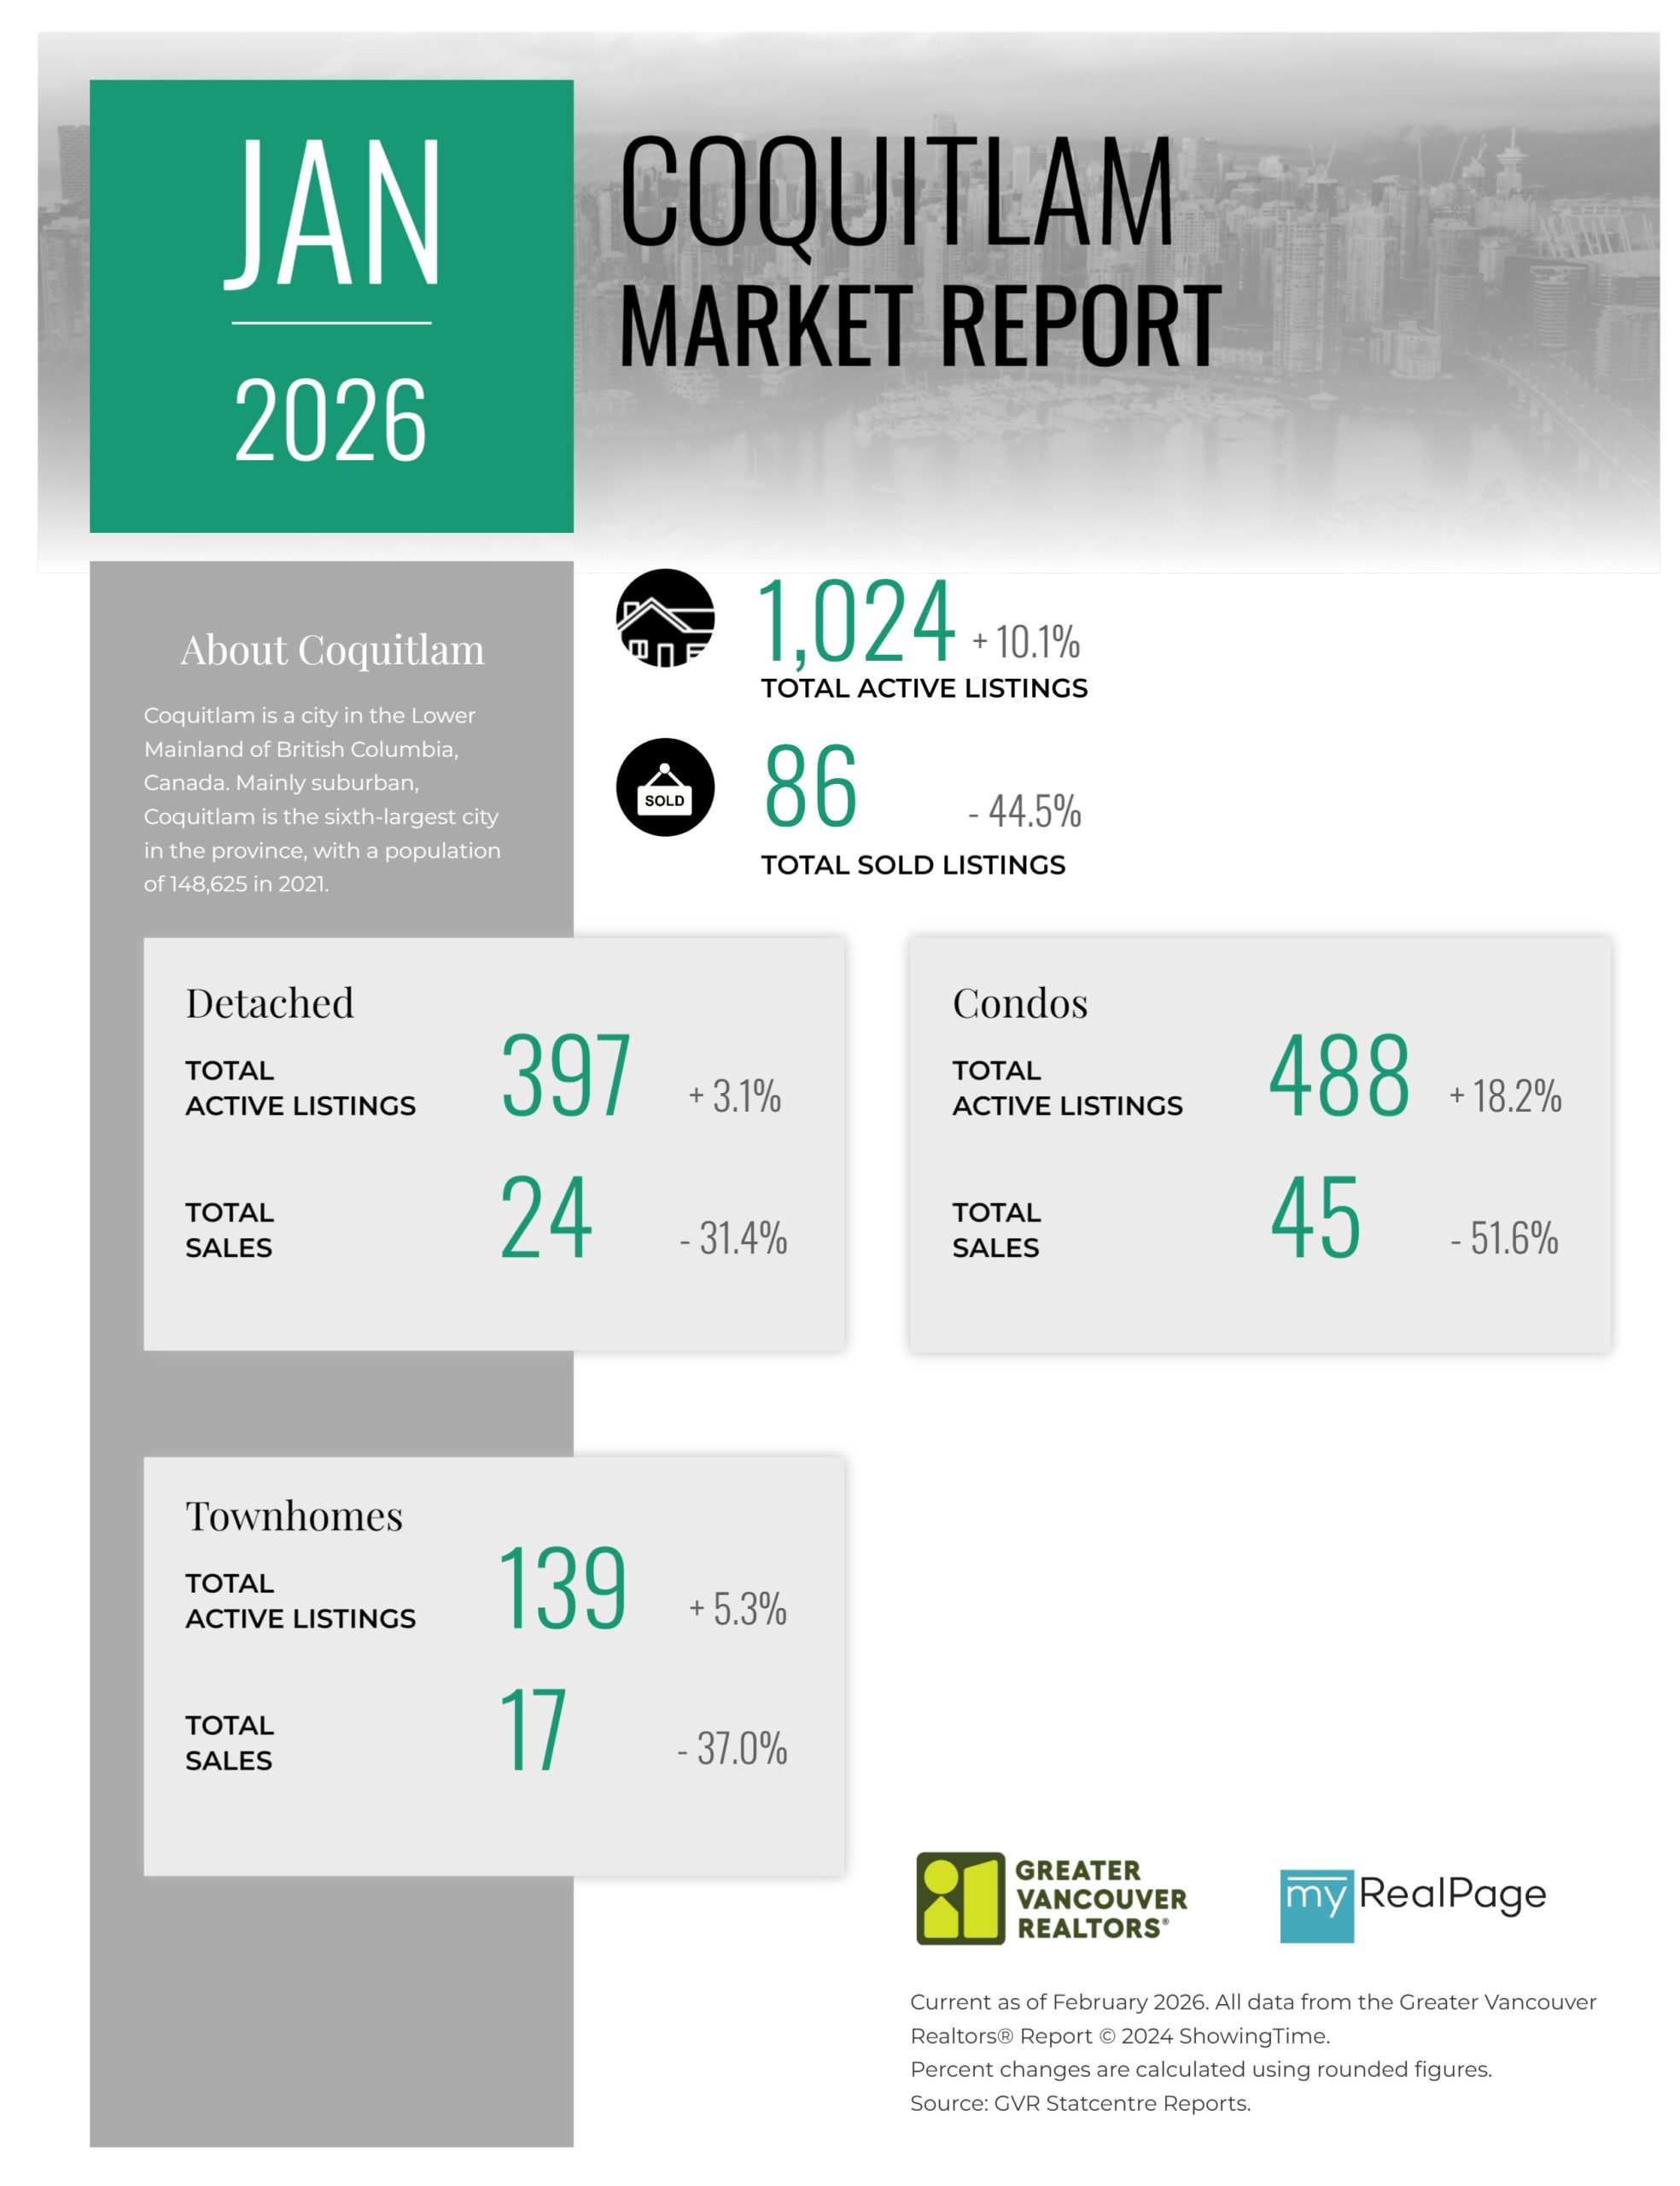
Printable Version – GVR January 2026 Data Infographics Report Coquitlam
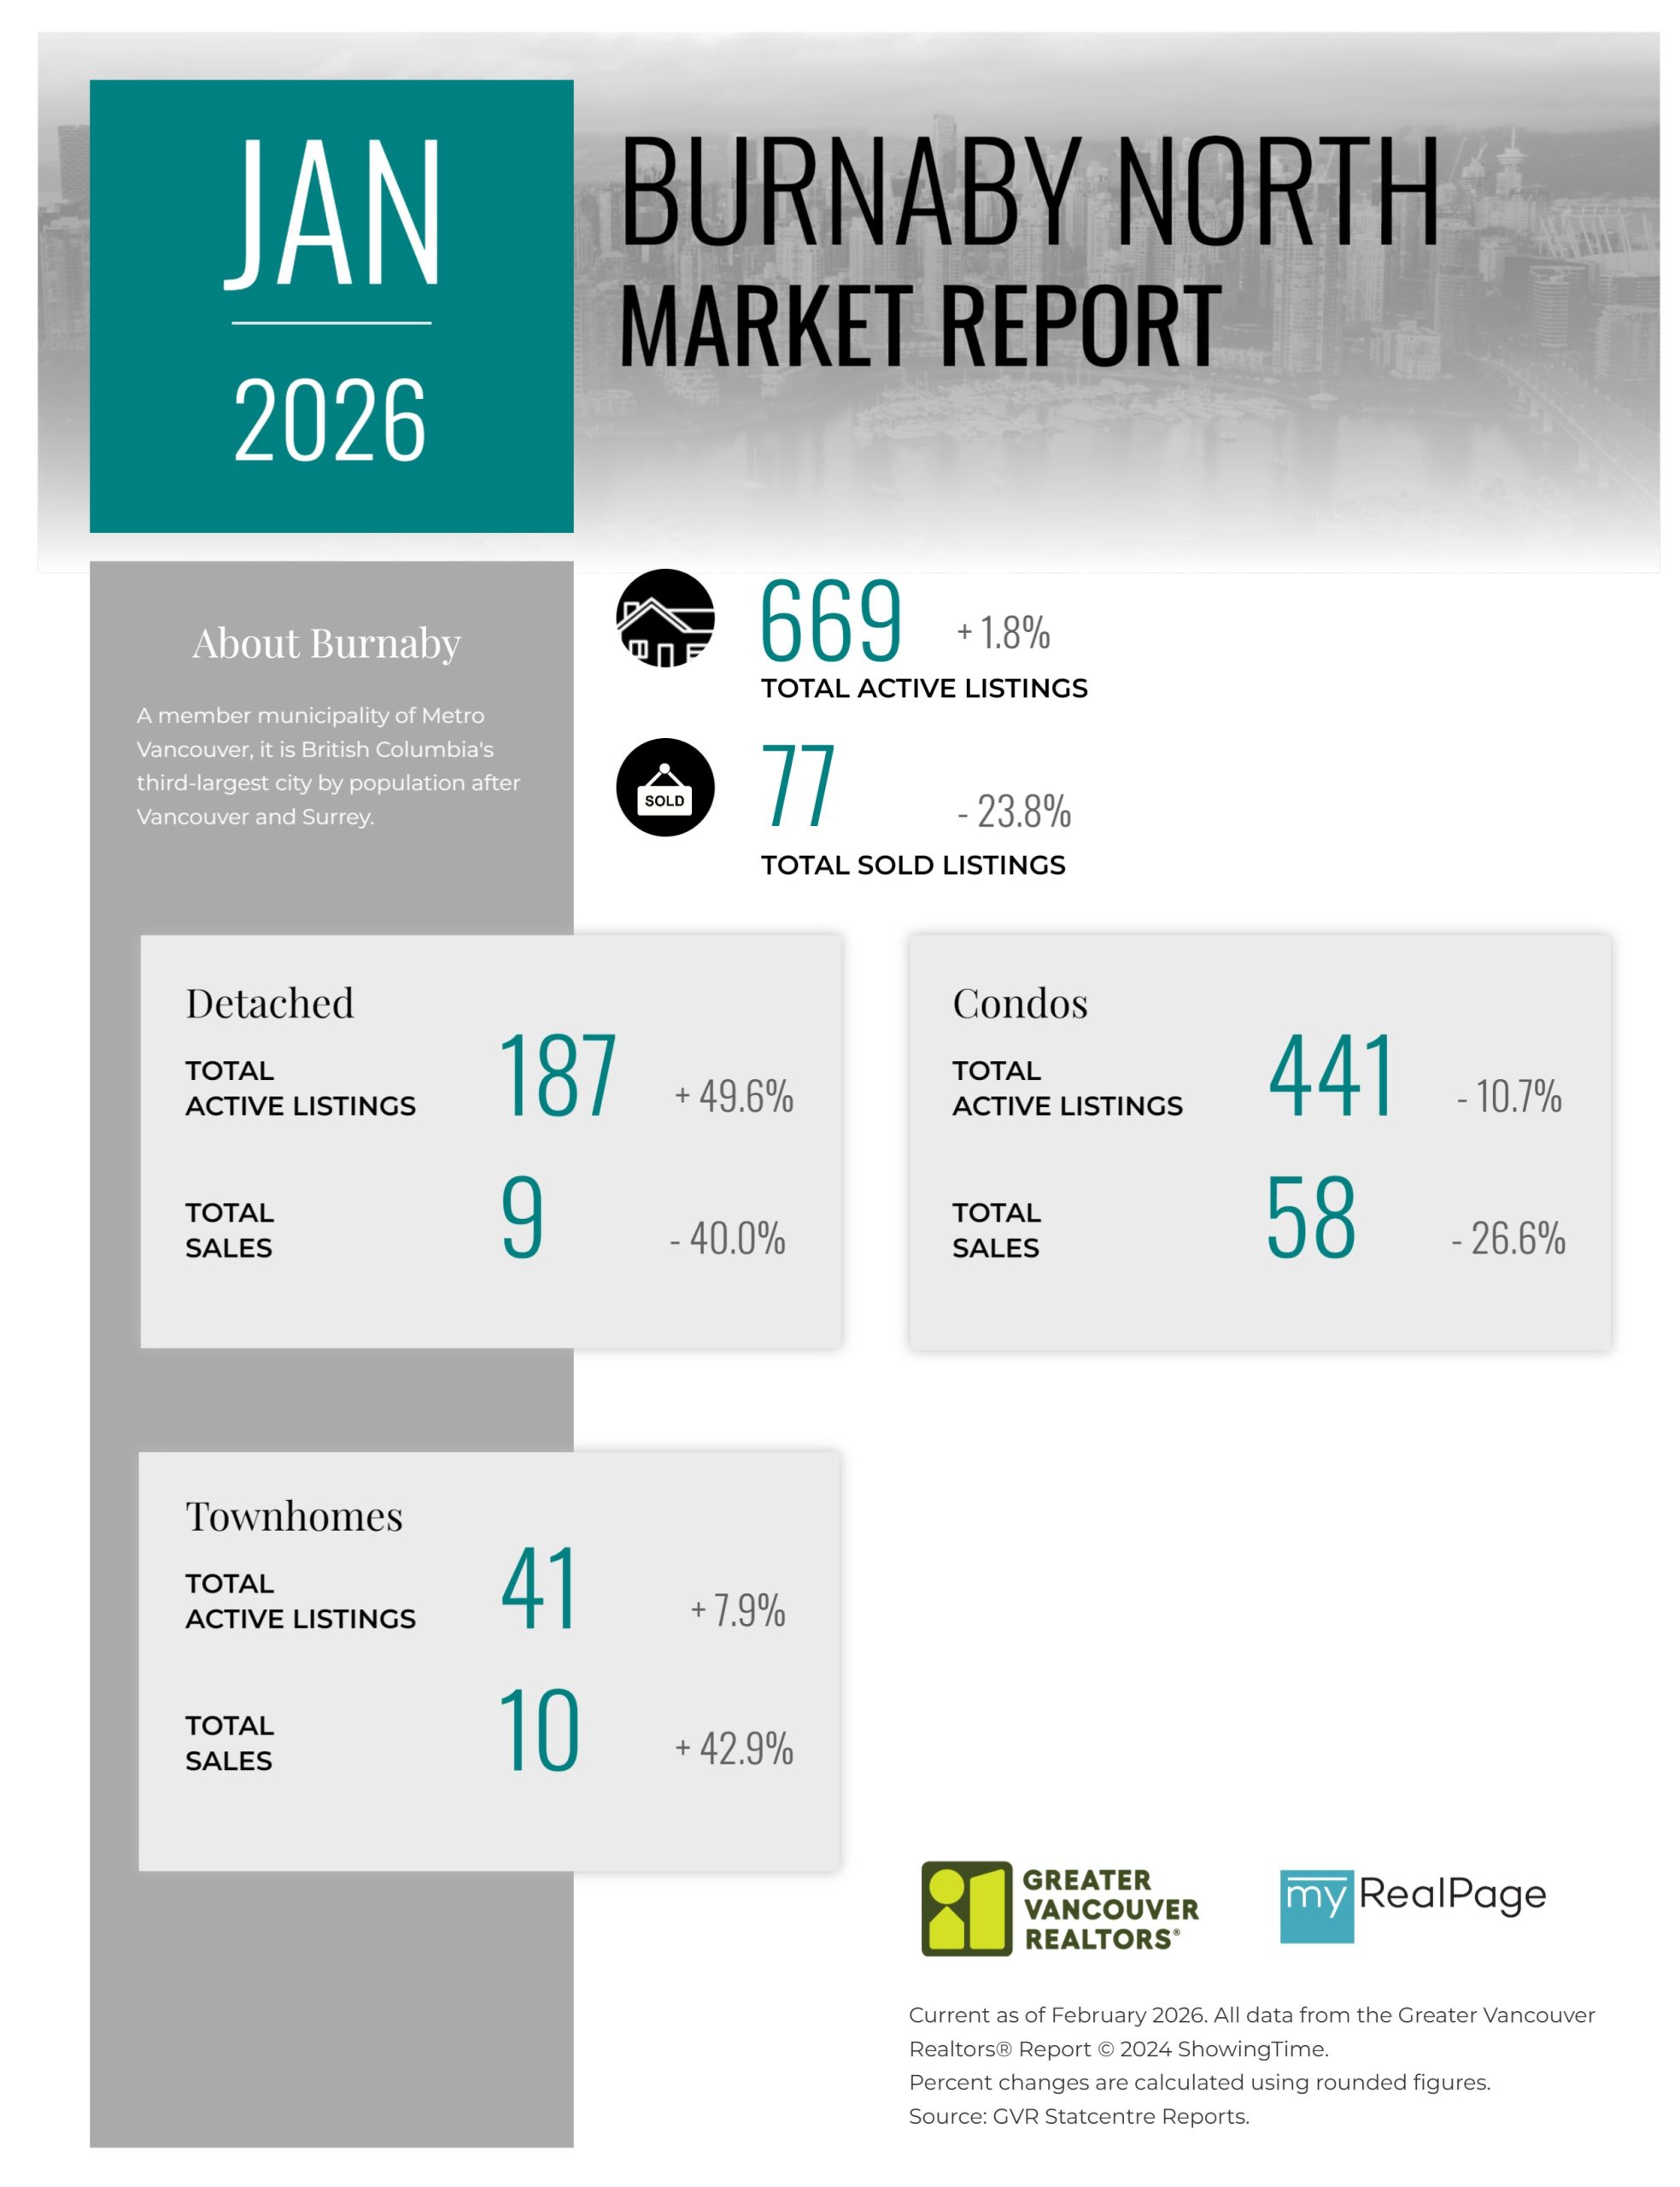
Printable Version – GVR January 2026 Data Infographic Report Burnaby North
Printable Version – GVR January 2026 Data Infographics Report Burnaby South
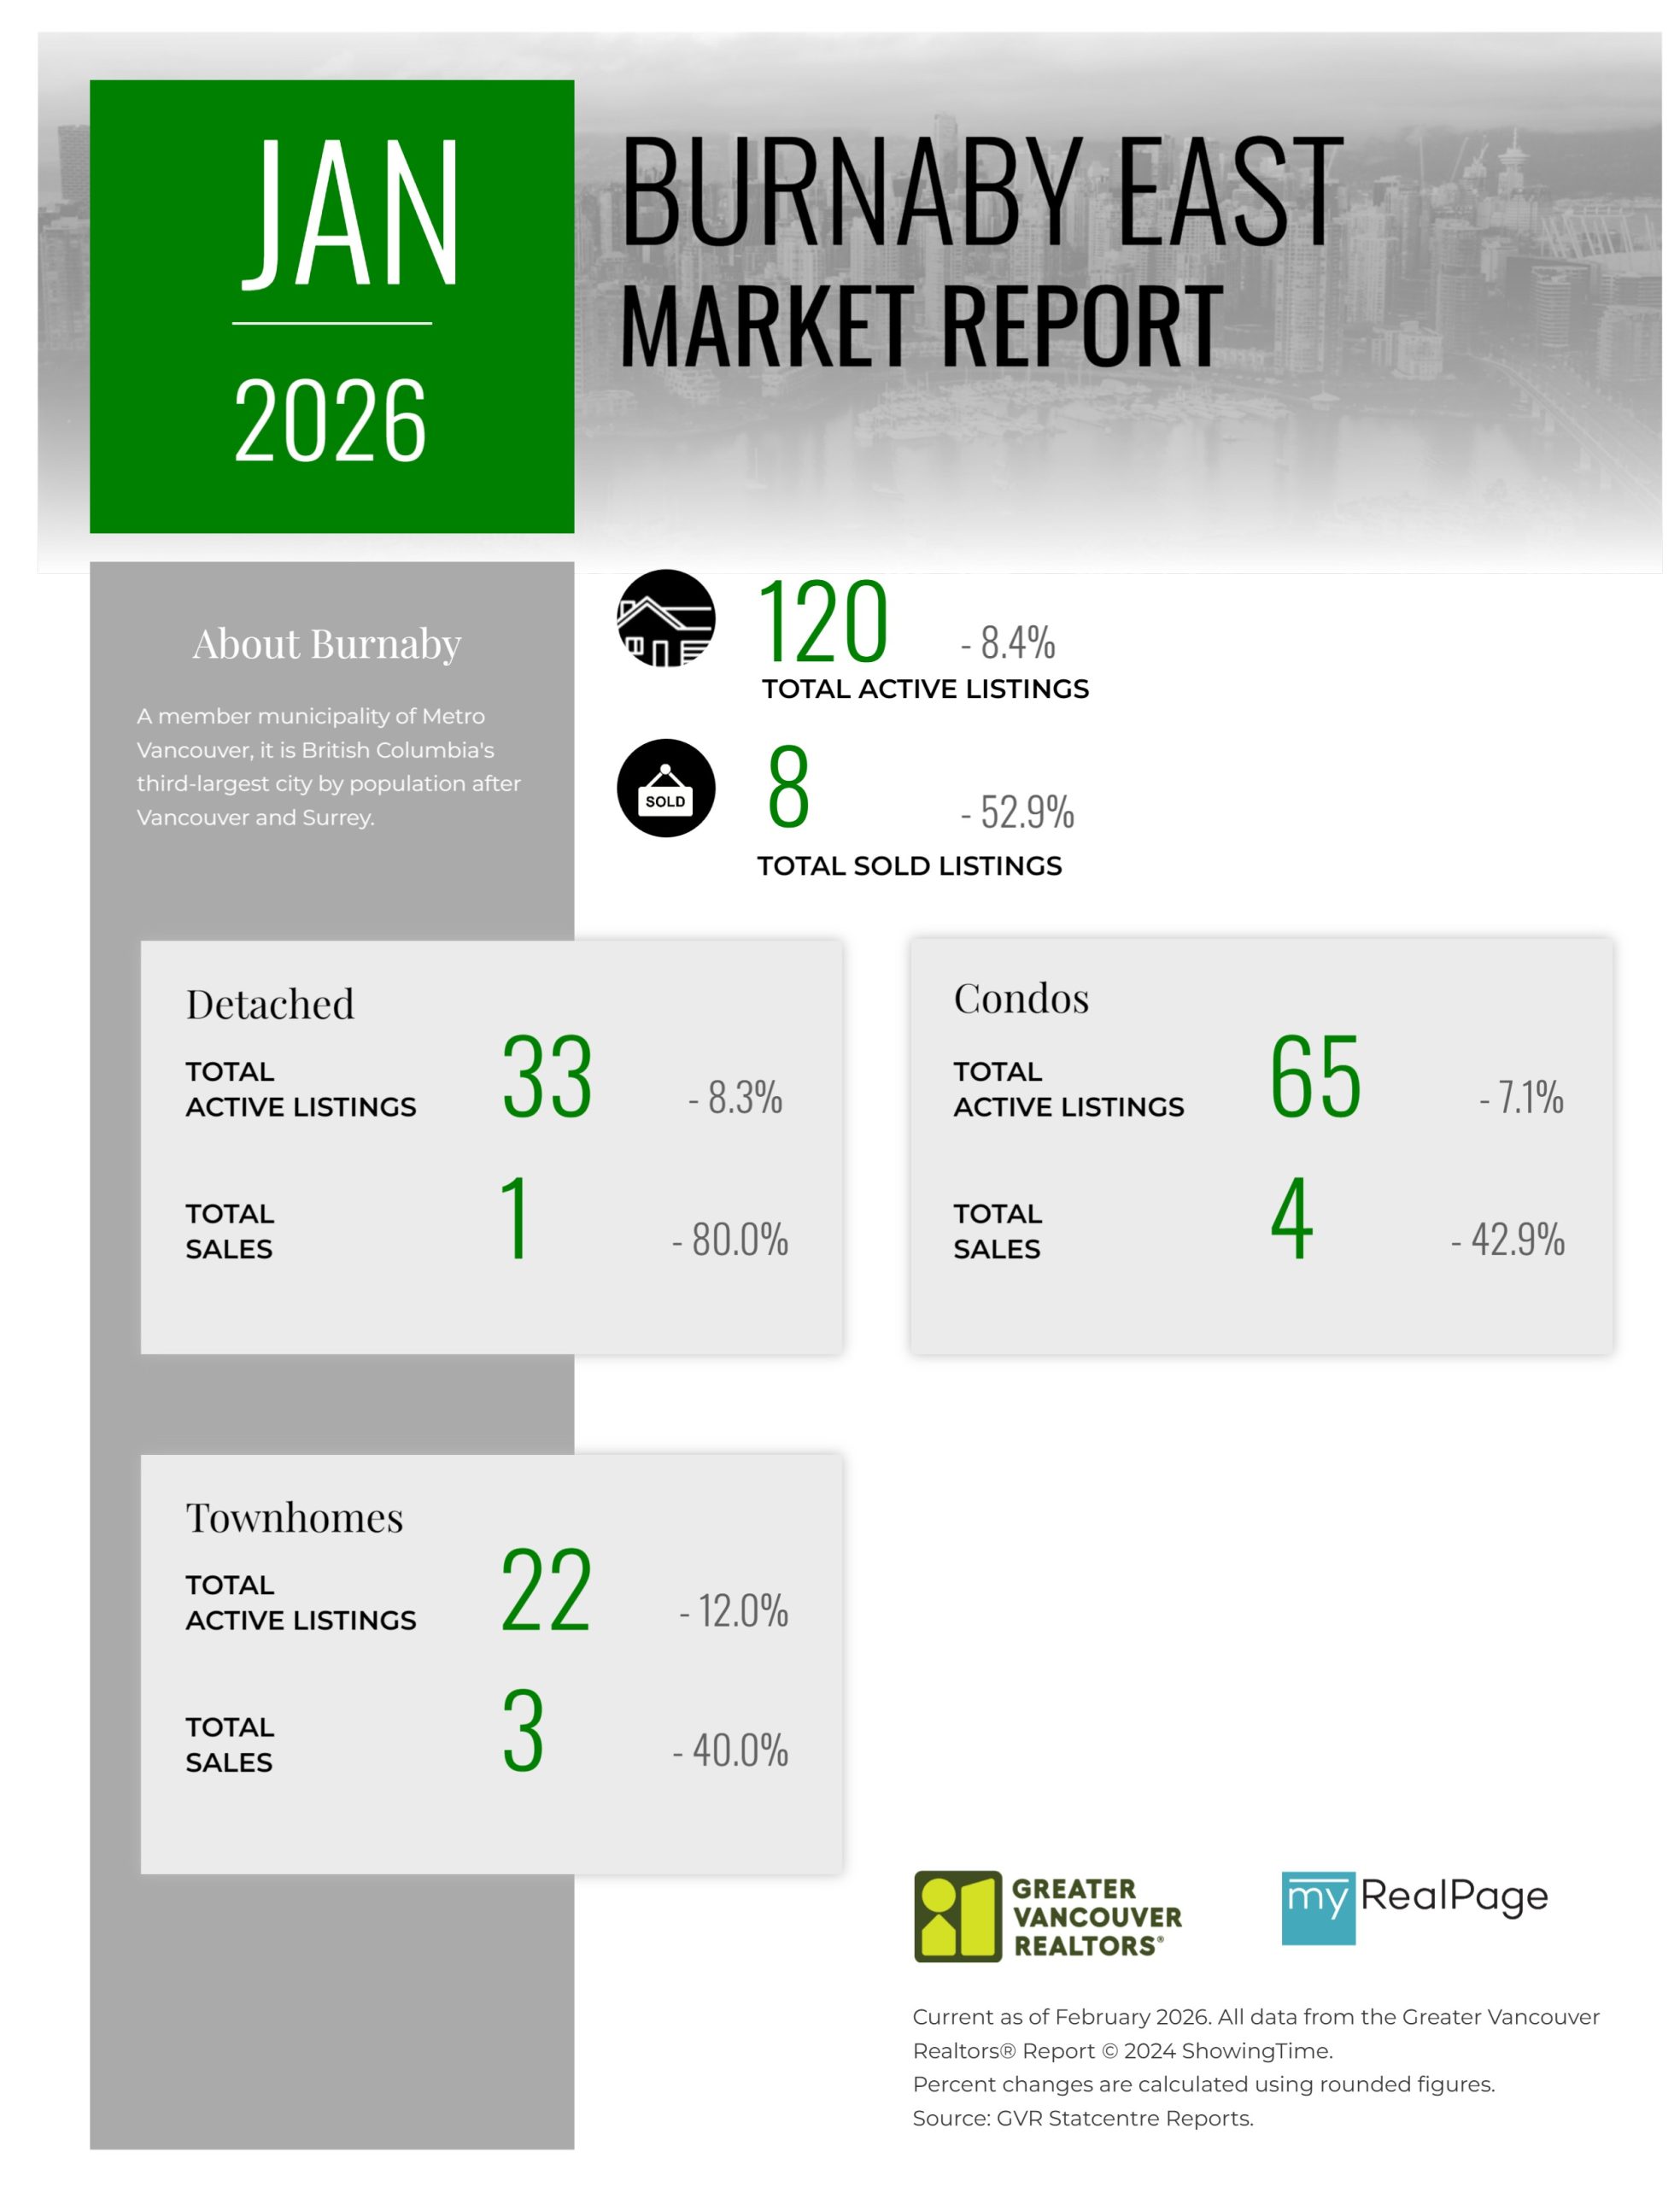
Printable Version – GVR January 2026 Data Infographics Report Burnaby East
Printable Version – GVR January 2026 Data Infographics Report New Westminster
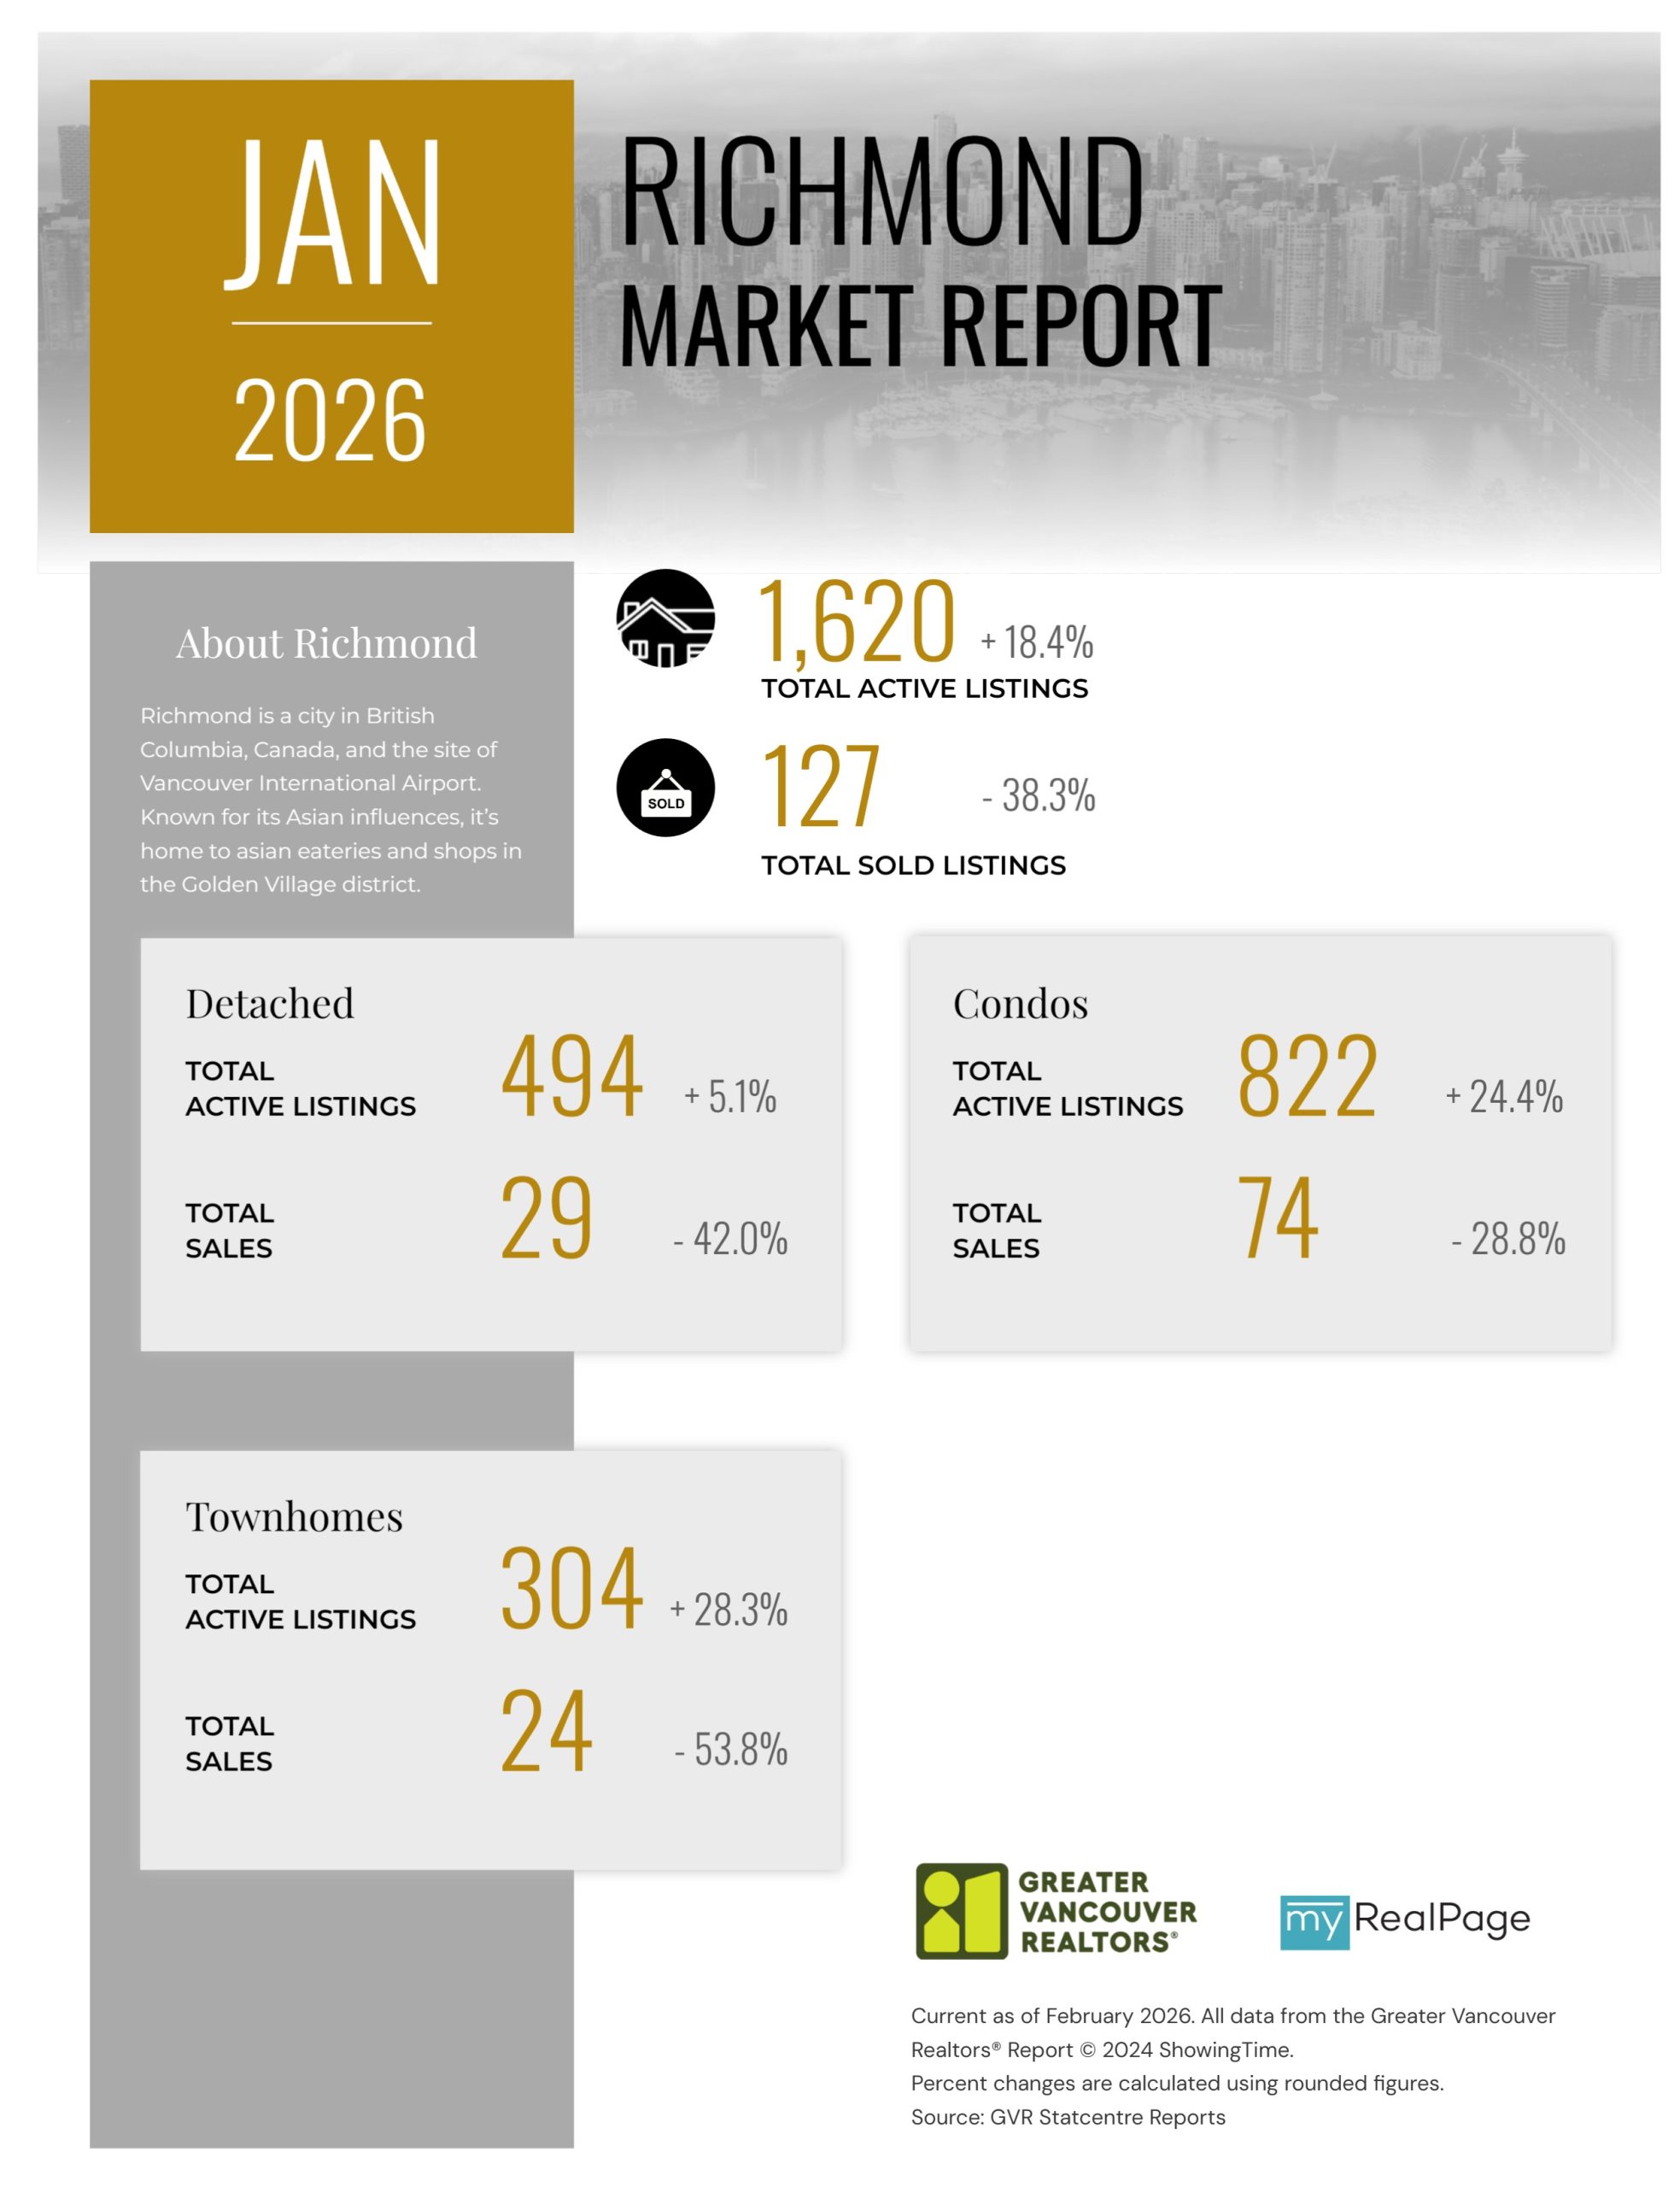
Printable Version – GVR January 2026 Data Infographics Report Richmond
Printable Version – GVR January 2026 Data Infographics Report Squamish


INFOGRAPHICS: December 2025 GVR Greater Vancouver Market Reports
2025 saw lowest annual sales total in over two decades
Home sales registered in the Multiple Listing Service® (MLS®) in Metro Vancouver* finished the year down 10 per cent, marking the lowest annual sales total in over twenty years.
The Greater Vancouver REALTORS® (GVR) reports that residential sales in the region totalled 23,800 in 2025, a 10.4 per cent decrease from the 26,561 sales recorded in 2024, and a 9.3 per cent decrease from the 26,249 sales in 2023.
Last year’s sales total was 24.7 per cent below the 10-year annual sales average (31,625).
“This year was one for the history books. Although the sales total was the lowest in over two decades, Realtors were still busy listing properties. Sellers brought the highest total of listings to market on record since the mid-1990s, eclipsing the previous record high in 2008 by a little over 1,000 listings.” Andrew Lis, GVR chief economist and vice-president data analytics
Read the full report on the REBGV website!
The following data is a comparison between December 2025 and December 2024 numbers, and is current as of January of 2026. For last month’s update, you can check out our previous post!
Or follow this link for all our GVR Infographics!
These infographics cover current trends in several areas within the Greater Vancouver region. Click on the images for a larger view!
Printable Version – GVR December 2025 Data Infographic Report North Vancouver
Printable Version – GVR December 2025 Data Infographics Report West Vancouver
Printable Version – GVR December 2025 Data Infographics Report Vancouver West
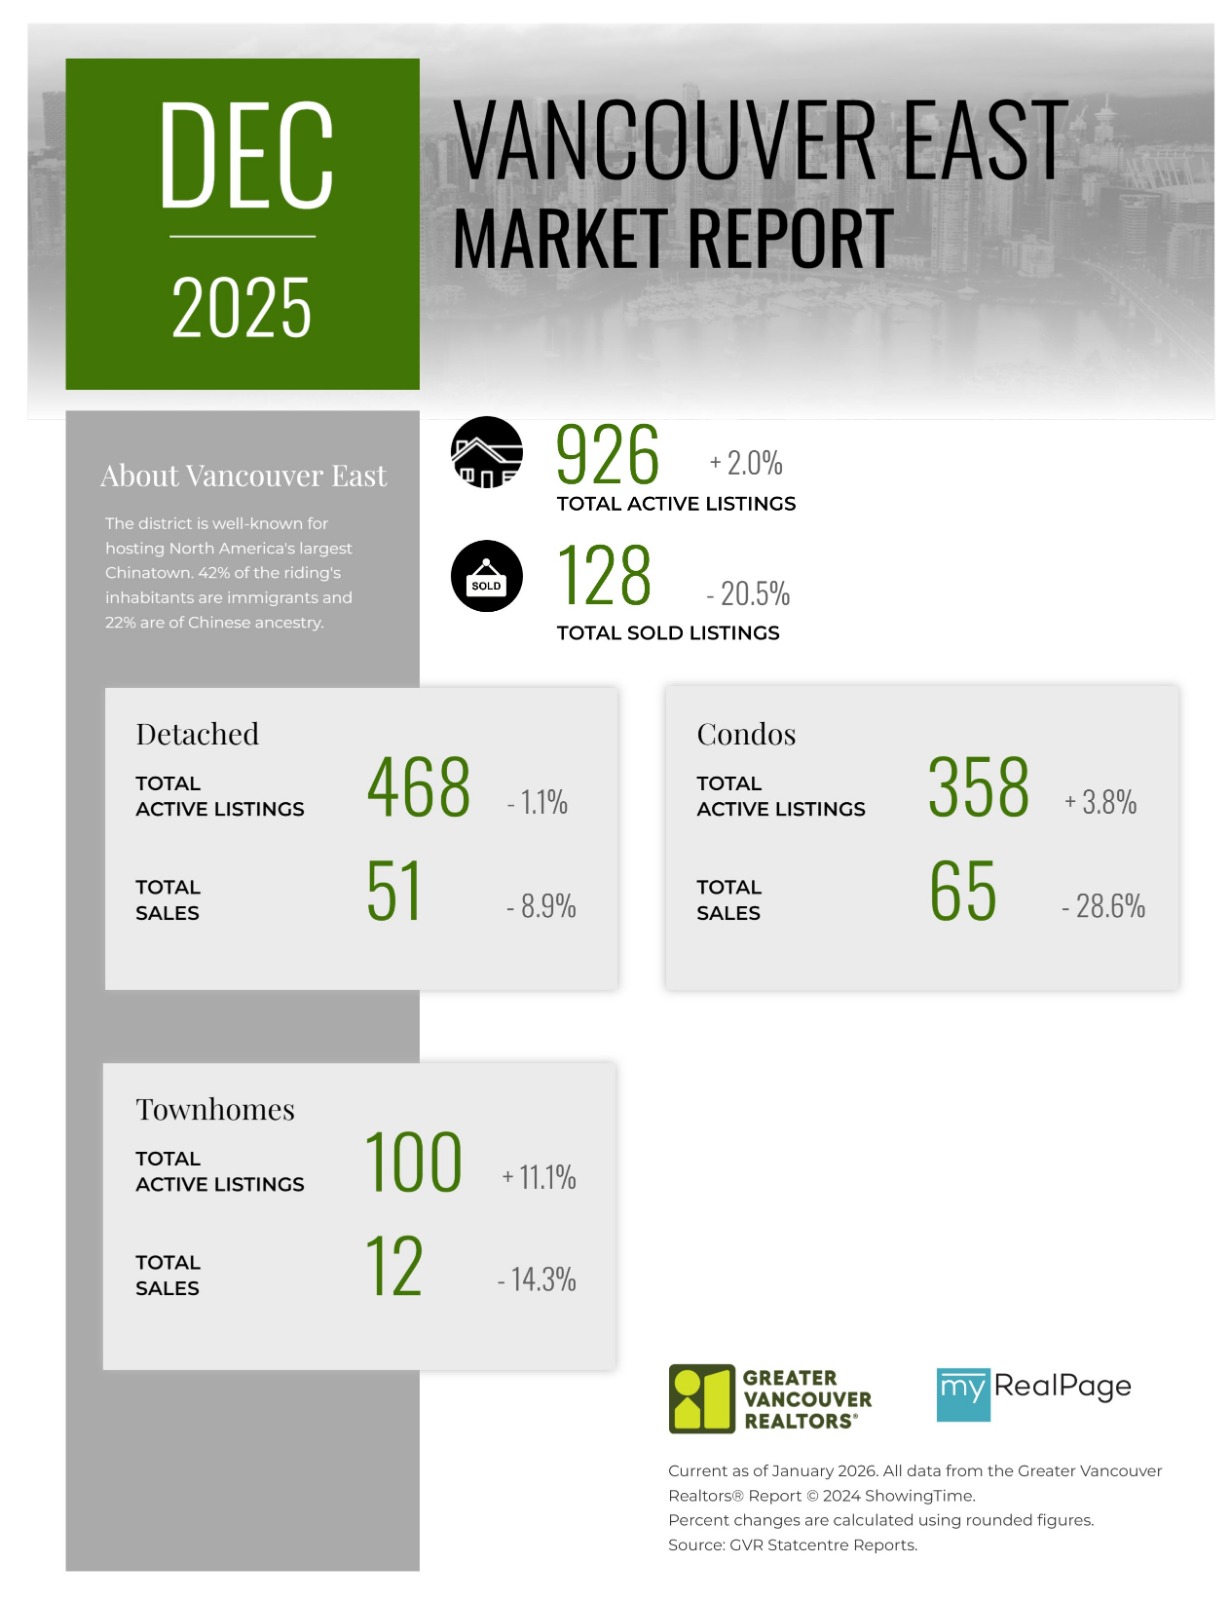
Printable Version – GVR December 2025 Data Infographics Report Vancouver East
Printable Version – GVR December 2025 Data Infographic Report Maple Ridge
Printable Version – GVR December 2025 Data Infographics Report Pitt Meadows
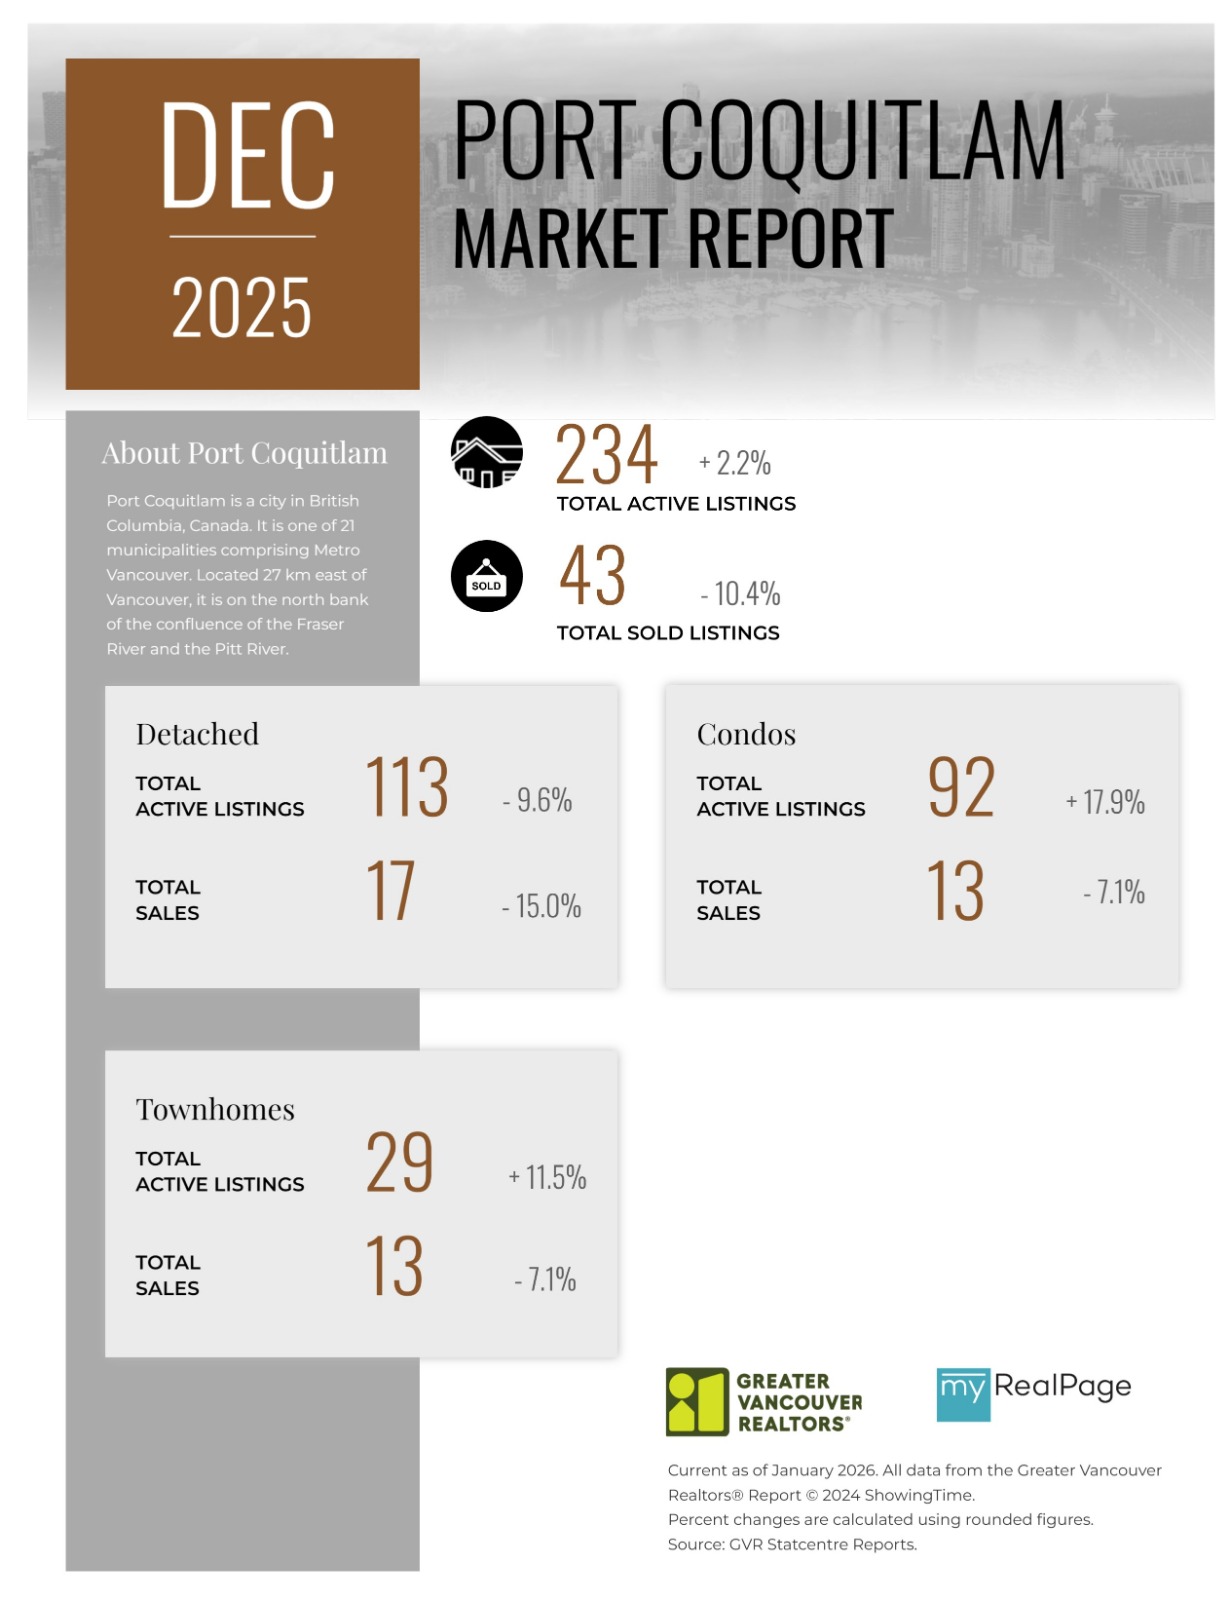
Printable Version – GVR December 2025 Data Infographics Report Port Coquitlam
Printable Version – GVR December 2025 Data Infographics Report Coquitlam
Printable Version – GVR December 2025 Data Infographic Report Burnaby North
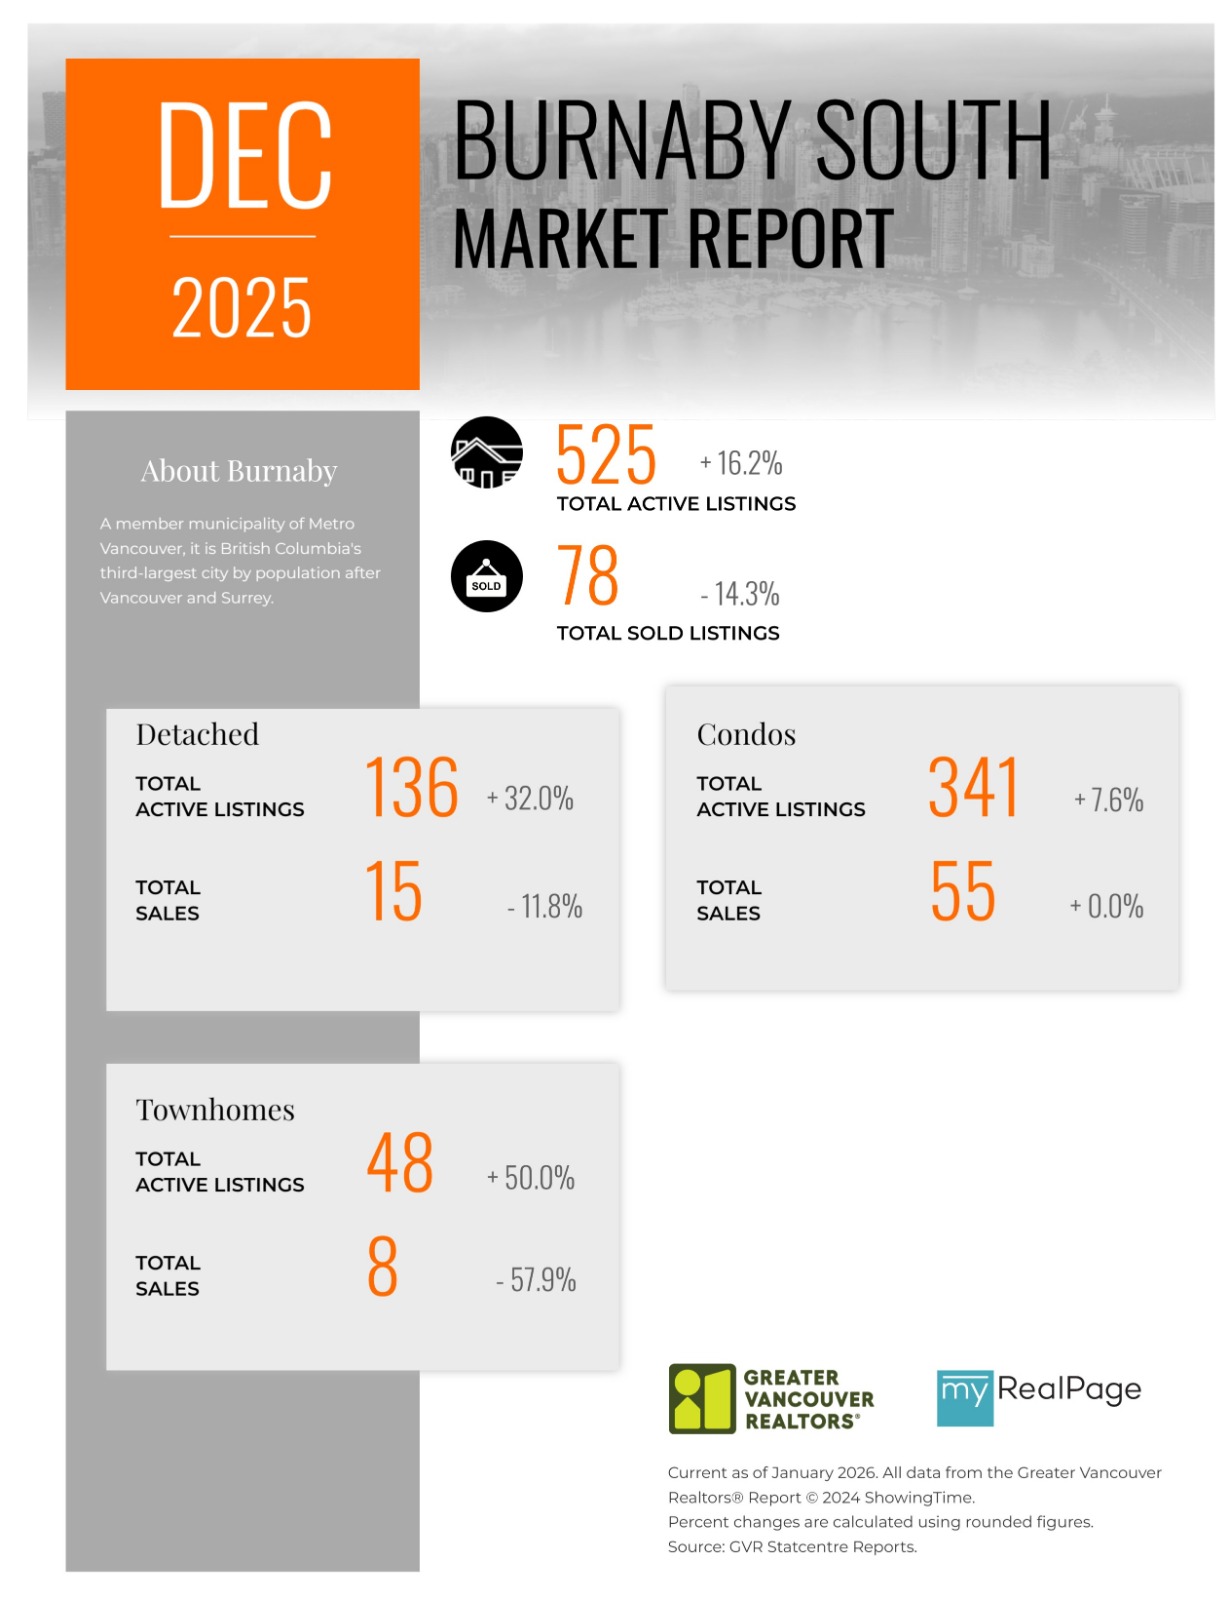
Printable Version – GVR December 2025 Data Infographics Report Burnaby South
Printable Version – GVR December 2025 Data Infographics Report Burnaby East
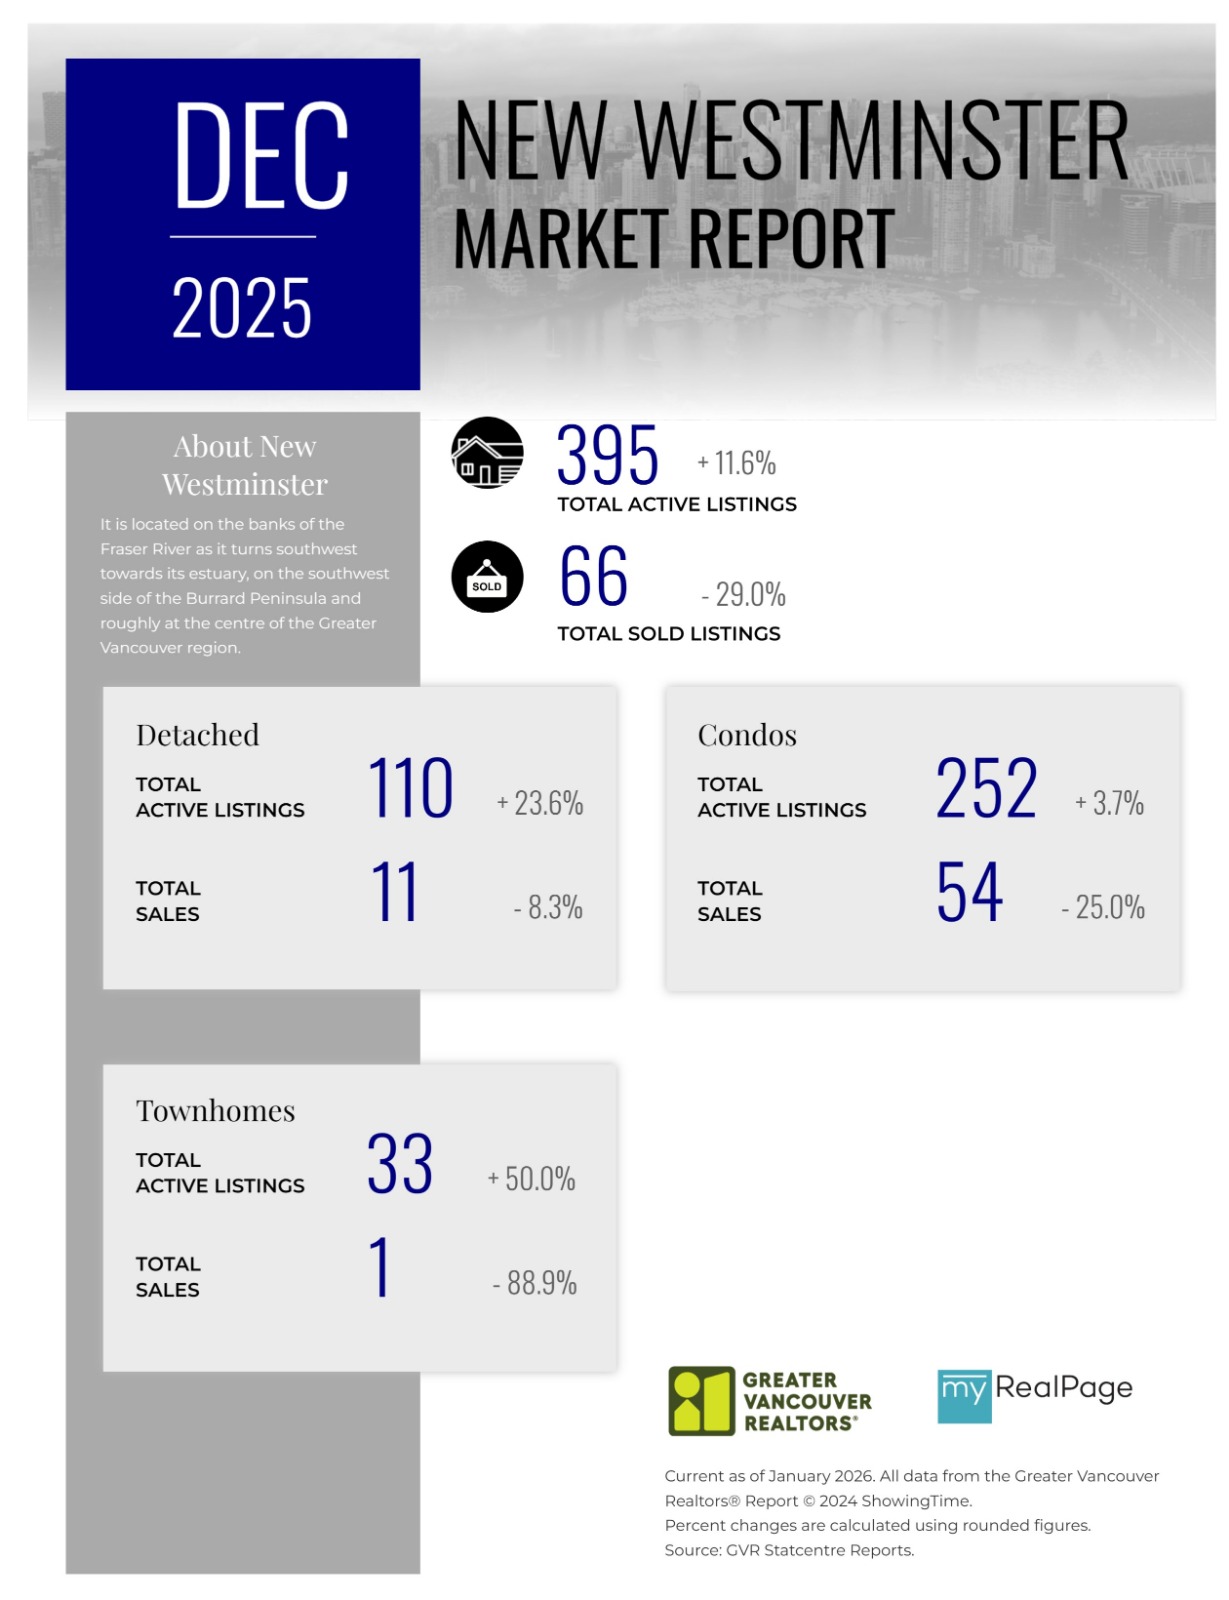
Printable Version – GVR December 2025 Data Infographics Report New Westminster
Printable Version – GVR December 2025 Data Infographics Report Richmond
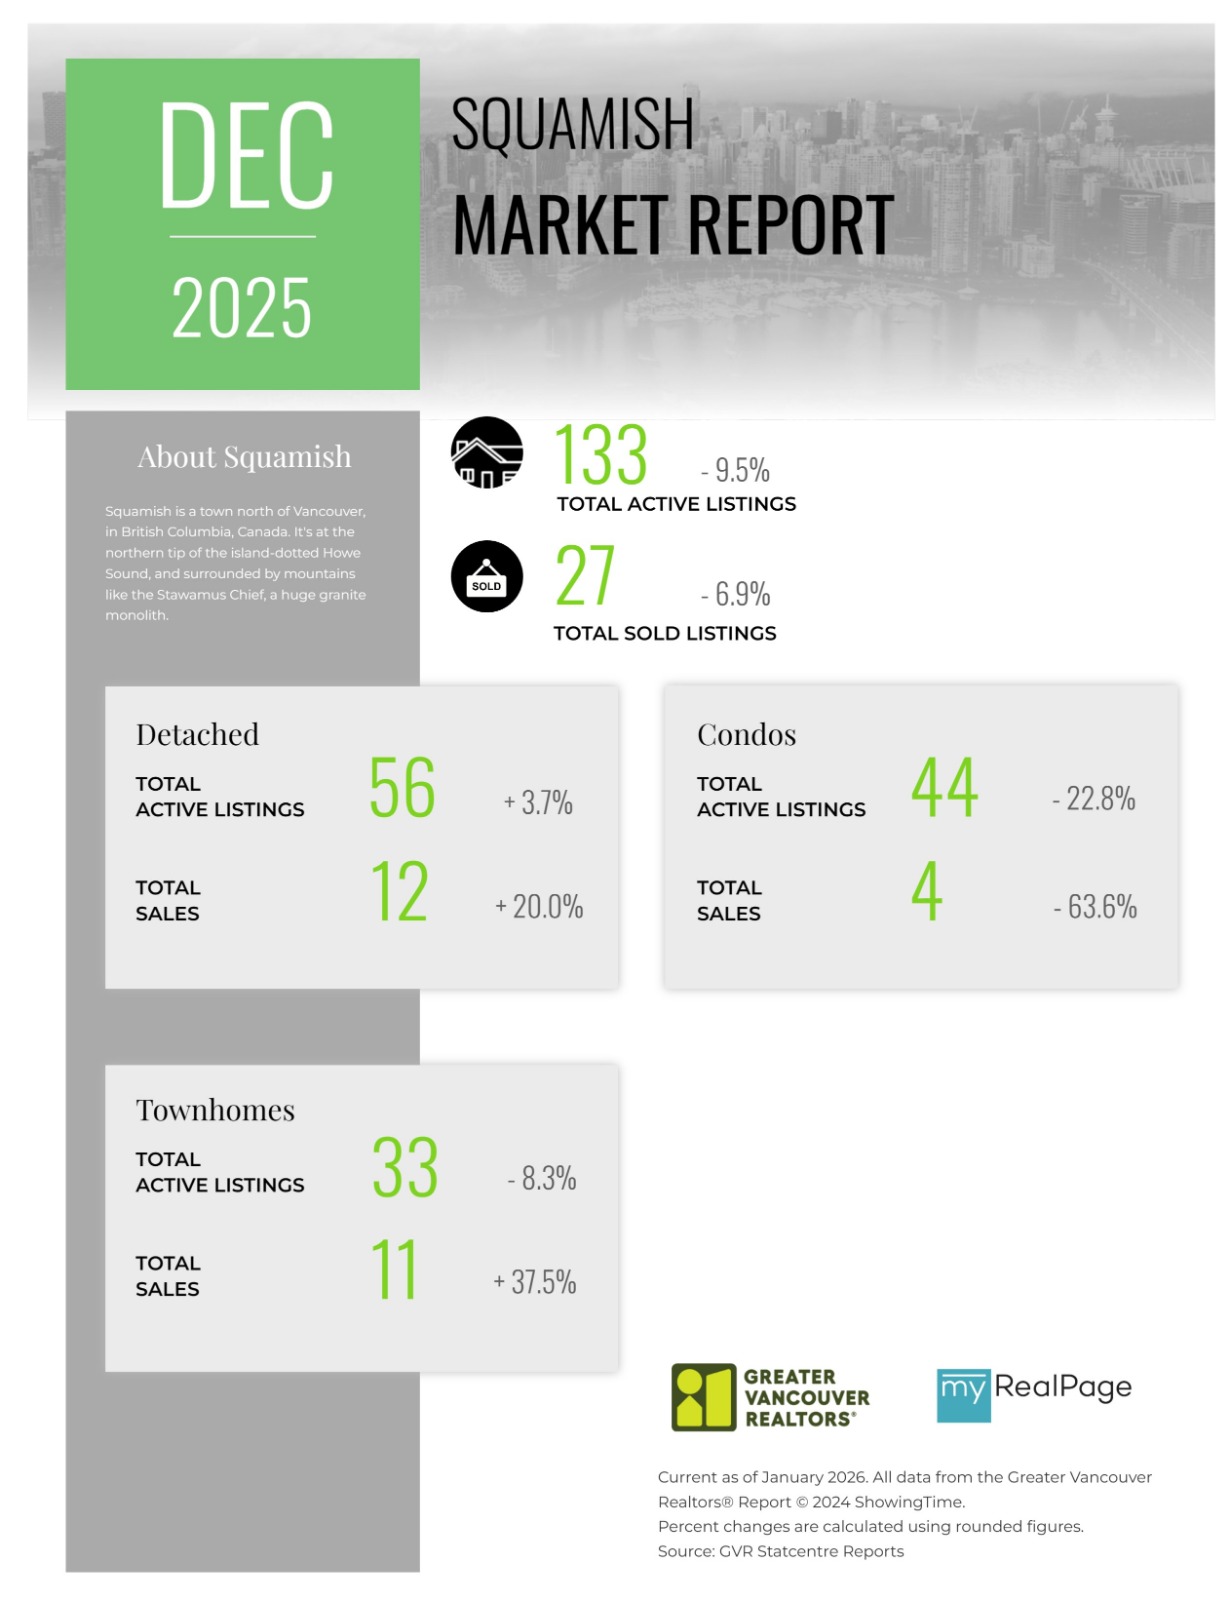
Printable Version – GVR December 2025 Data Infographics Report Squamish


INFOGRAPHICS: November 2025 GVR Greater Vancouver Market Reports
Housing market sees little change as year-end nears
Metro Vancouver home-sale trends observed in October continued in November, as sales registered on the MLS® remained lower than this time last year.
The Greater Vancouver REALTORS® (GVR) reports that residential sales in the region totalled 1,846 in November 2025, a 15.4 per cent decrease from the 2,181 sales recorded in November 2024. This was 20.6 per cent below the 10-year seasonal average (2,324).
“As the year draws to a close, the data continues telling a story of a market with many buyers patiently waiting and sellers adjusting to market conditions not seen in years. Inventory remains healthy, providing buyers ample choice, which, by contrast, is pushing sellers to accept that pricing must reflect this new reality. Buyers and sellers are striking deals when their expectations are aligned and reflective of the current market – not the market of years ago.” said Andrew Lis, GVR director of economics and data analytics
Read the full report on the REBGV website!
The following data is a comparison between November 2025 and November 2024 numbers, and is current as of December of 2025. For last month’s update, you can check out our previous post!
Or follow this link for all our GVR Infographics!
These infographics cover current trends in several areas within the Greater Vancouver region. Click on the images for a larger view!
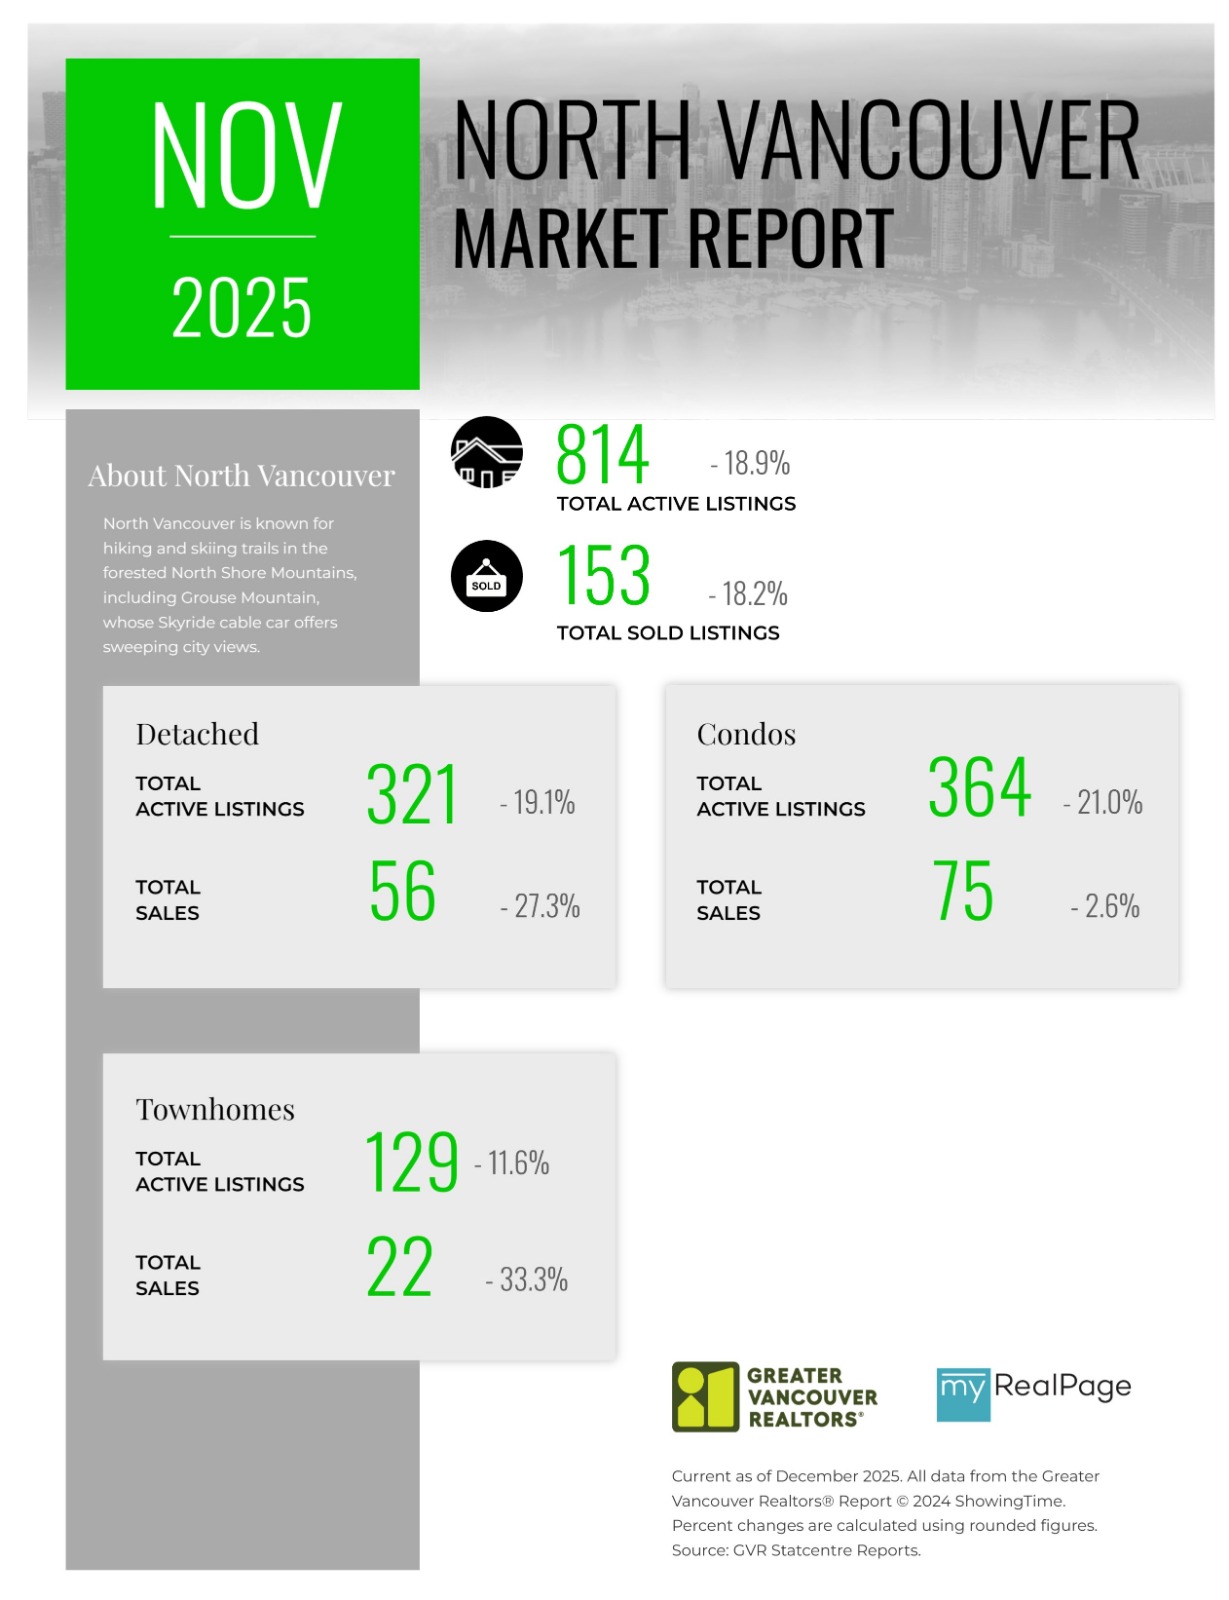
Printable Version – GVR November 2025 Data Infographic Report North Vancouver
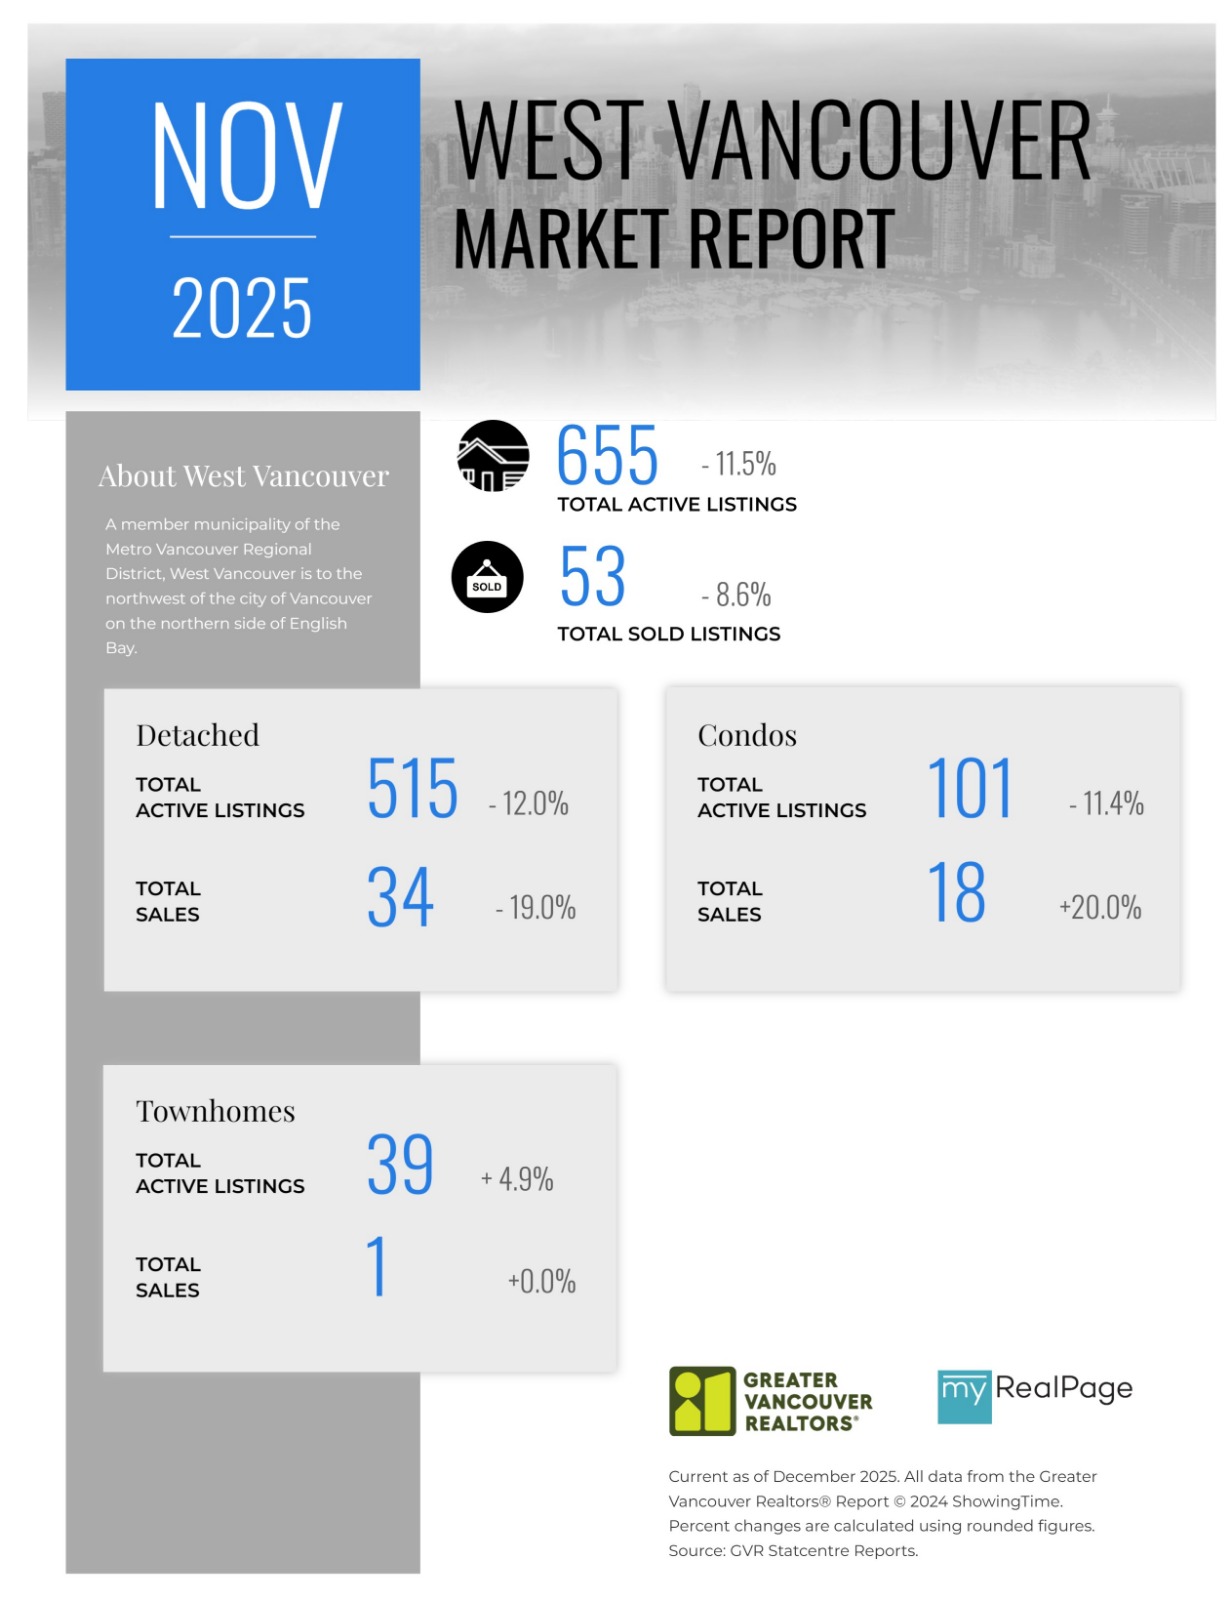
Printable Version – GVR November 2025 Data Infographics Report West Vancouver
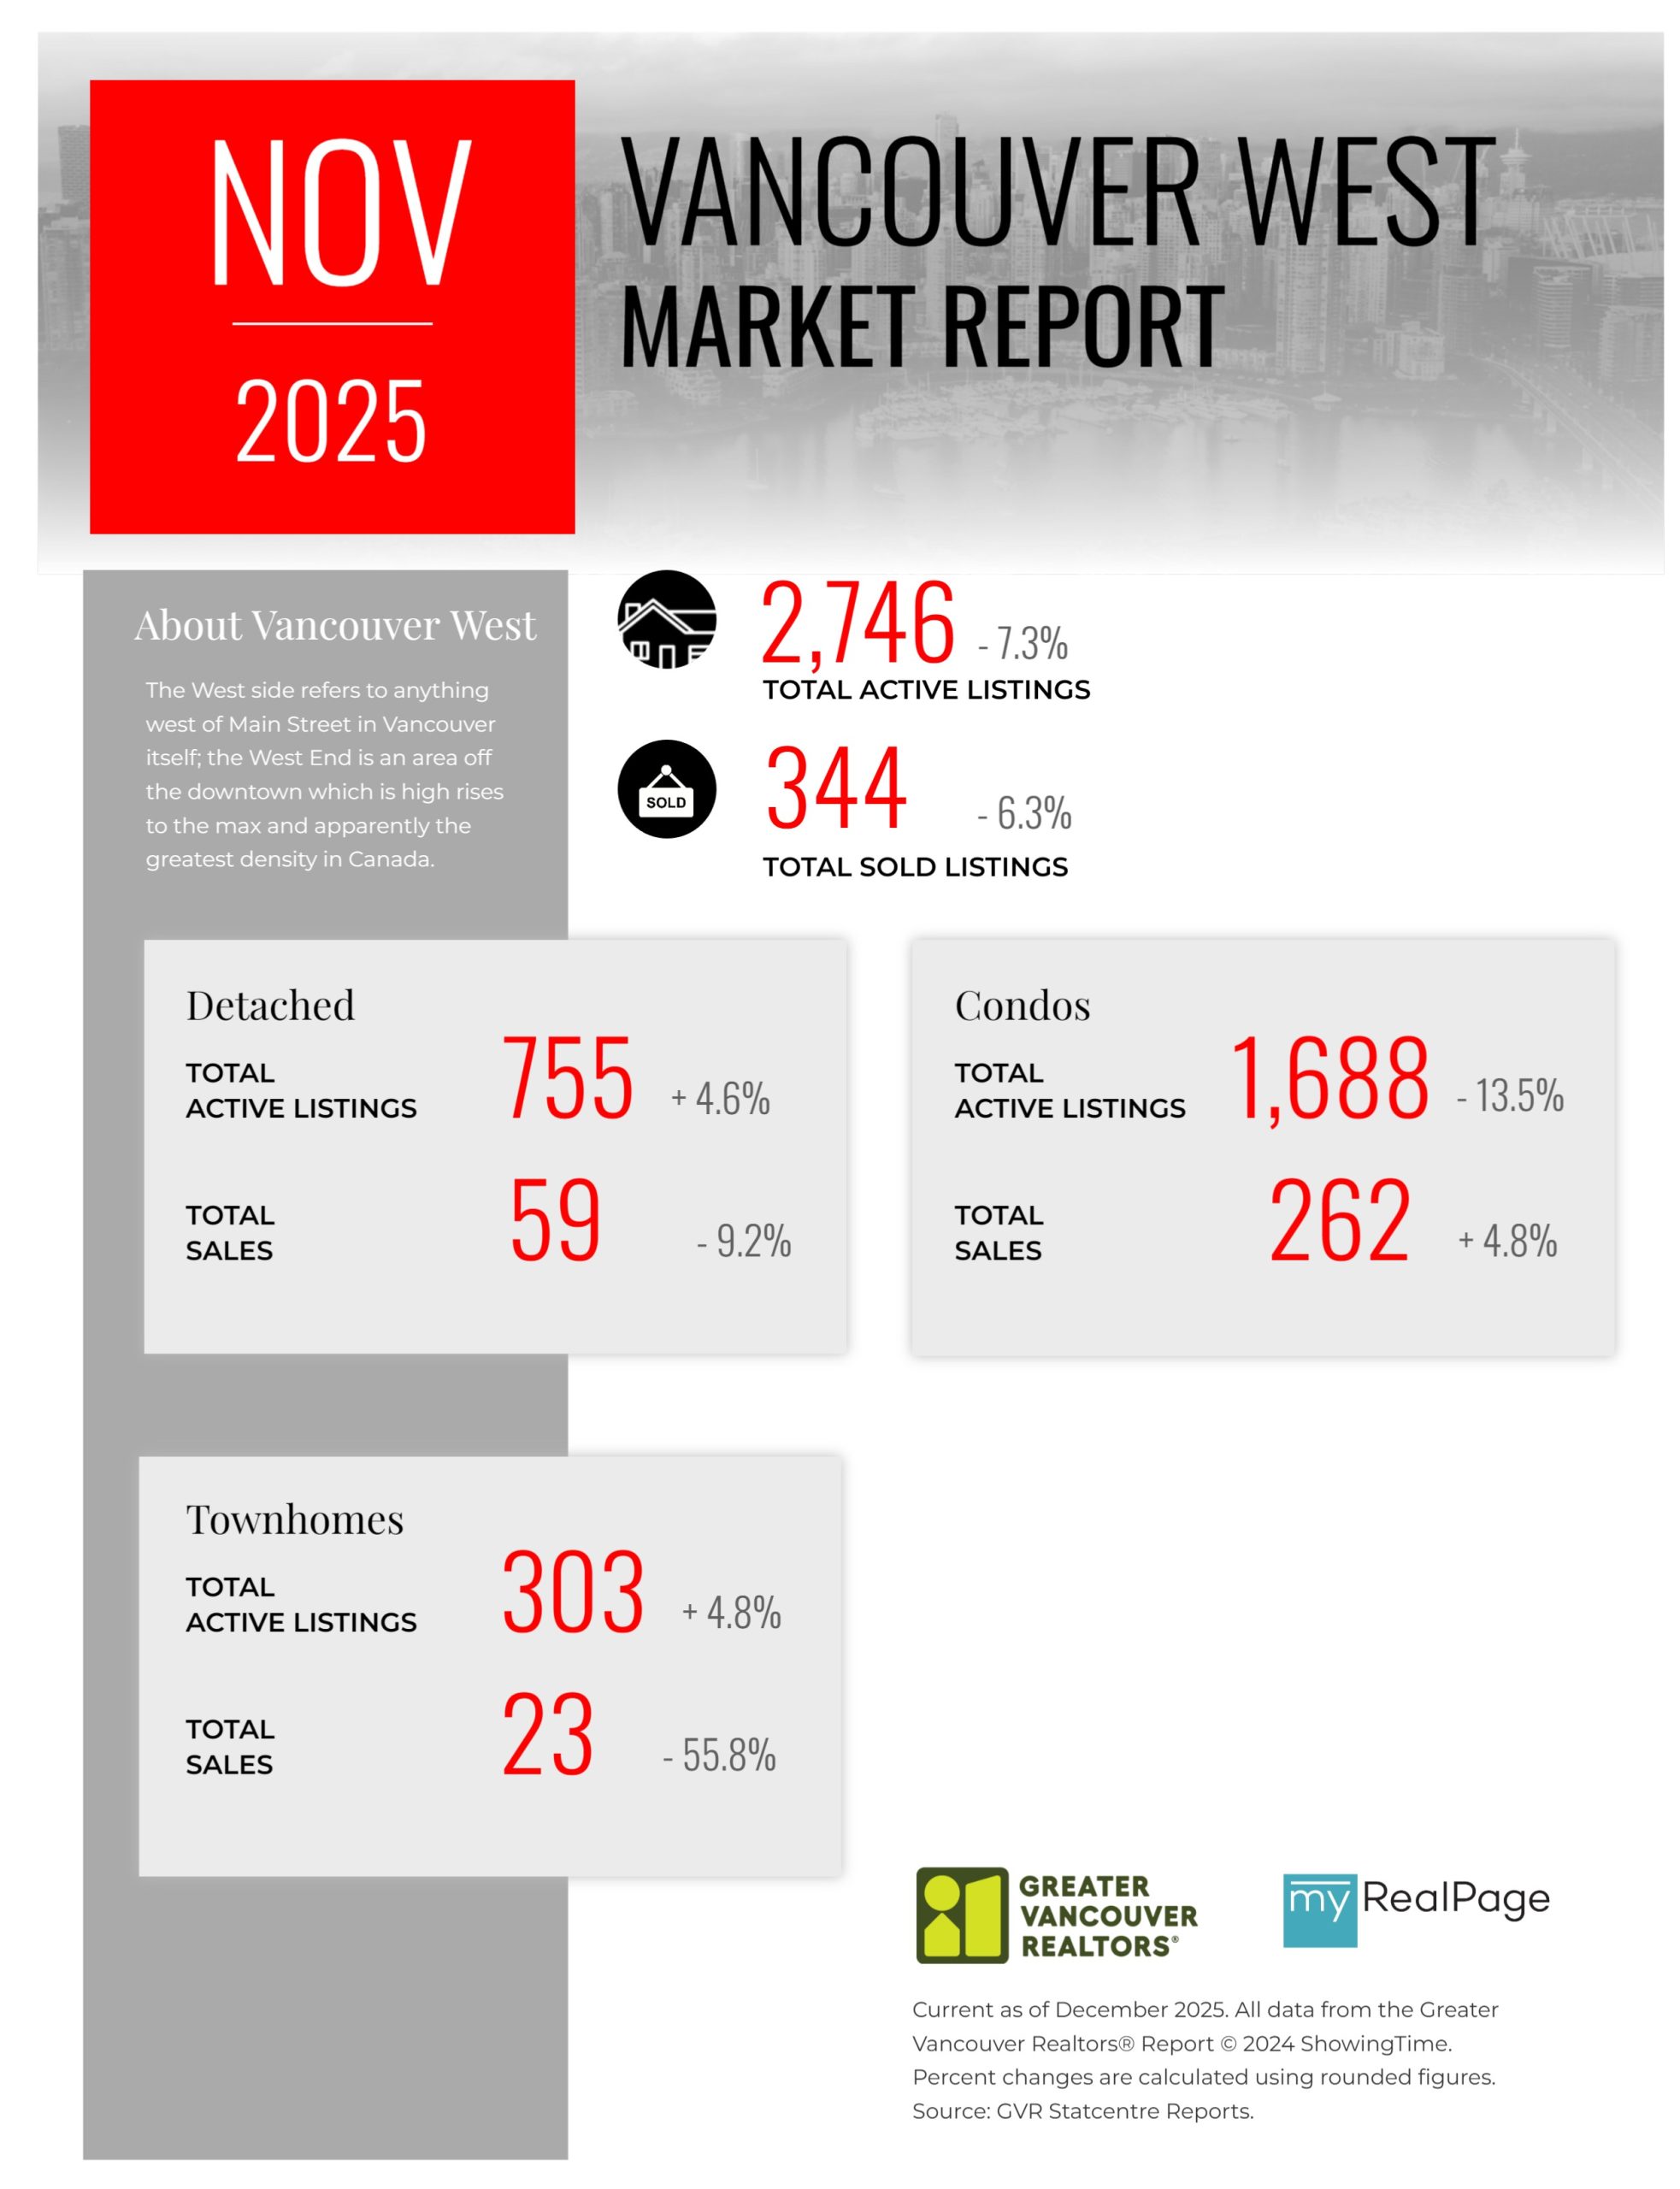
Printable Version – GVR November 2025 Data Infographics Report Vancouver West
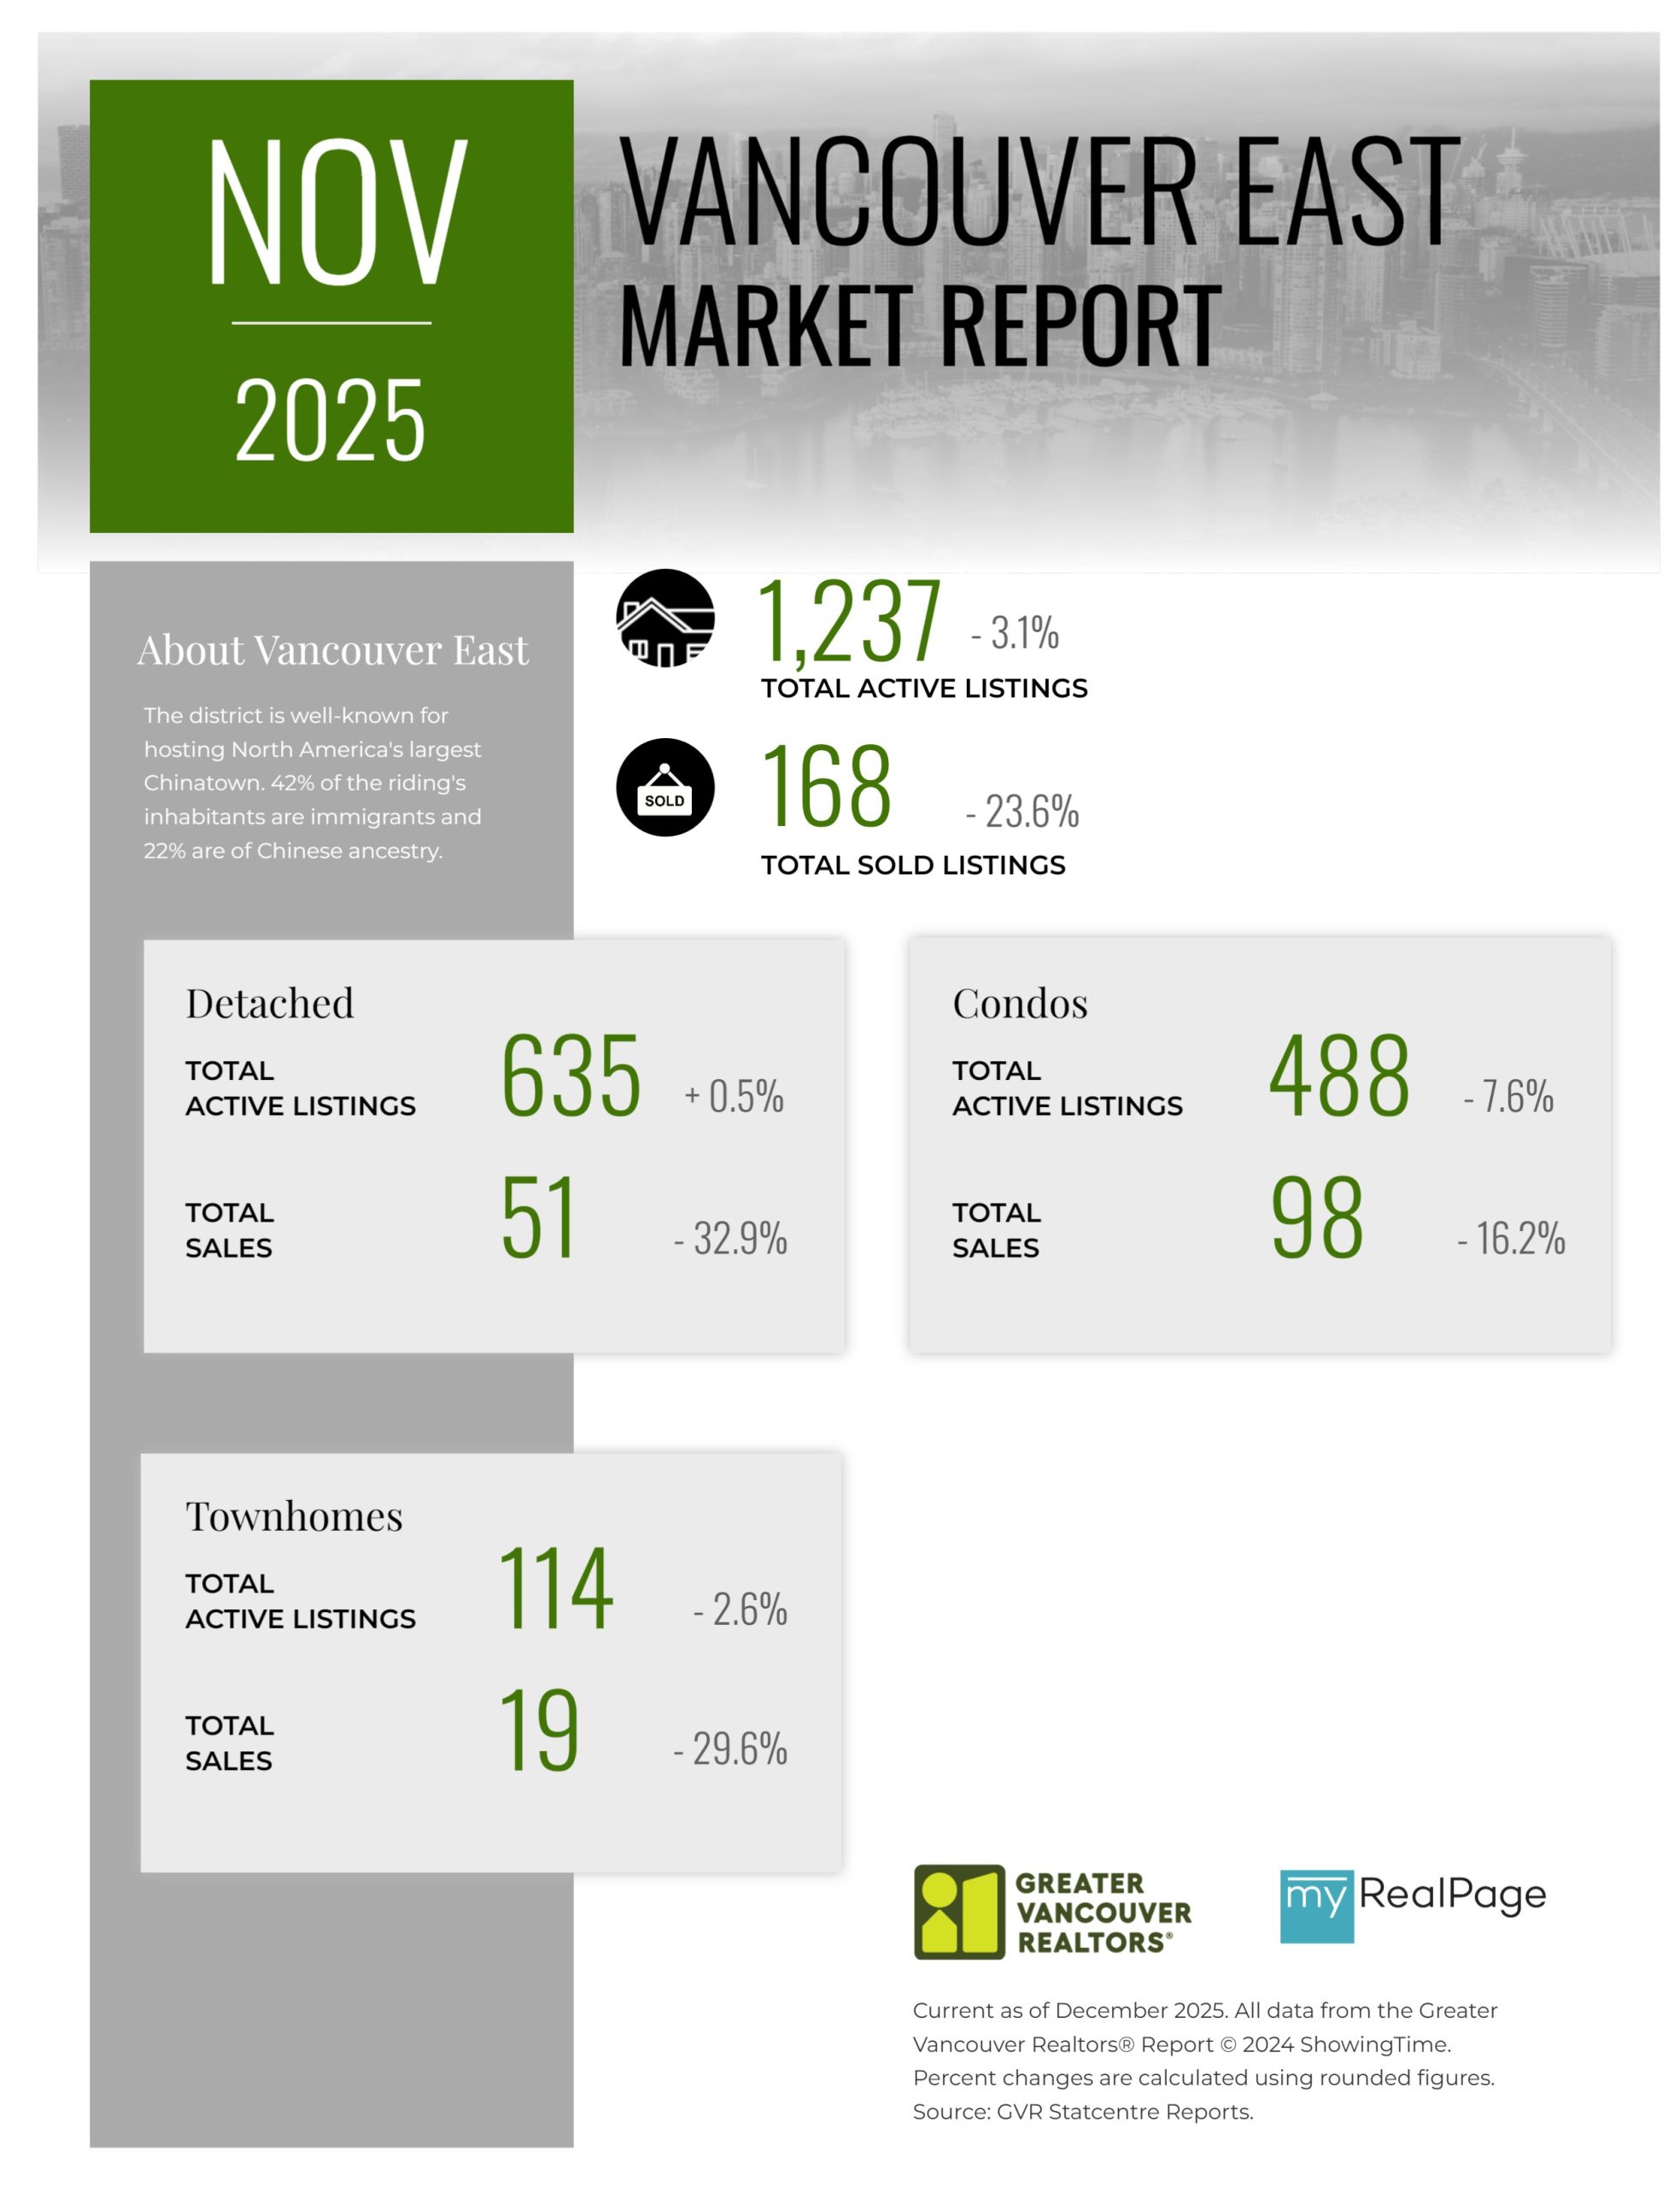
Printable Version – GVR November 2025 Data Infographics Report Vancouver East
Printable Version – GVR November 2025 Data Infographic Report Maple Ridge
Printable Version – GVR November 2025 Data Infographics Report Pitt Meadows
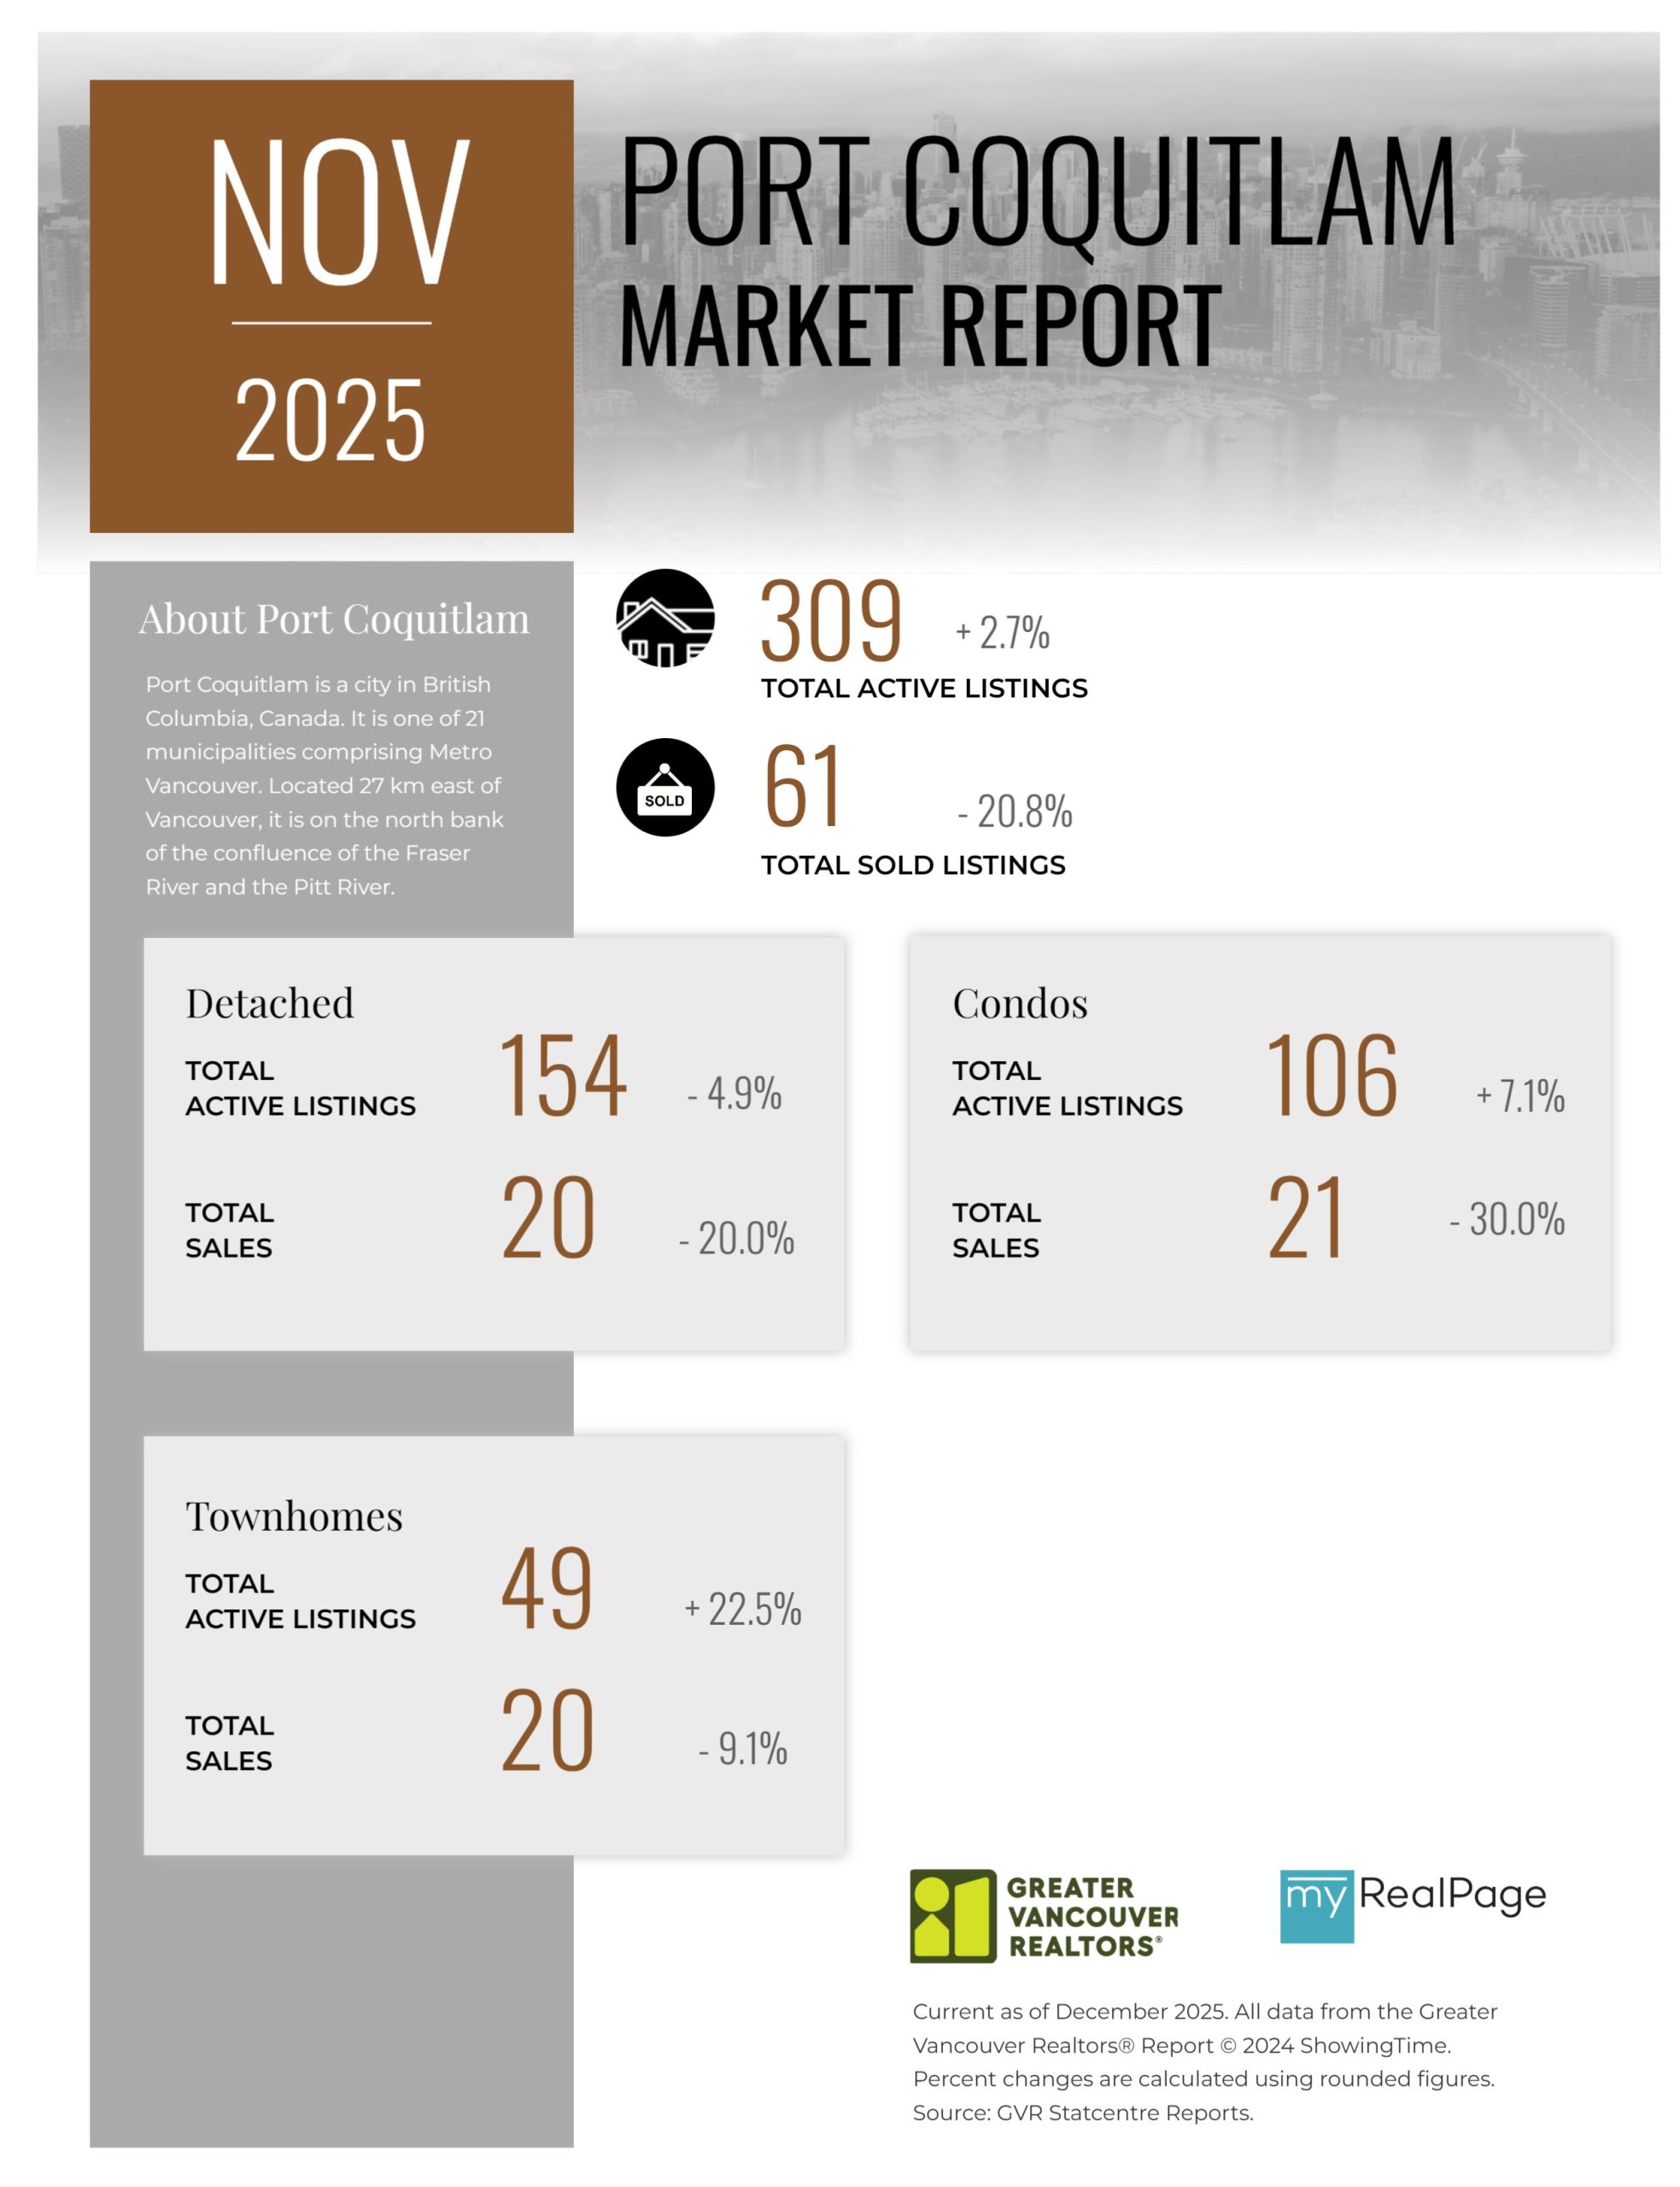
Printable Version – GVR November 2025 Data Infographics Report Port Coquitlam
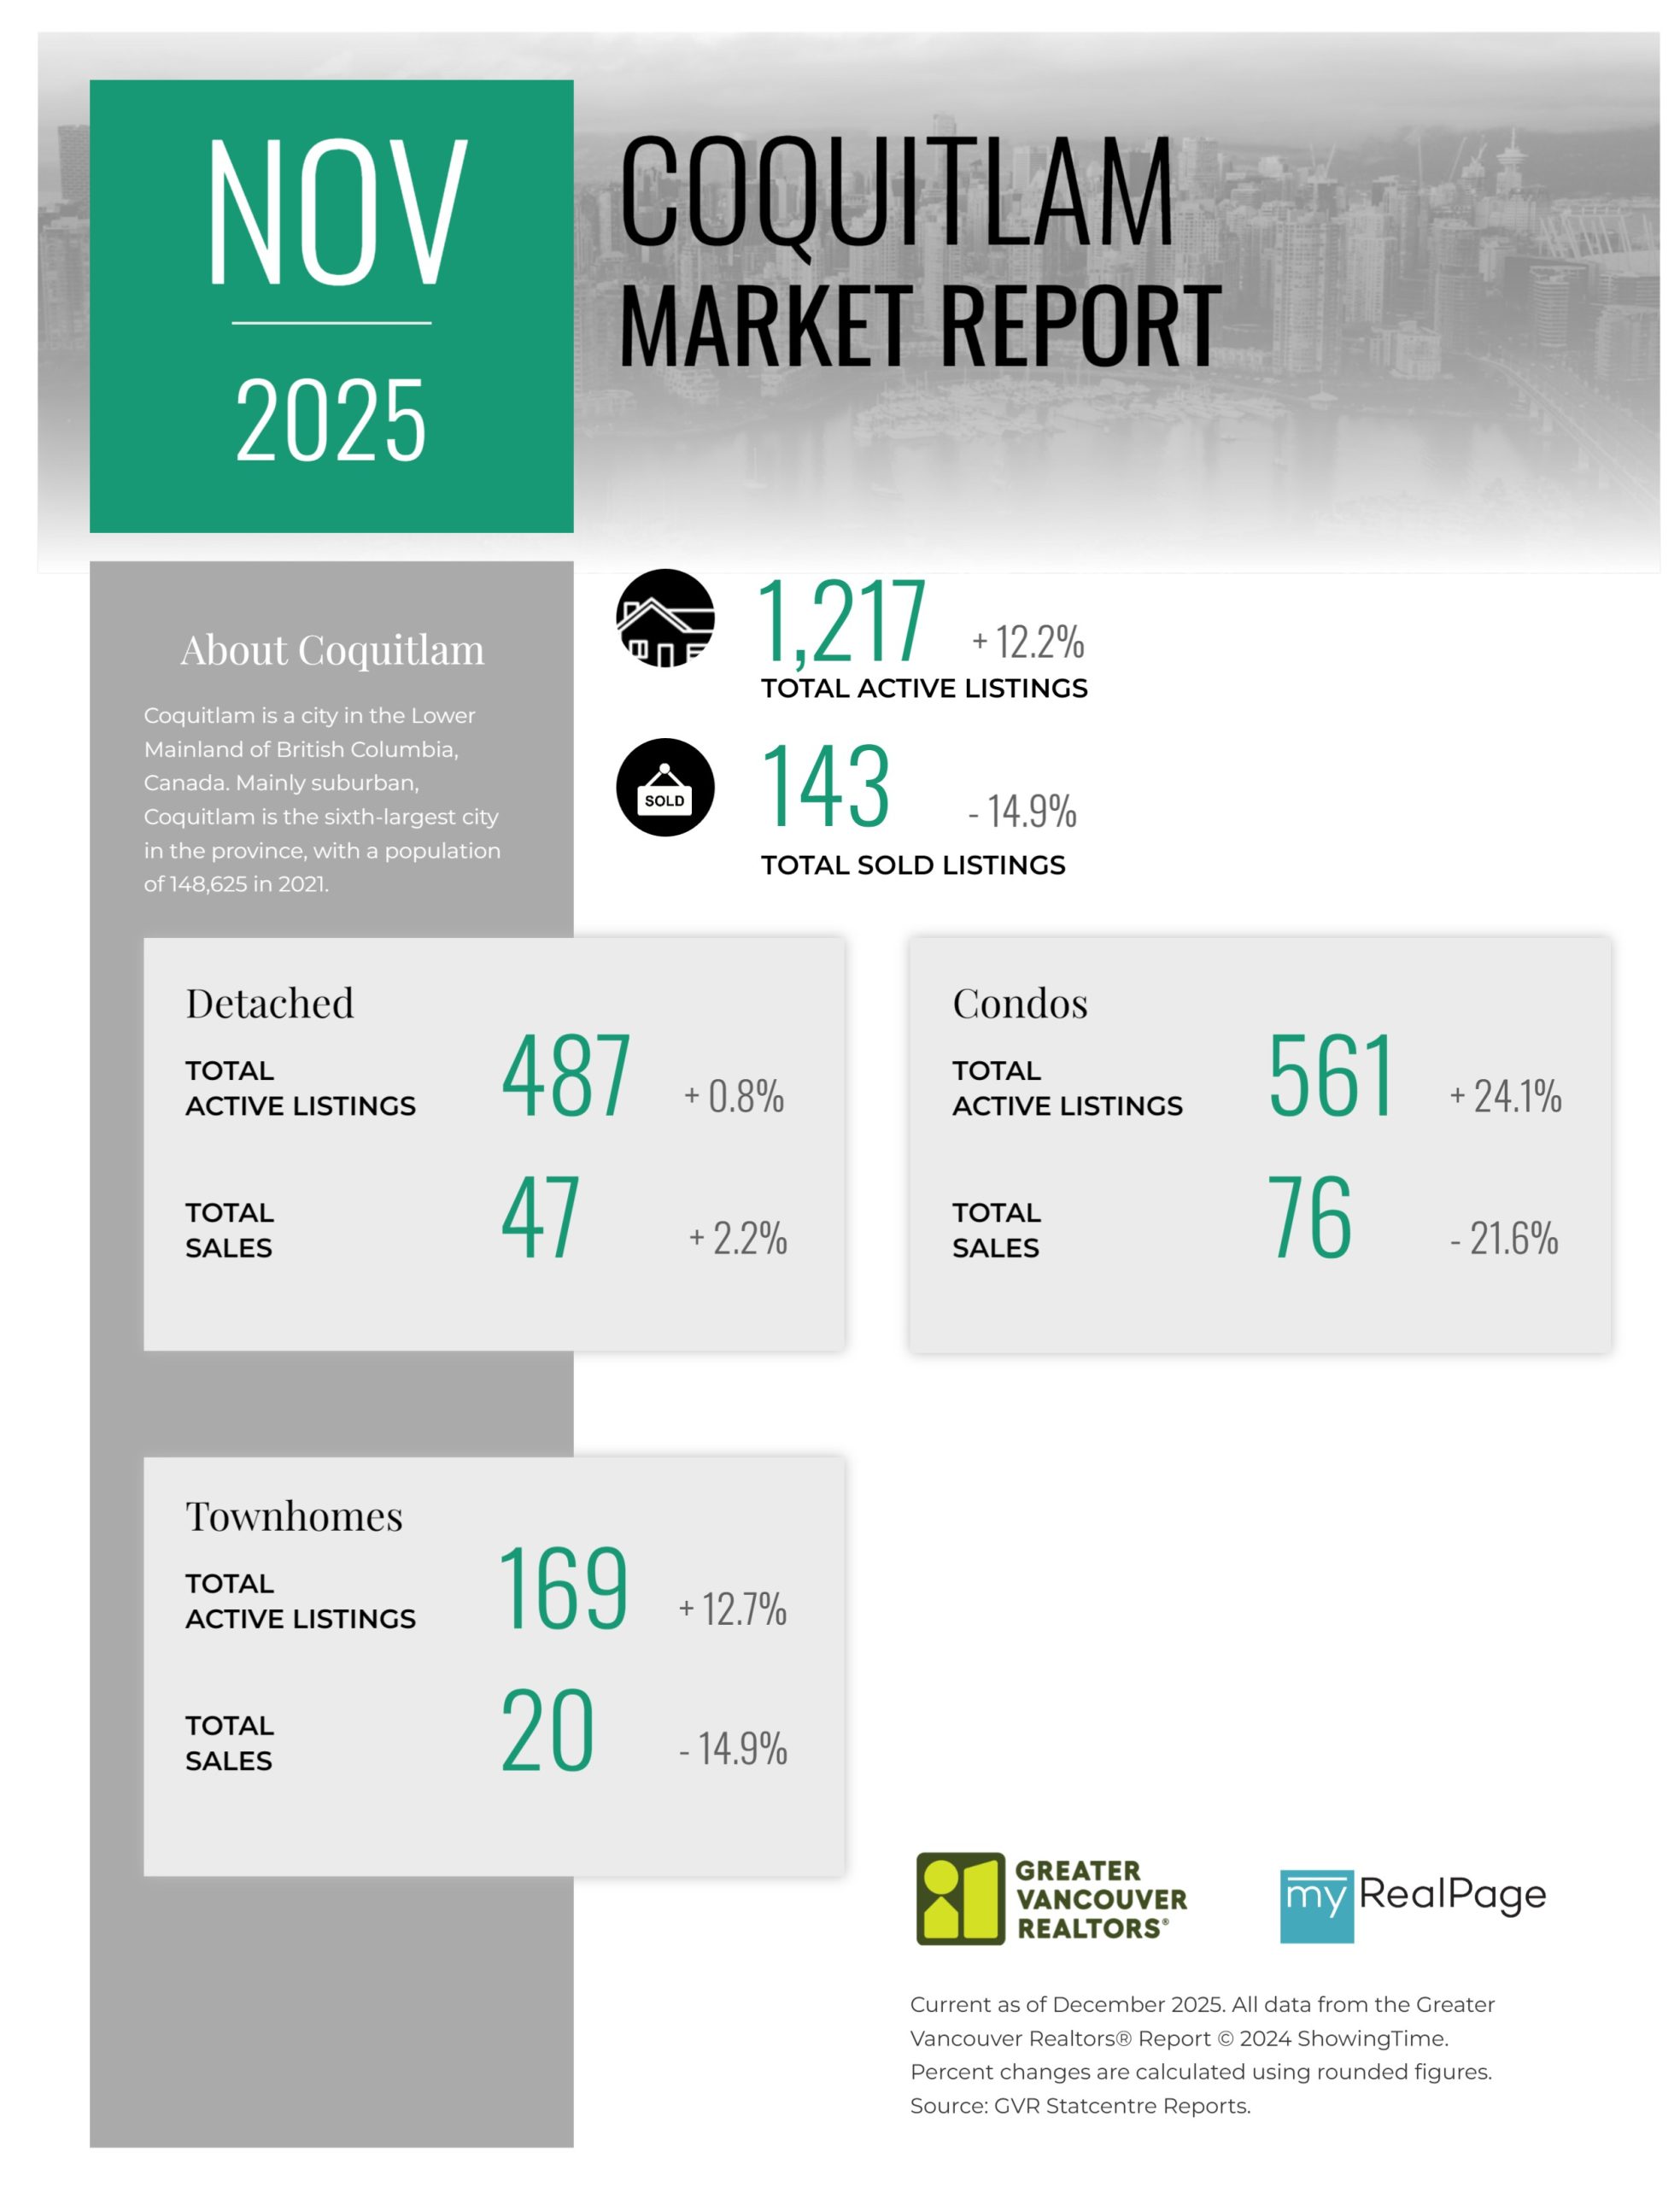
Printable Version – GVR November 2025 Data Infographics Report Coquitlam
Printable Version – GVR November 2025 Data Infographic Report Burnaby North
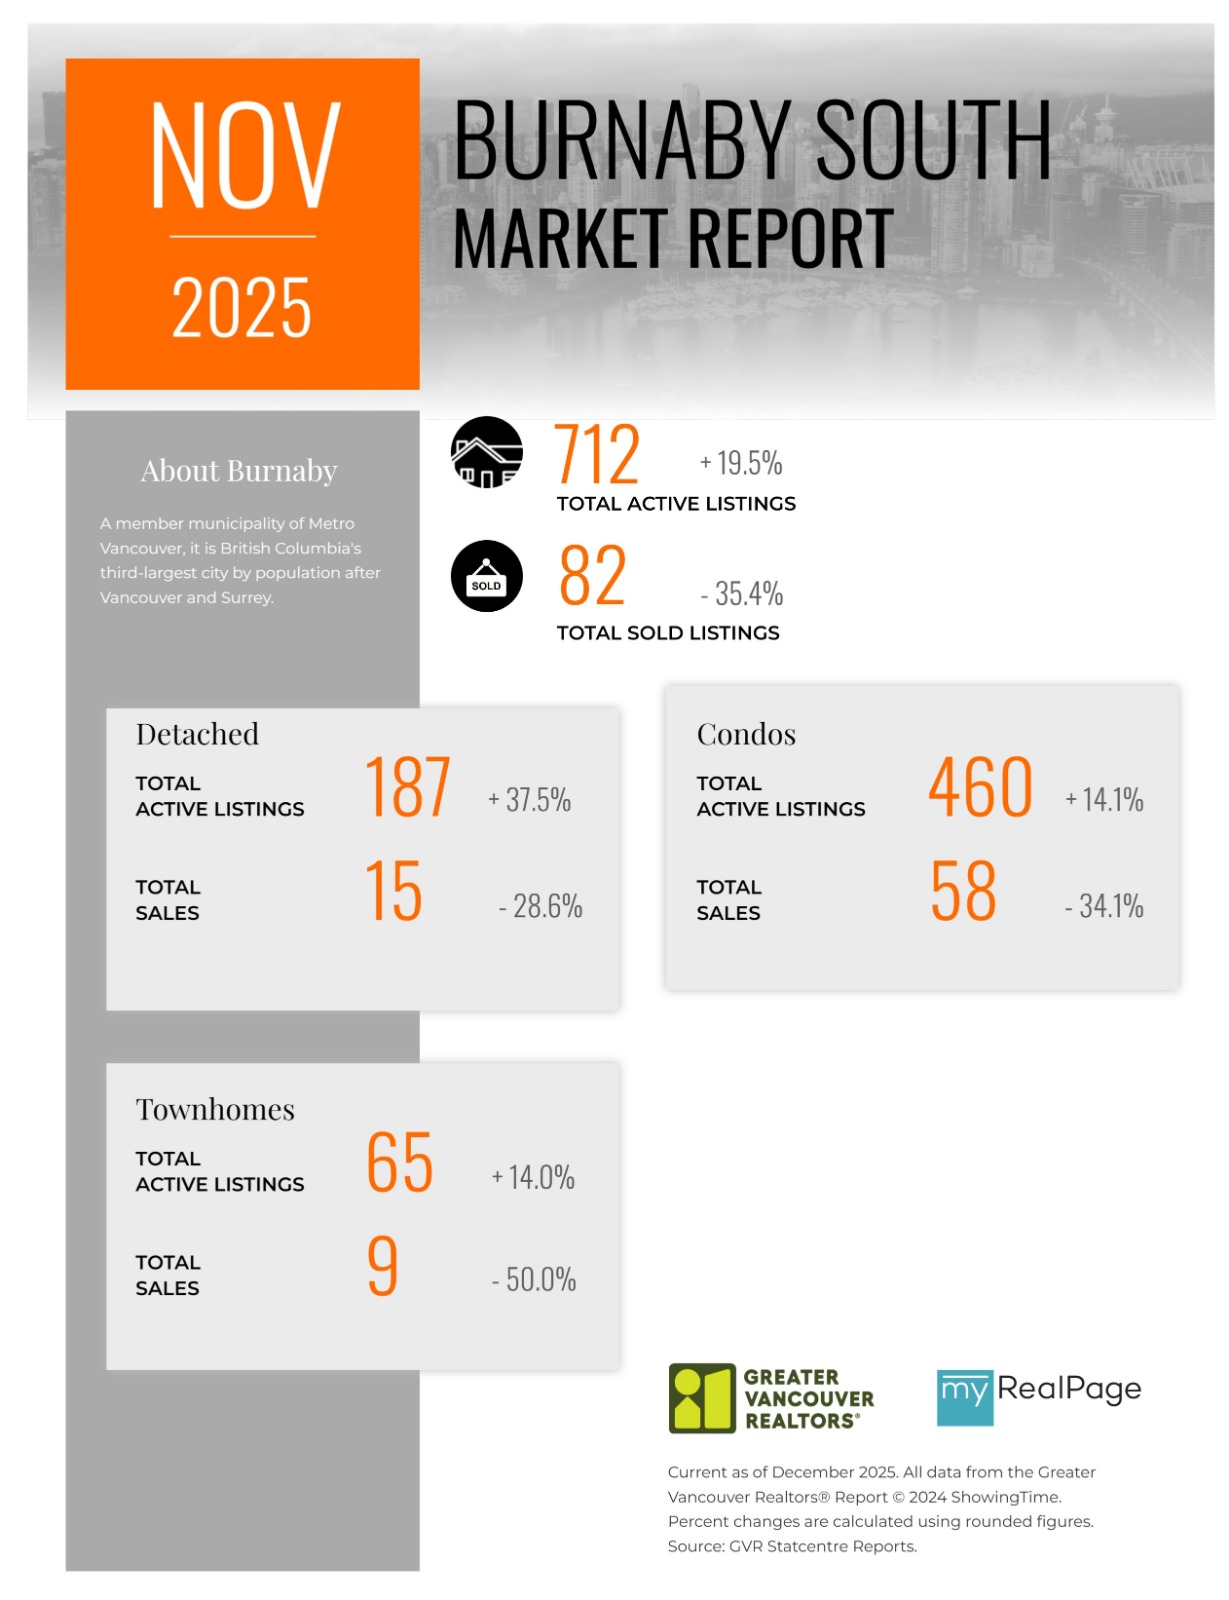
Printable Version – GVR November 2025 Data Infographics Report Burnaby South
Printable Version – GVR November 2025 Data Infographics Report Burnaby East
Printable Version – GVR November 2025 Data Infographics Report New Westminster
Printable Version – GVR November 2025 Data Infographics Report Richmond
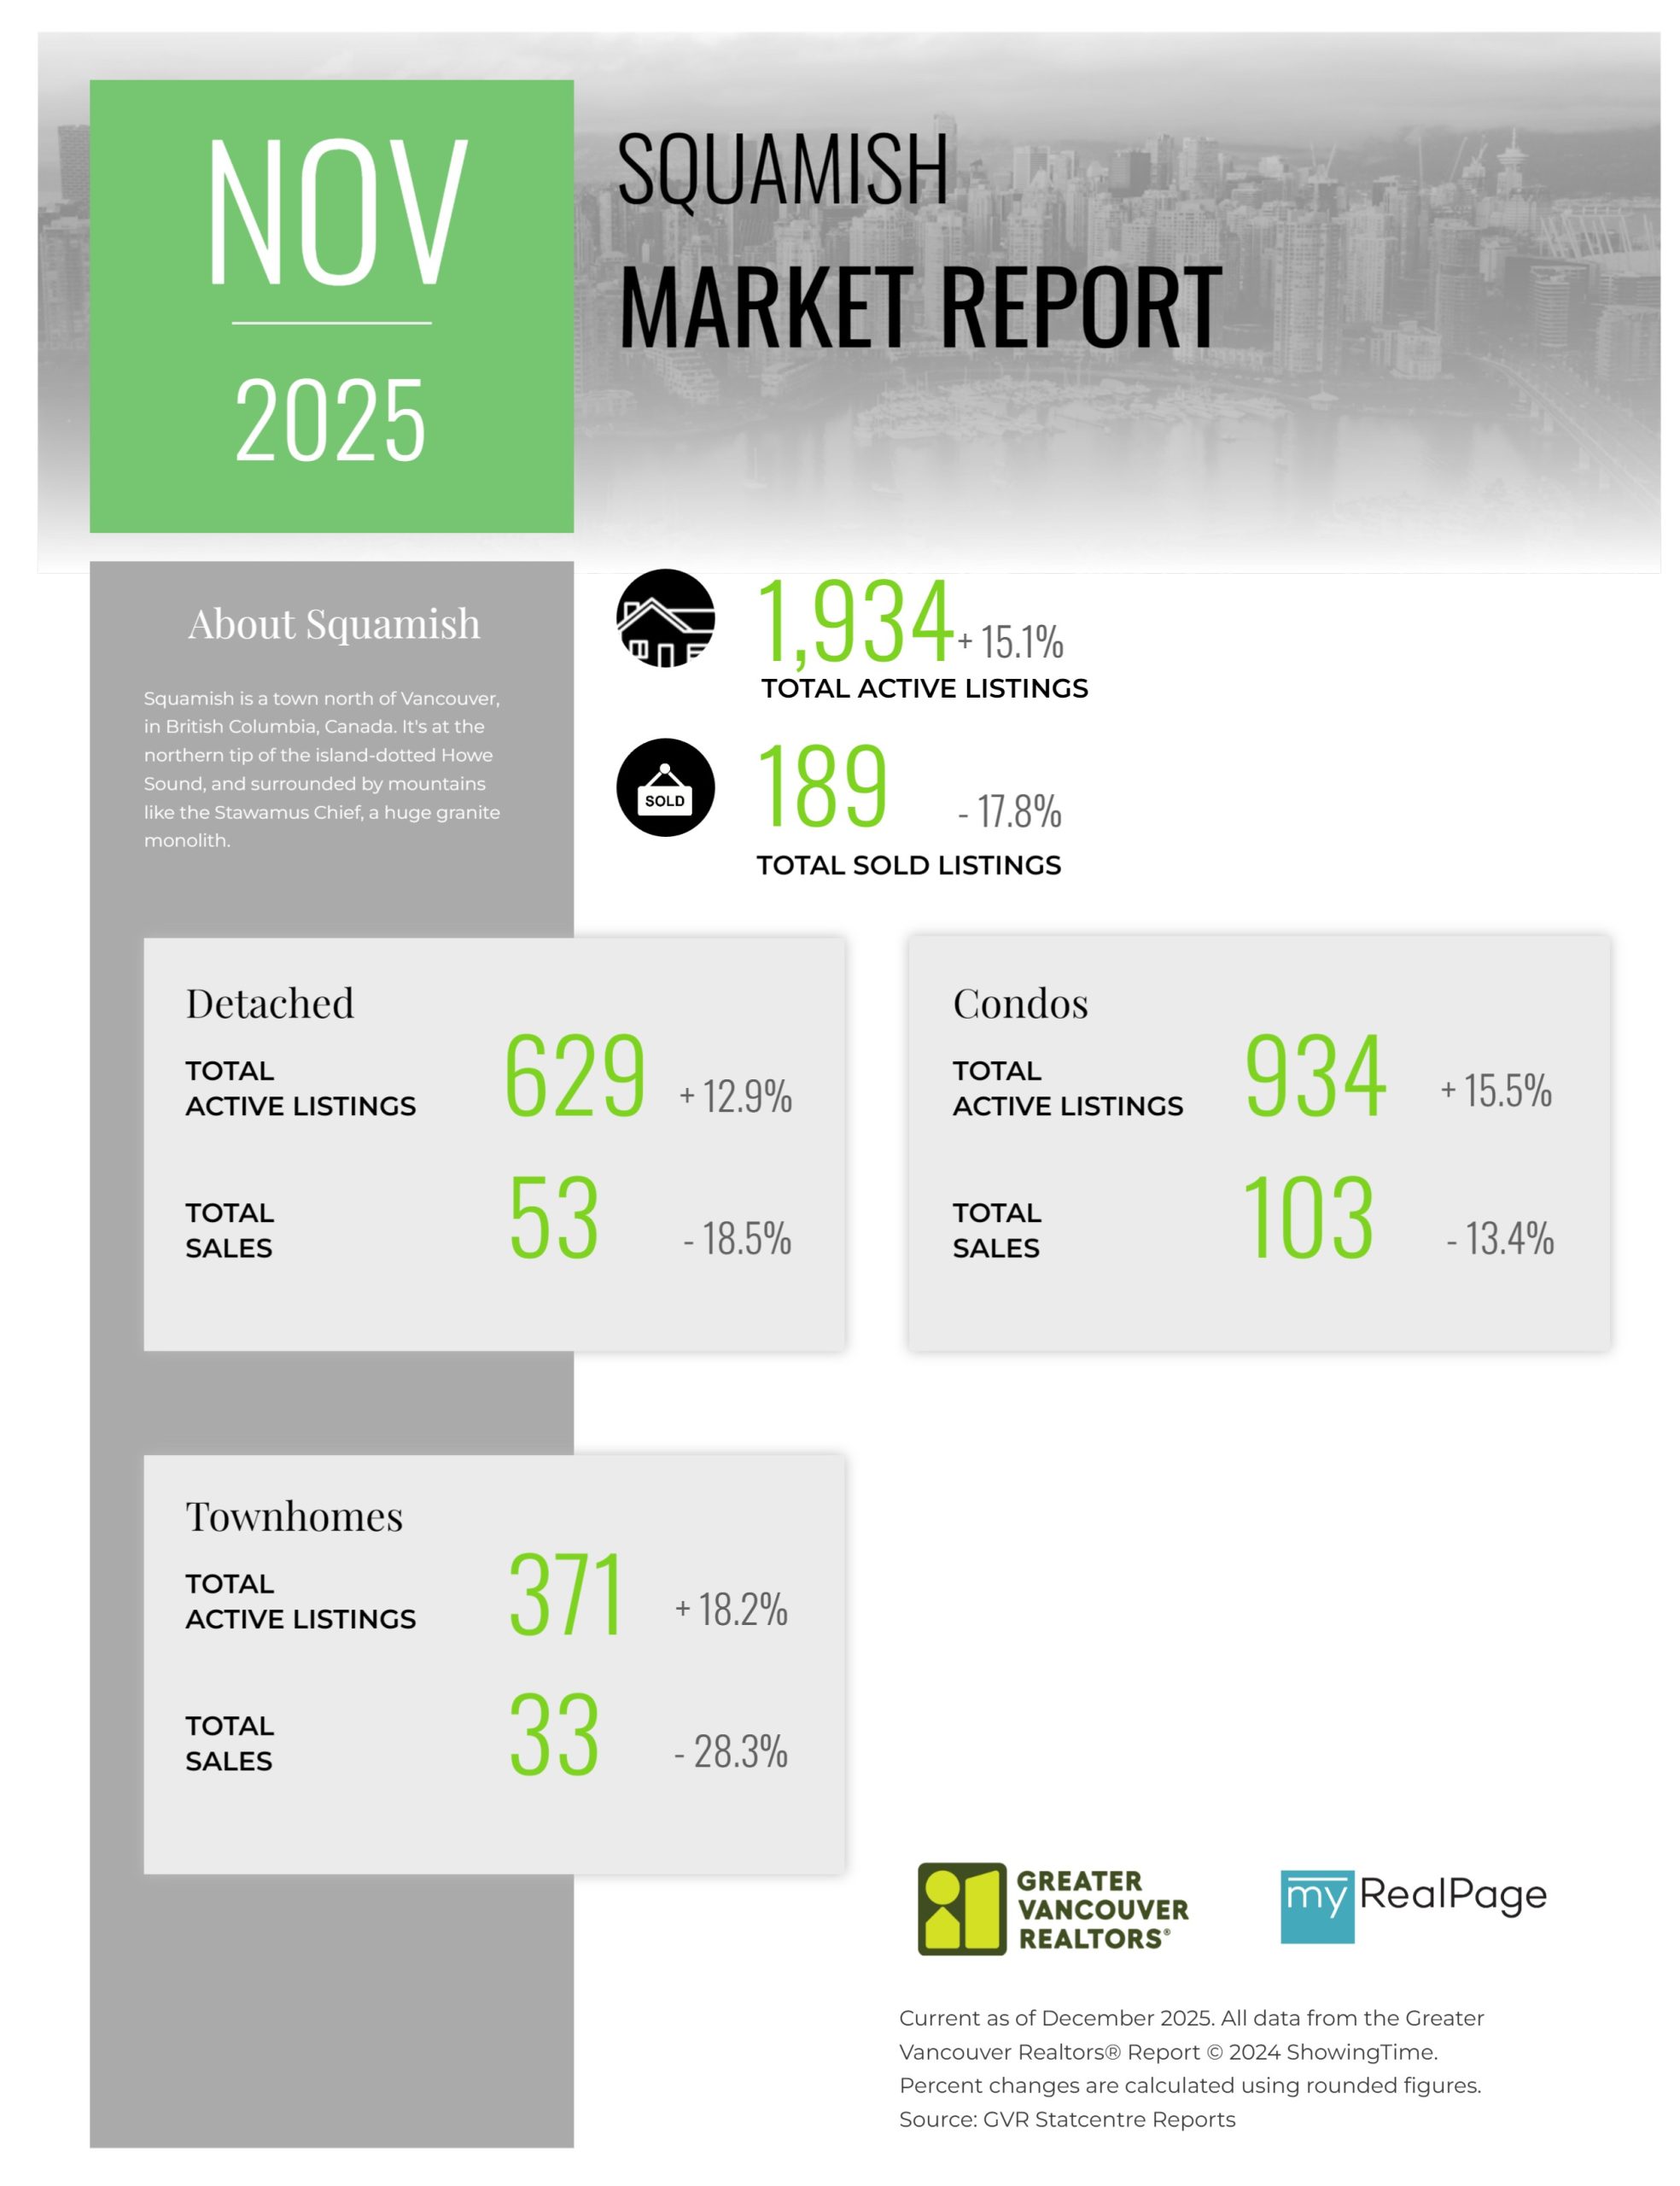
Printable Version – GVR November 2025 Data Infographics Report Squamish


INFOGRAPHICS: October 2025 GVR Greater Vancouver Market Reports
Fall market favours buyers
Another Bank of Canada rate cut and easing prices helped home sales registered on the MLS® in Metro Vancouver edge higher relative to October last year.
The Greater Vancouver REALTORS® (GVR) reports that residential sales in the region totalled 1,875 in October 2025, a 1.2 per cent increase from the 1,852 sales recorded in October 2024. This was 20.1 per cent below the 10-year seasonal average (2,348).
“With another cut to Bank of Canada’s policy rate behind us, and markets pricing in at least one more cut by the end of the year, Metro Vancouver homebuyers have reason to be optimistic about the fall market. Easing prices, near-record high inventory levels, and increasingly favourable borrowing costs are offering those looking to purchase a home this fall with plenty of opportunity.” said Andrew Lis, GVR director of economics and data analytics
Read the full report on the REBGV website!
The following data is a comparison between October 2025 and October 2024 numbers, and is current as of November of 2025. For last month’s update, you can check out our previous post!
Or follow this link for all our GVR Infographics!
These infographics cover current trends in several areas within the Greater Vancouver region. Click on the images for a larger view!
Printable Version – GVR October 2025 Data Infographic Report North Vancouver
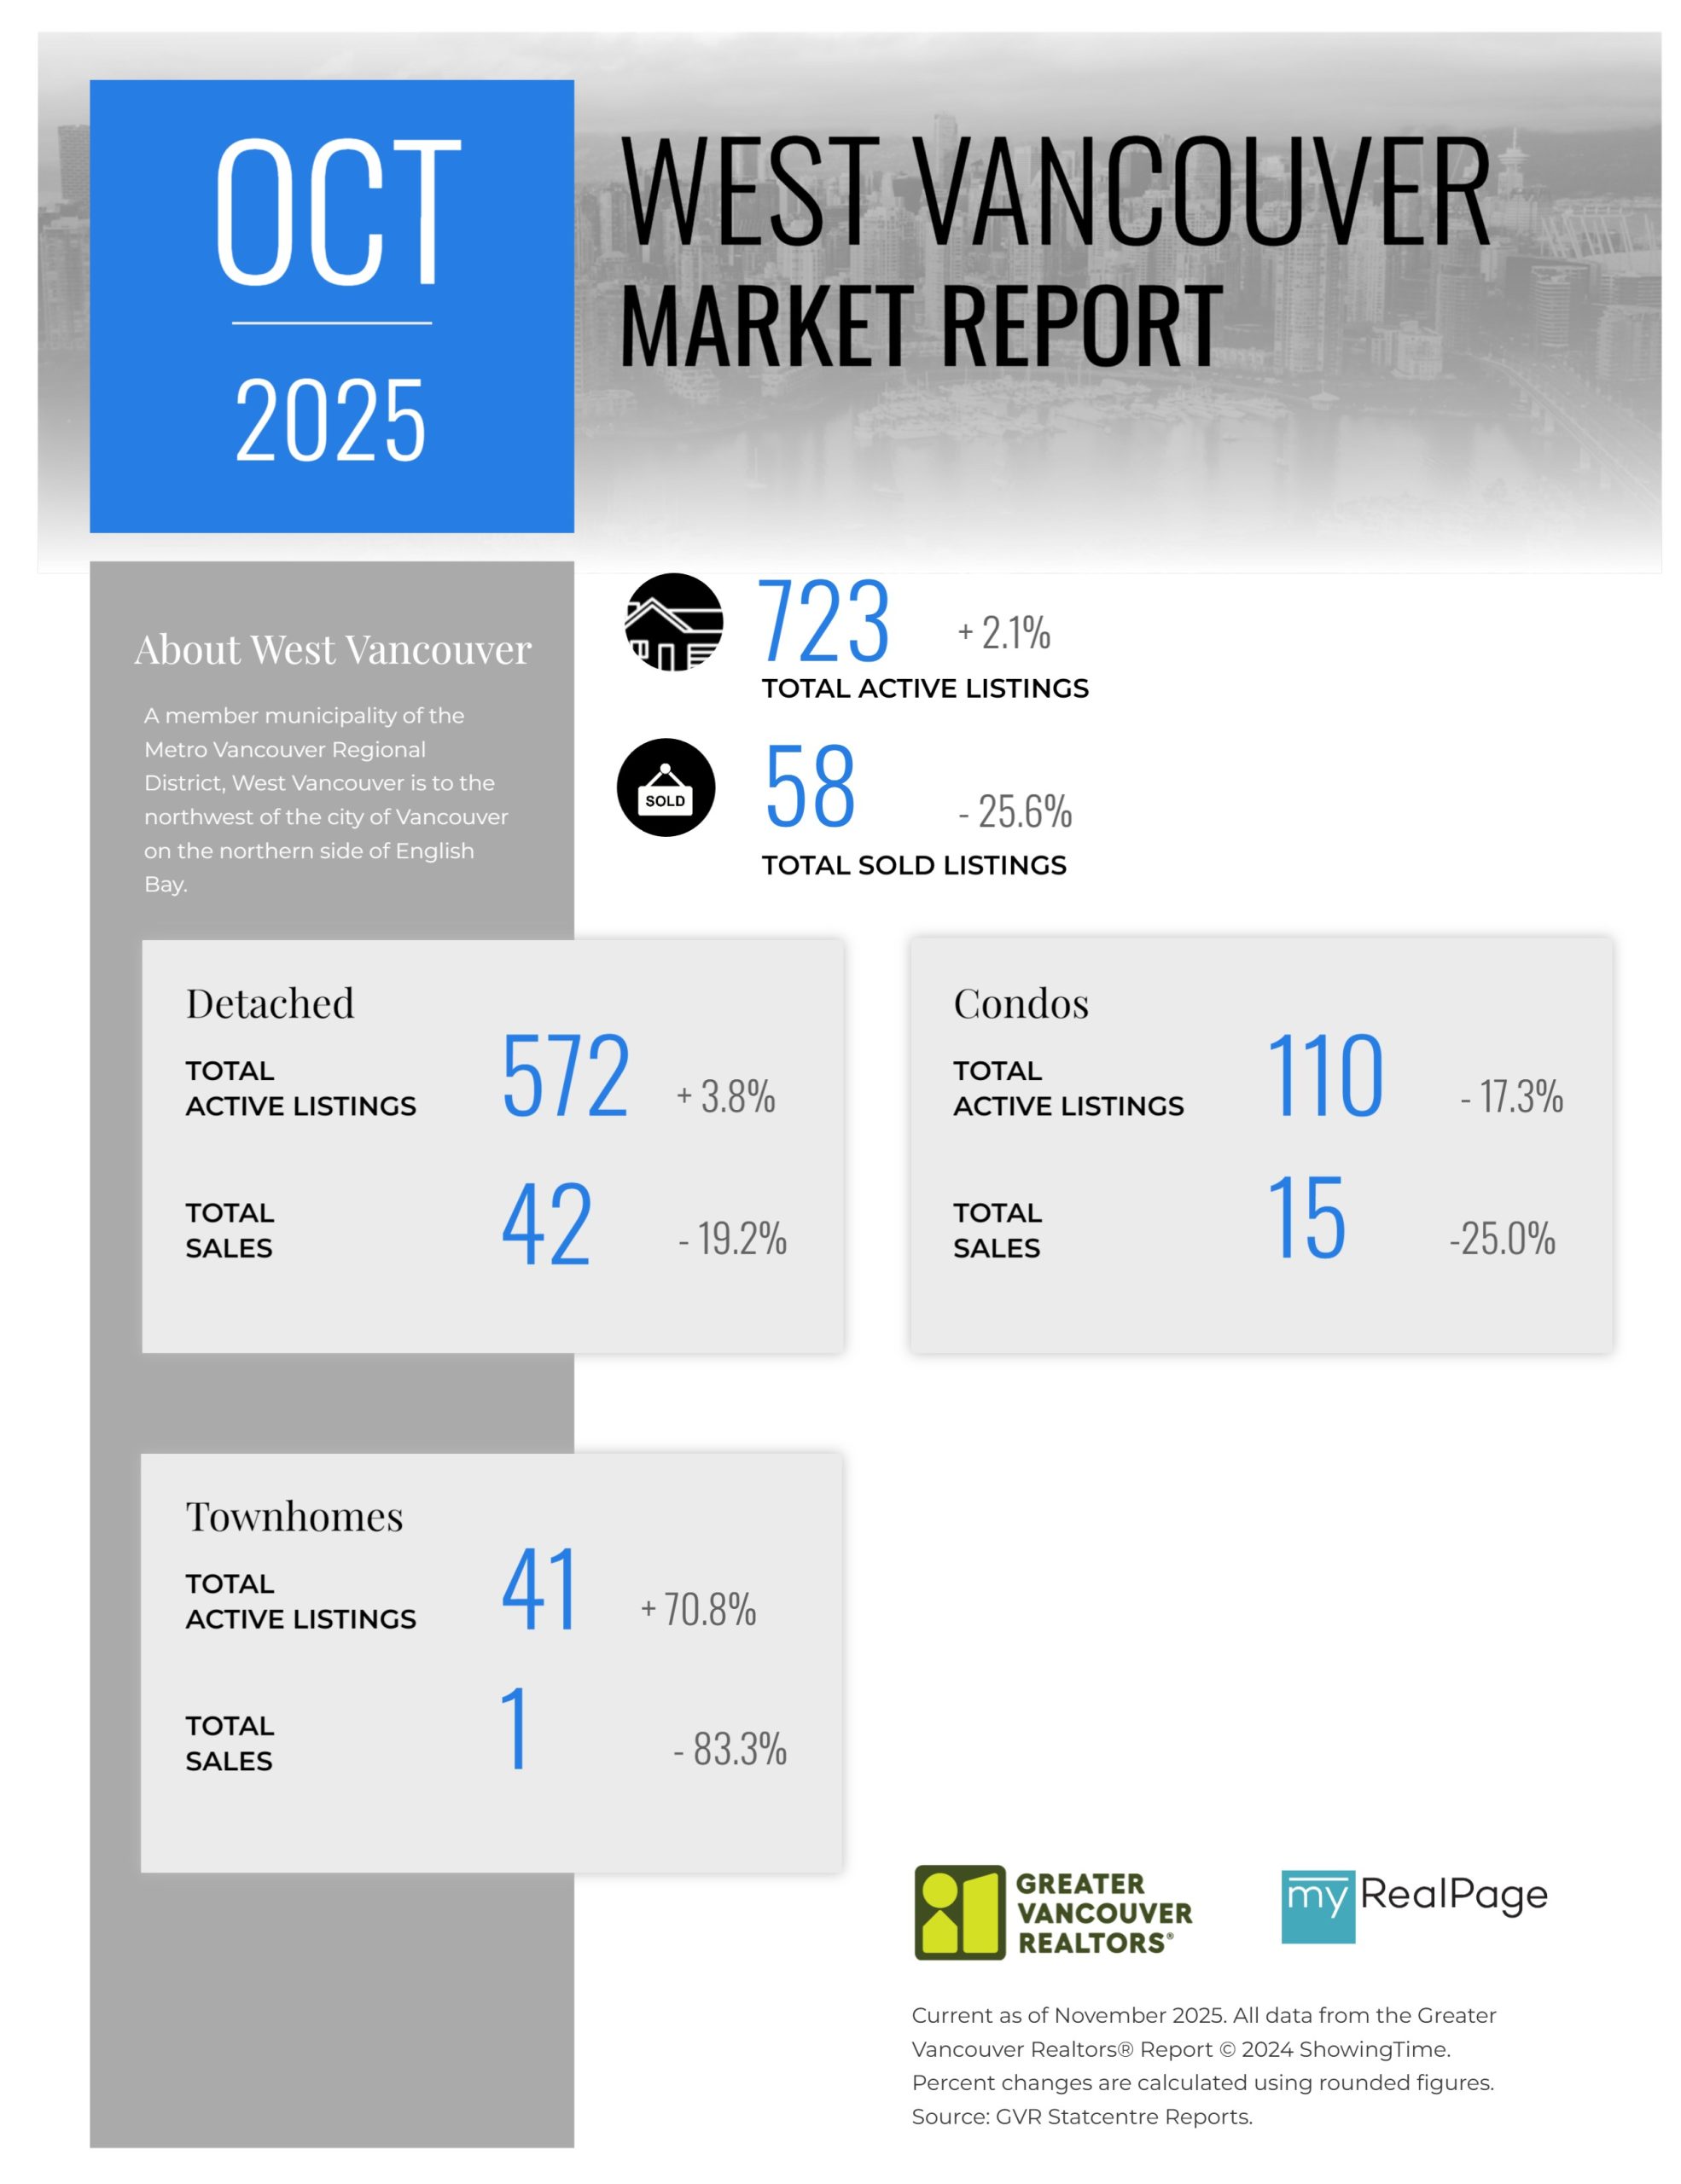
Printable Version – GVR October 2025 Data Infographics Report West Vancouver
Printable Version – GVR October 2025 Data Infographics Report Vancouver West
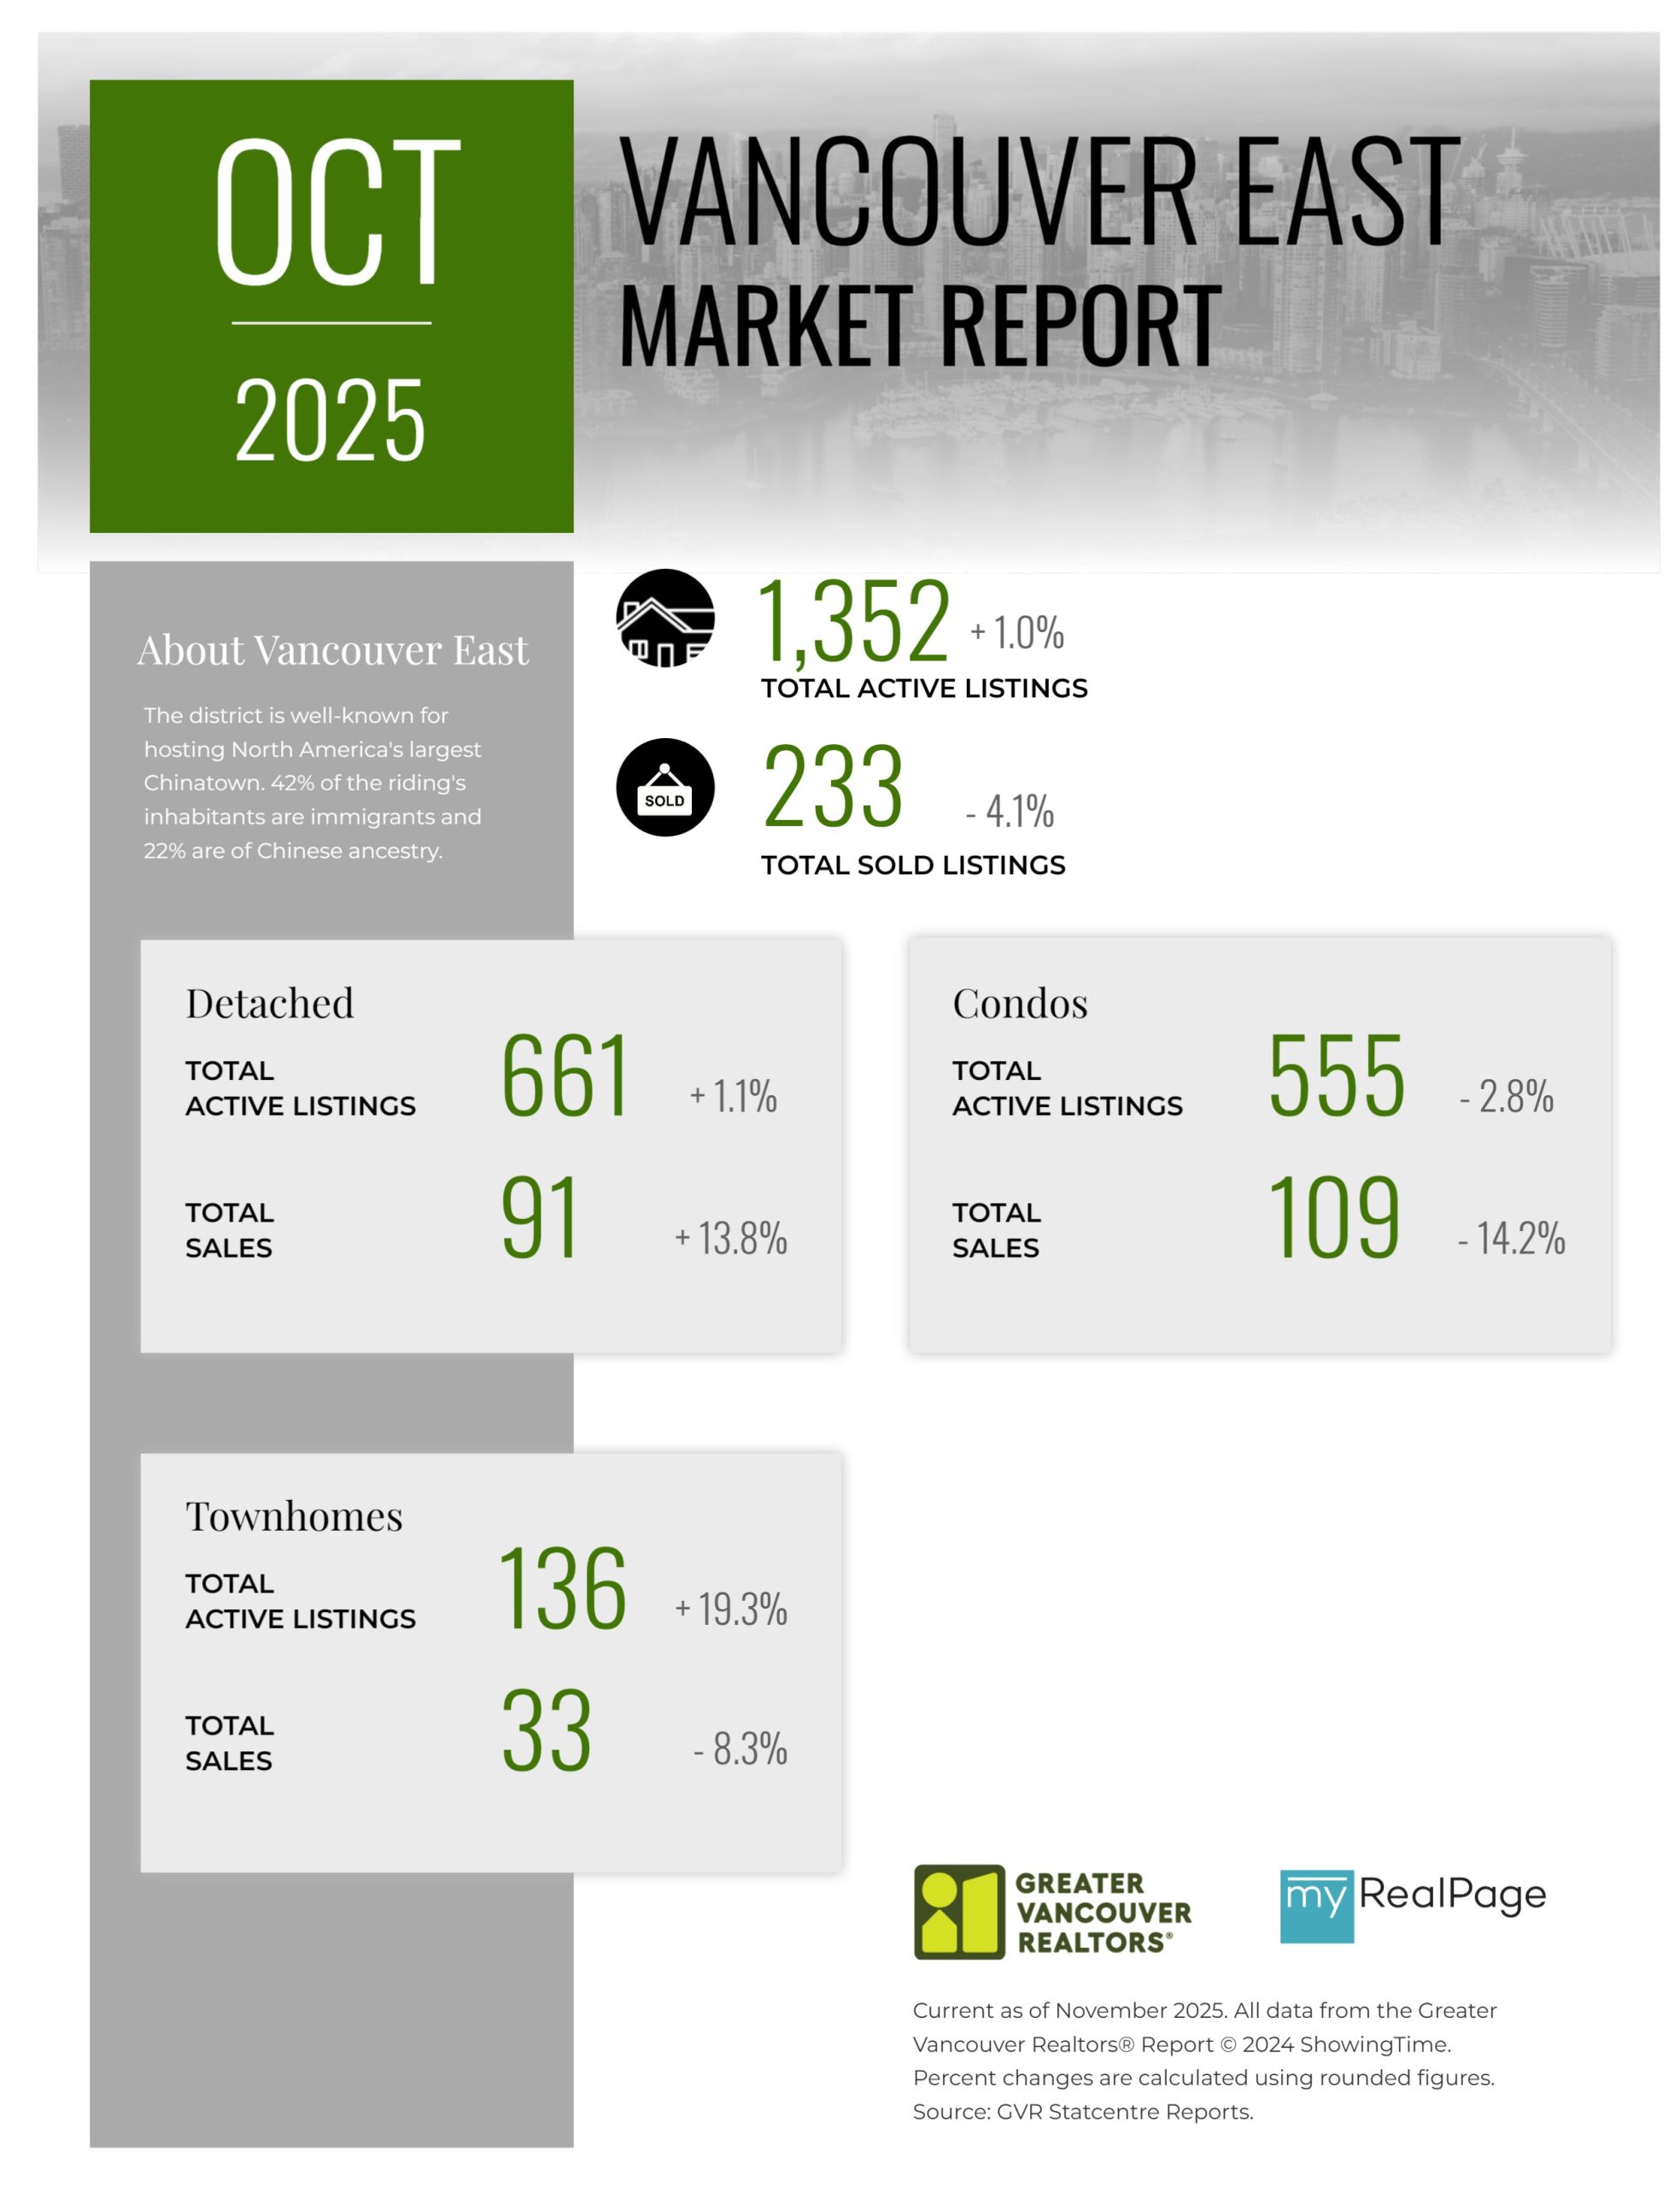
Printable Version – GVR October 2025 Data Infographics Report Vancouver East
Printable Version – GVR October 2025 Data Infographic Report Maple Ridge
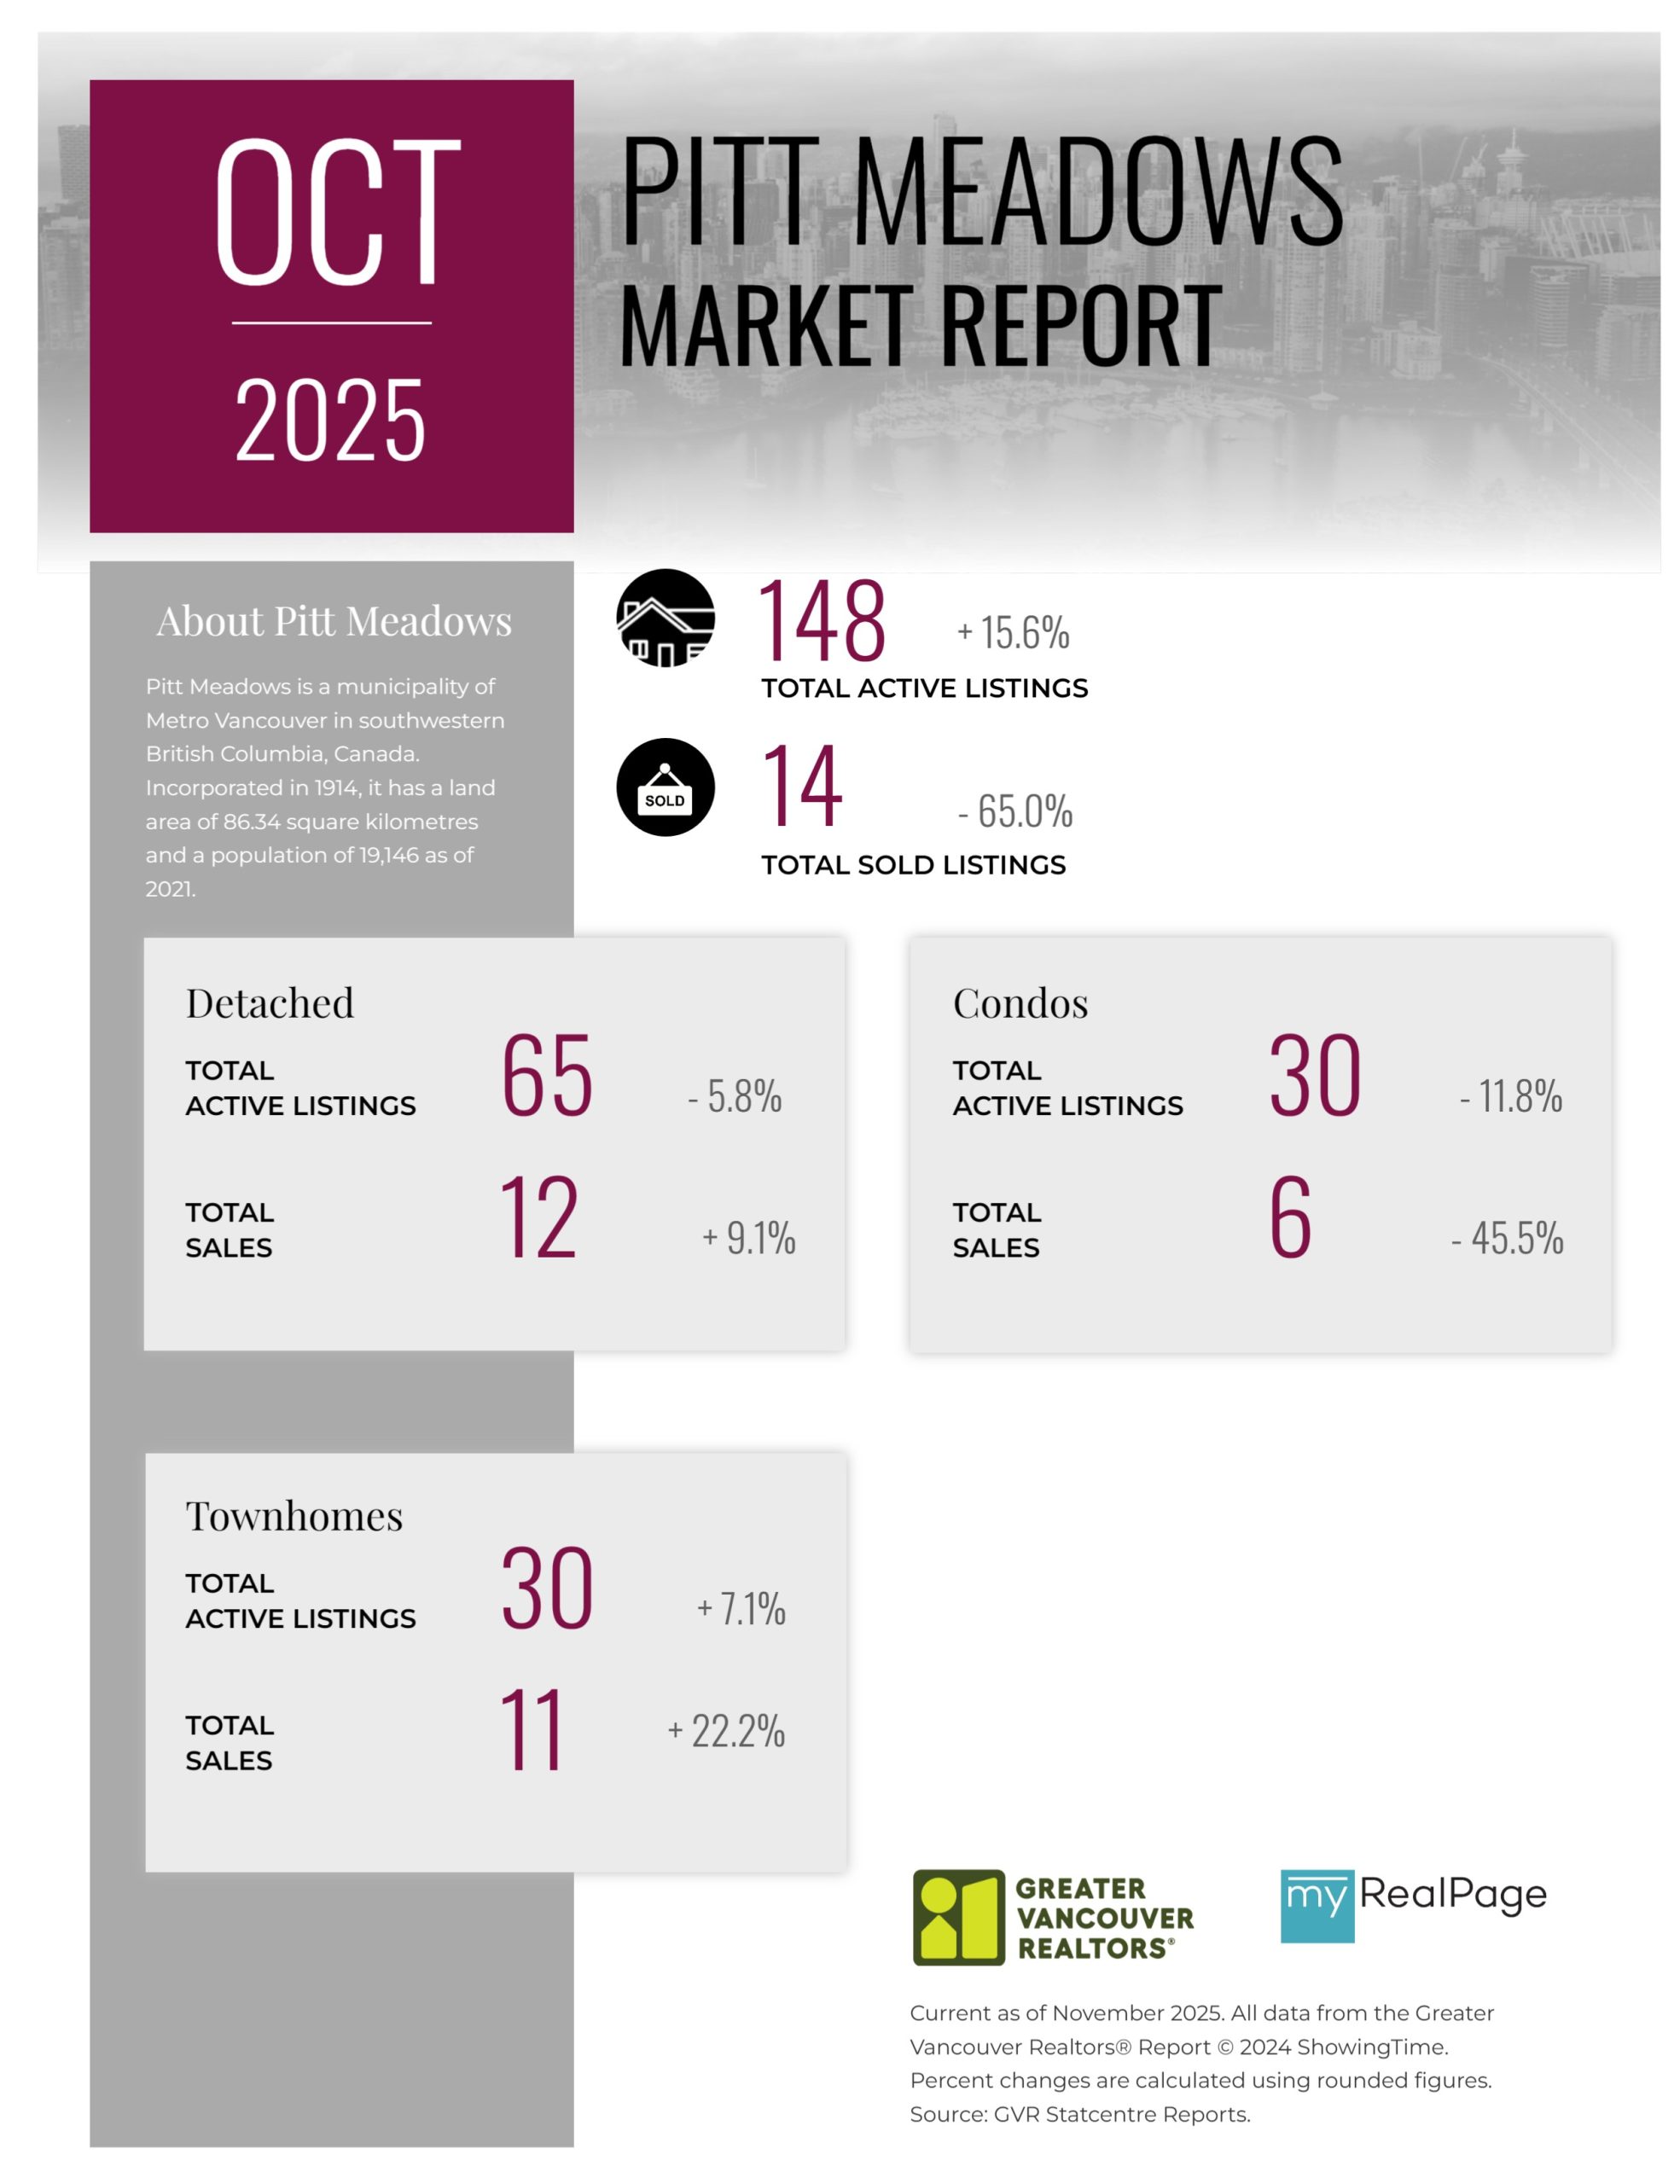
Printable Version – GVR October 2025 Data Infographics Report Pitt Meadows
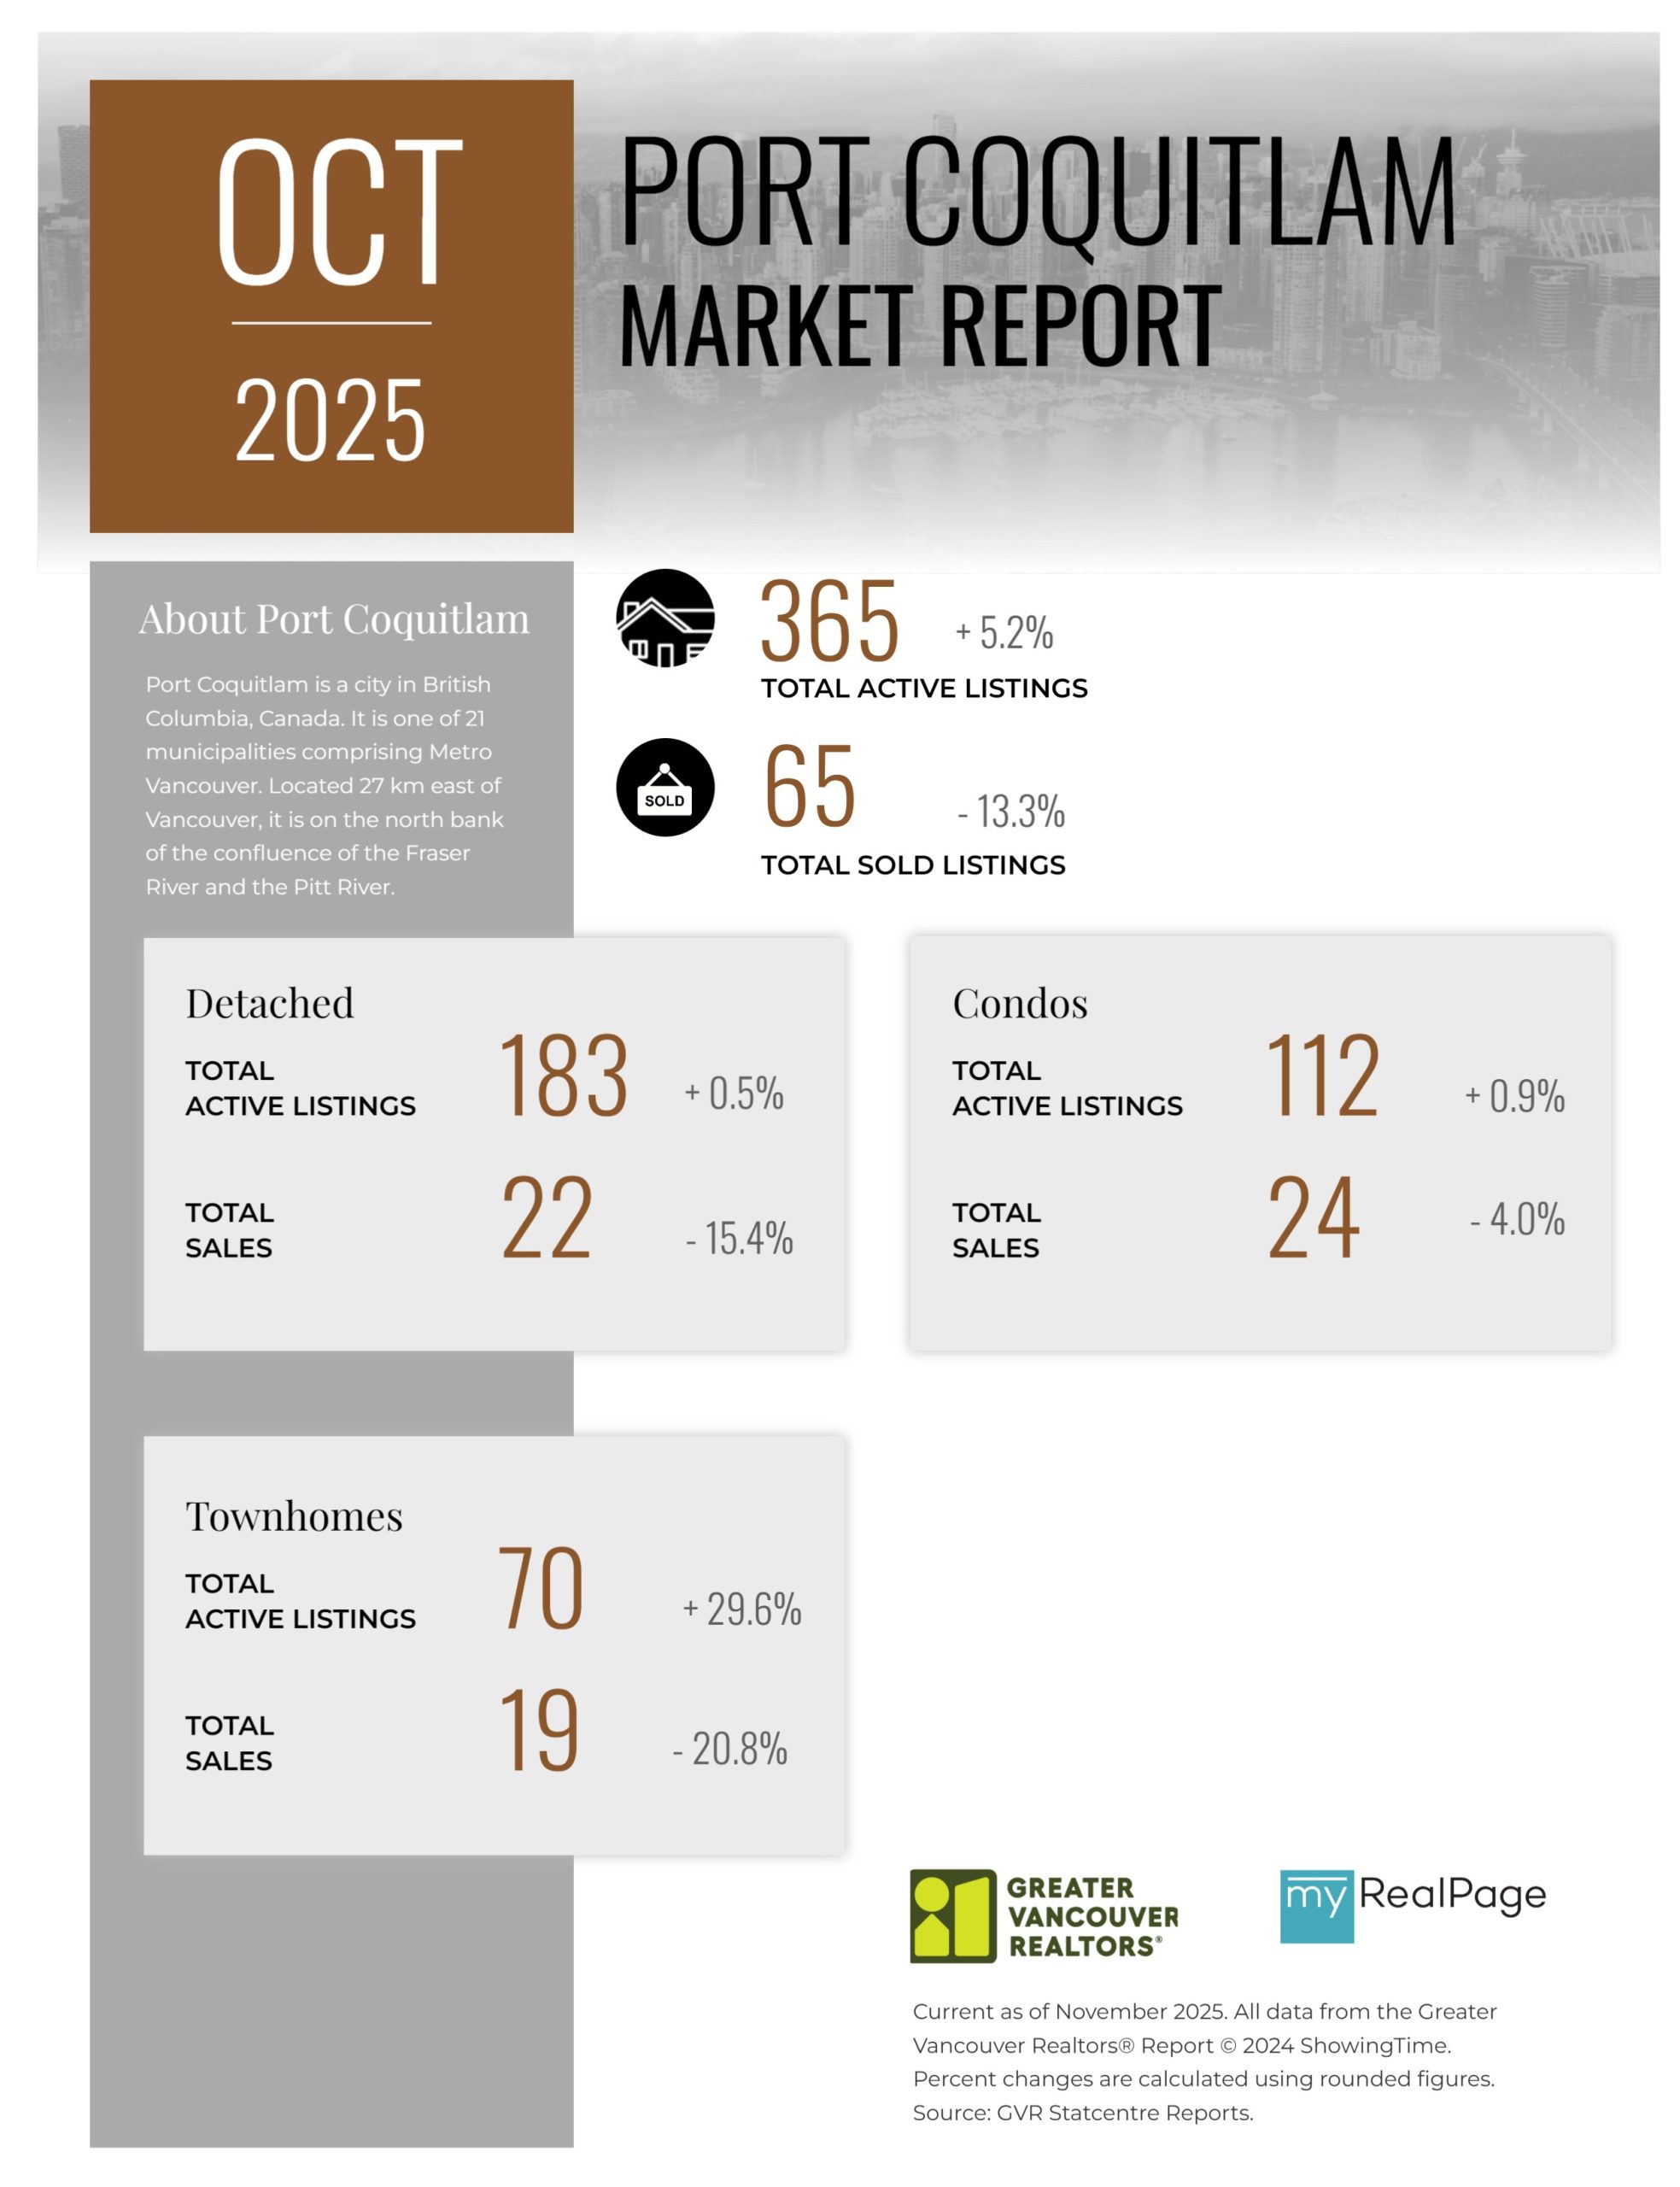
Printable Version – GVR October 2025 Data Infographics Report Port Coquitlam
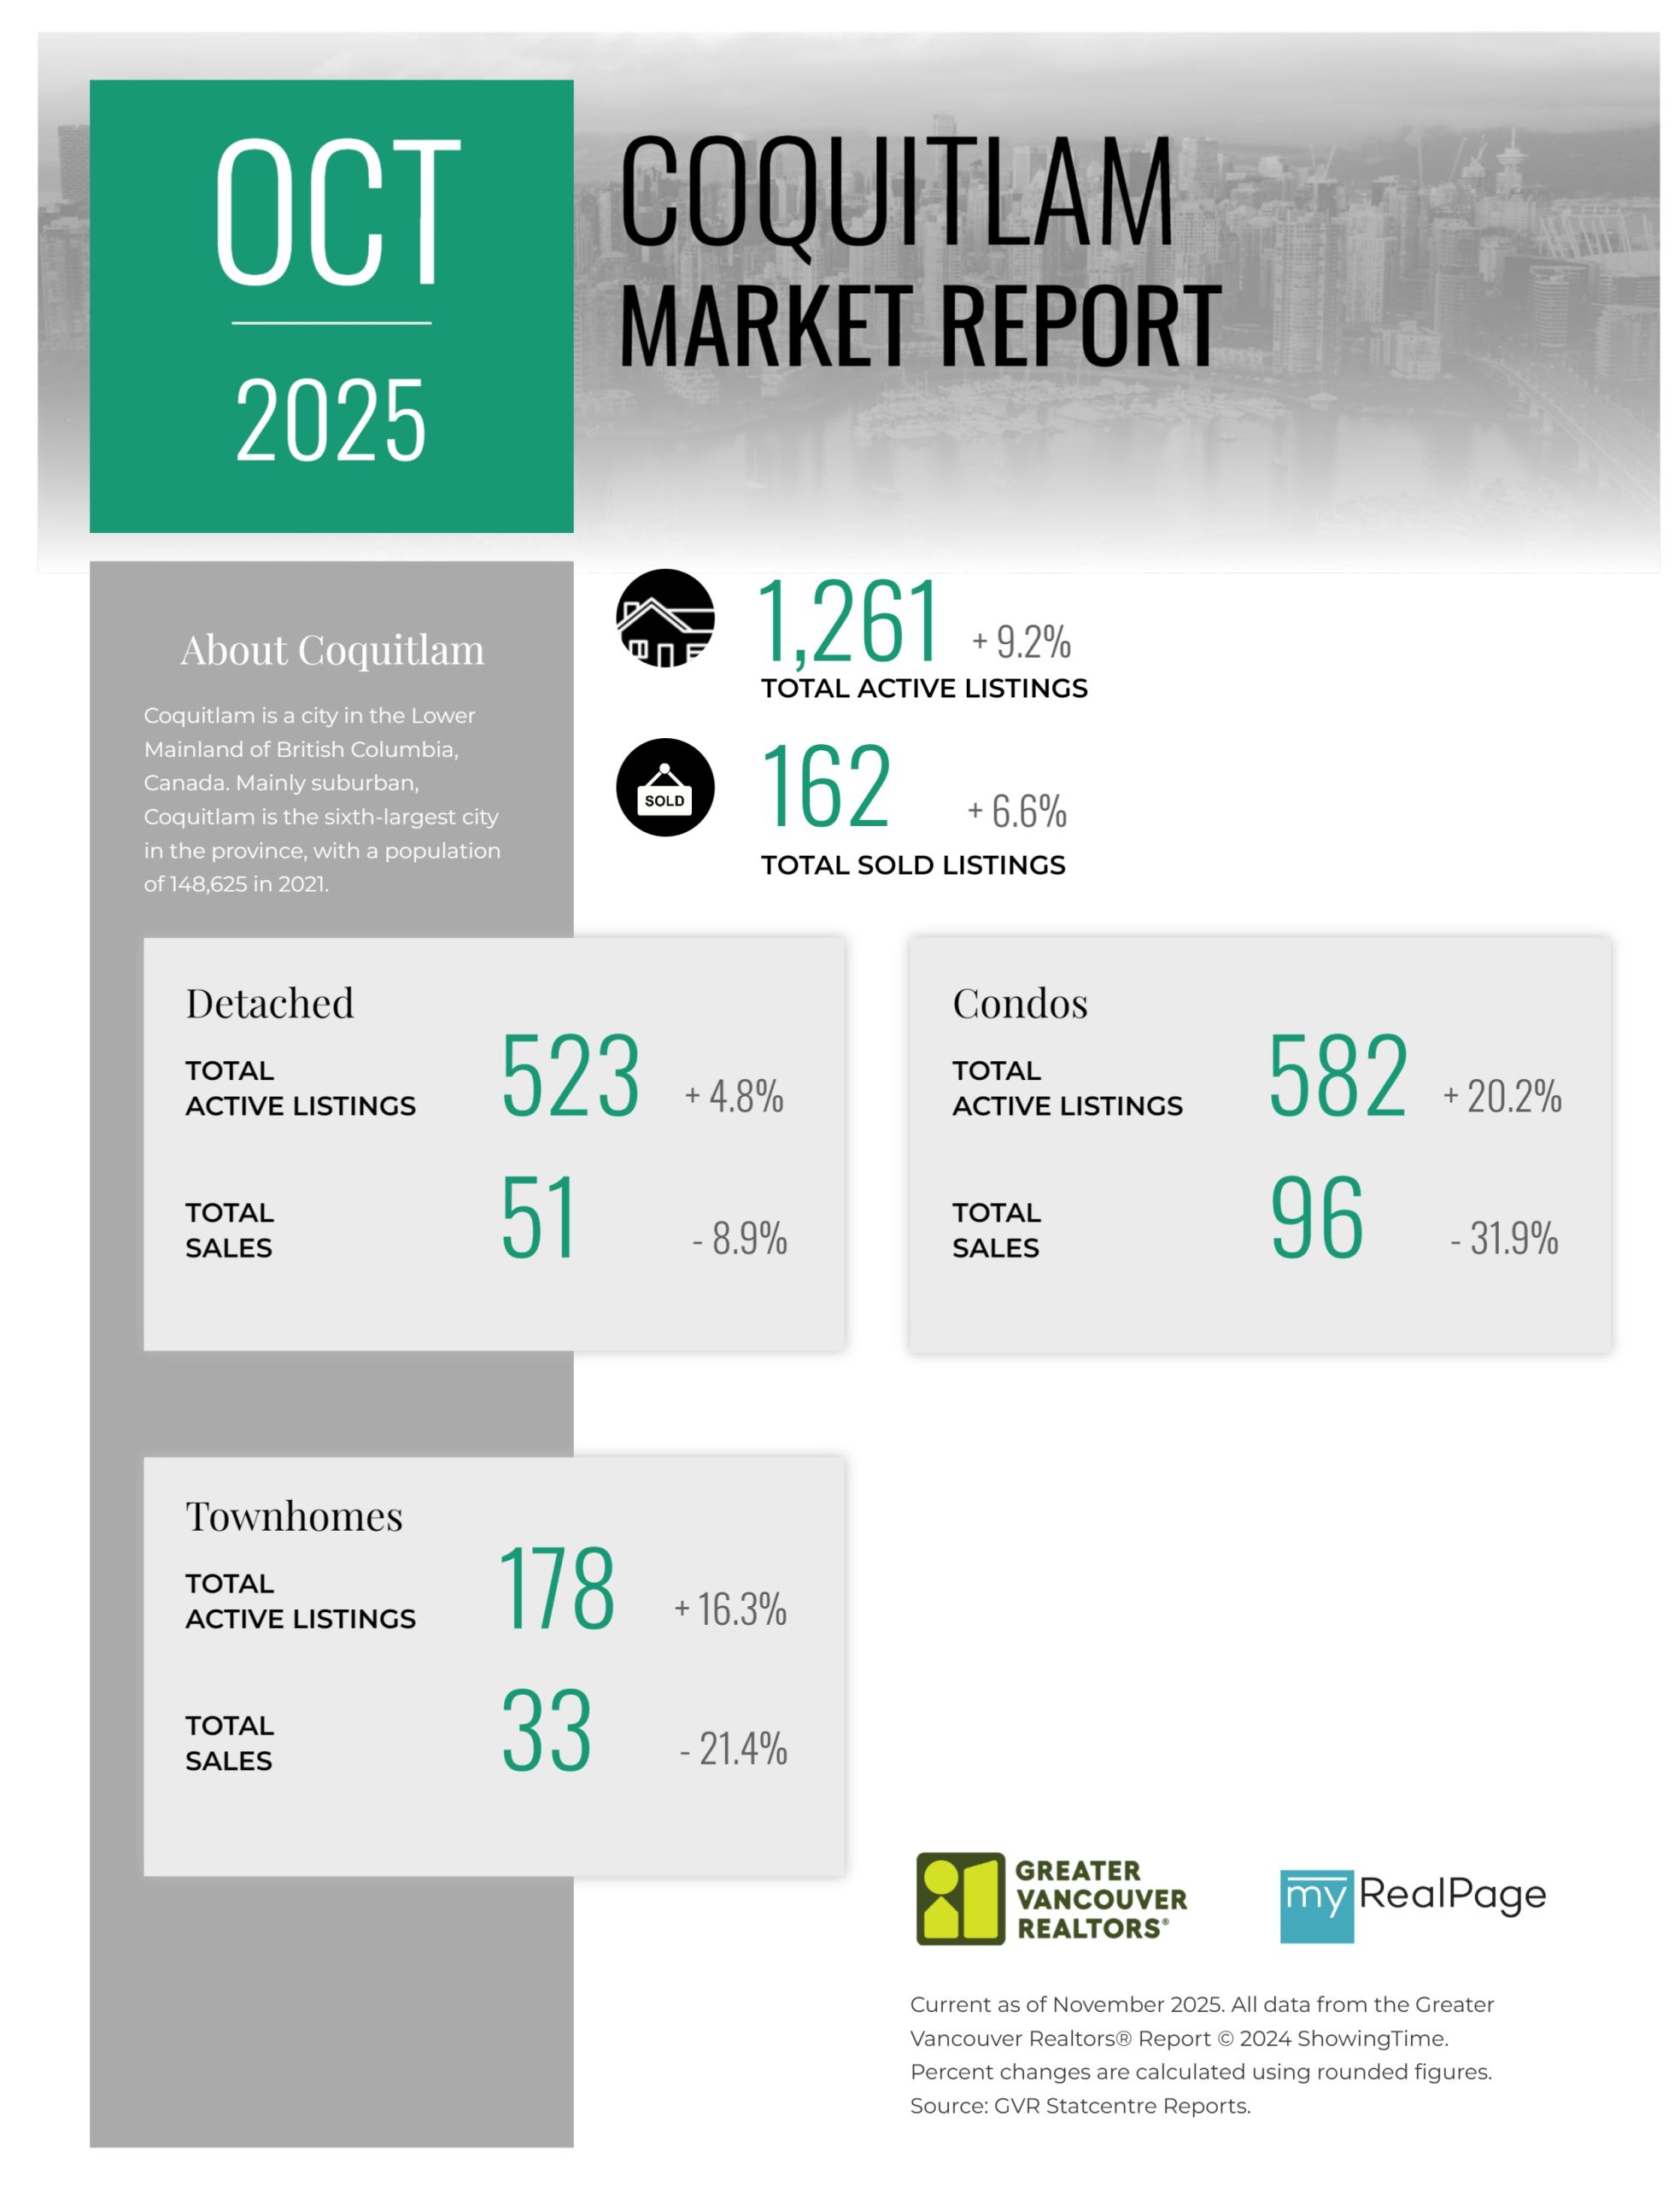
Printable Version – GVR October 2025 Data Infographics Report Coquitlam
Printable Version – GVR October 2025 Data Infographic Report Burnaby North
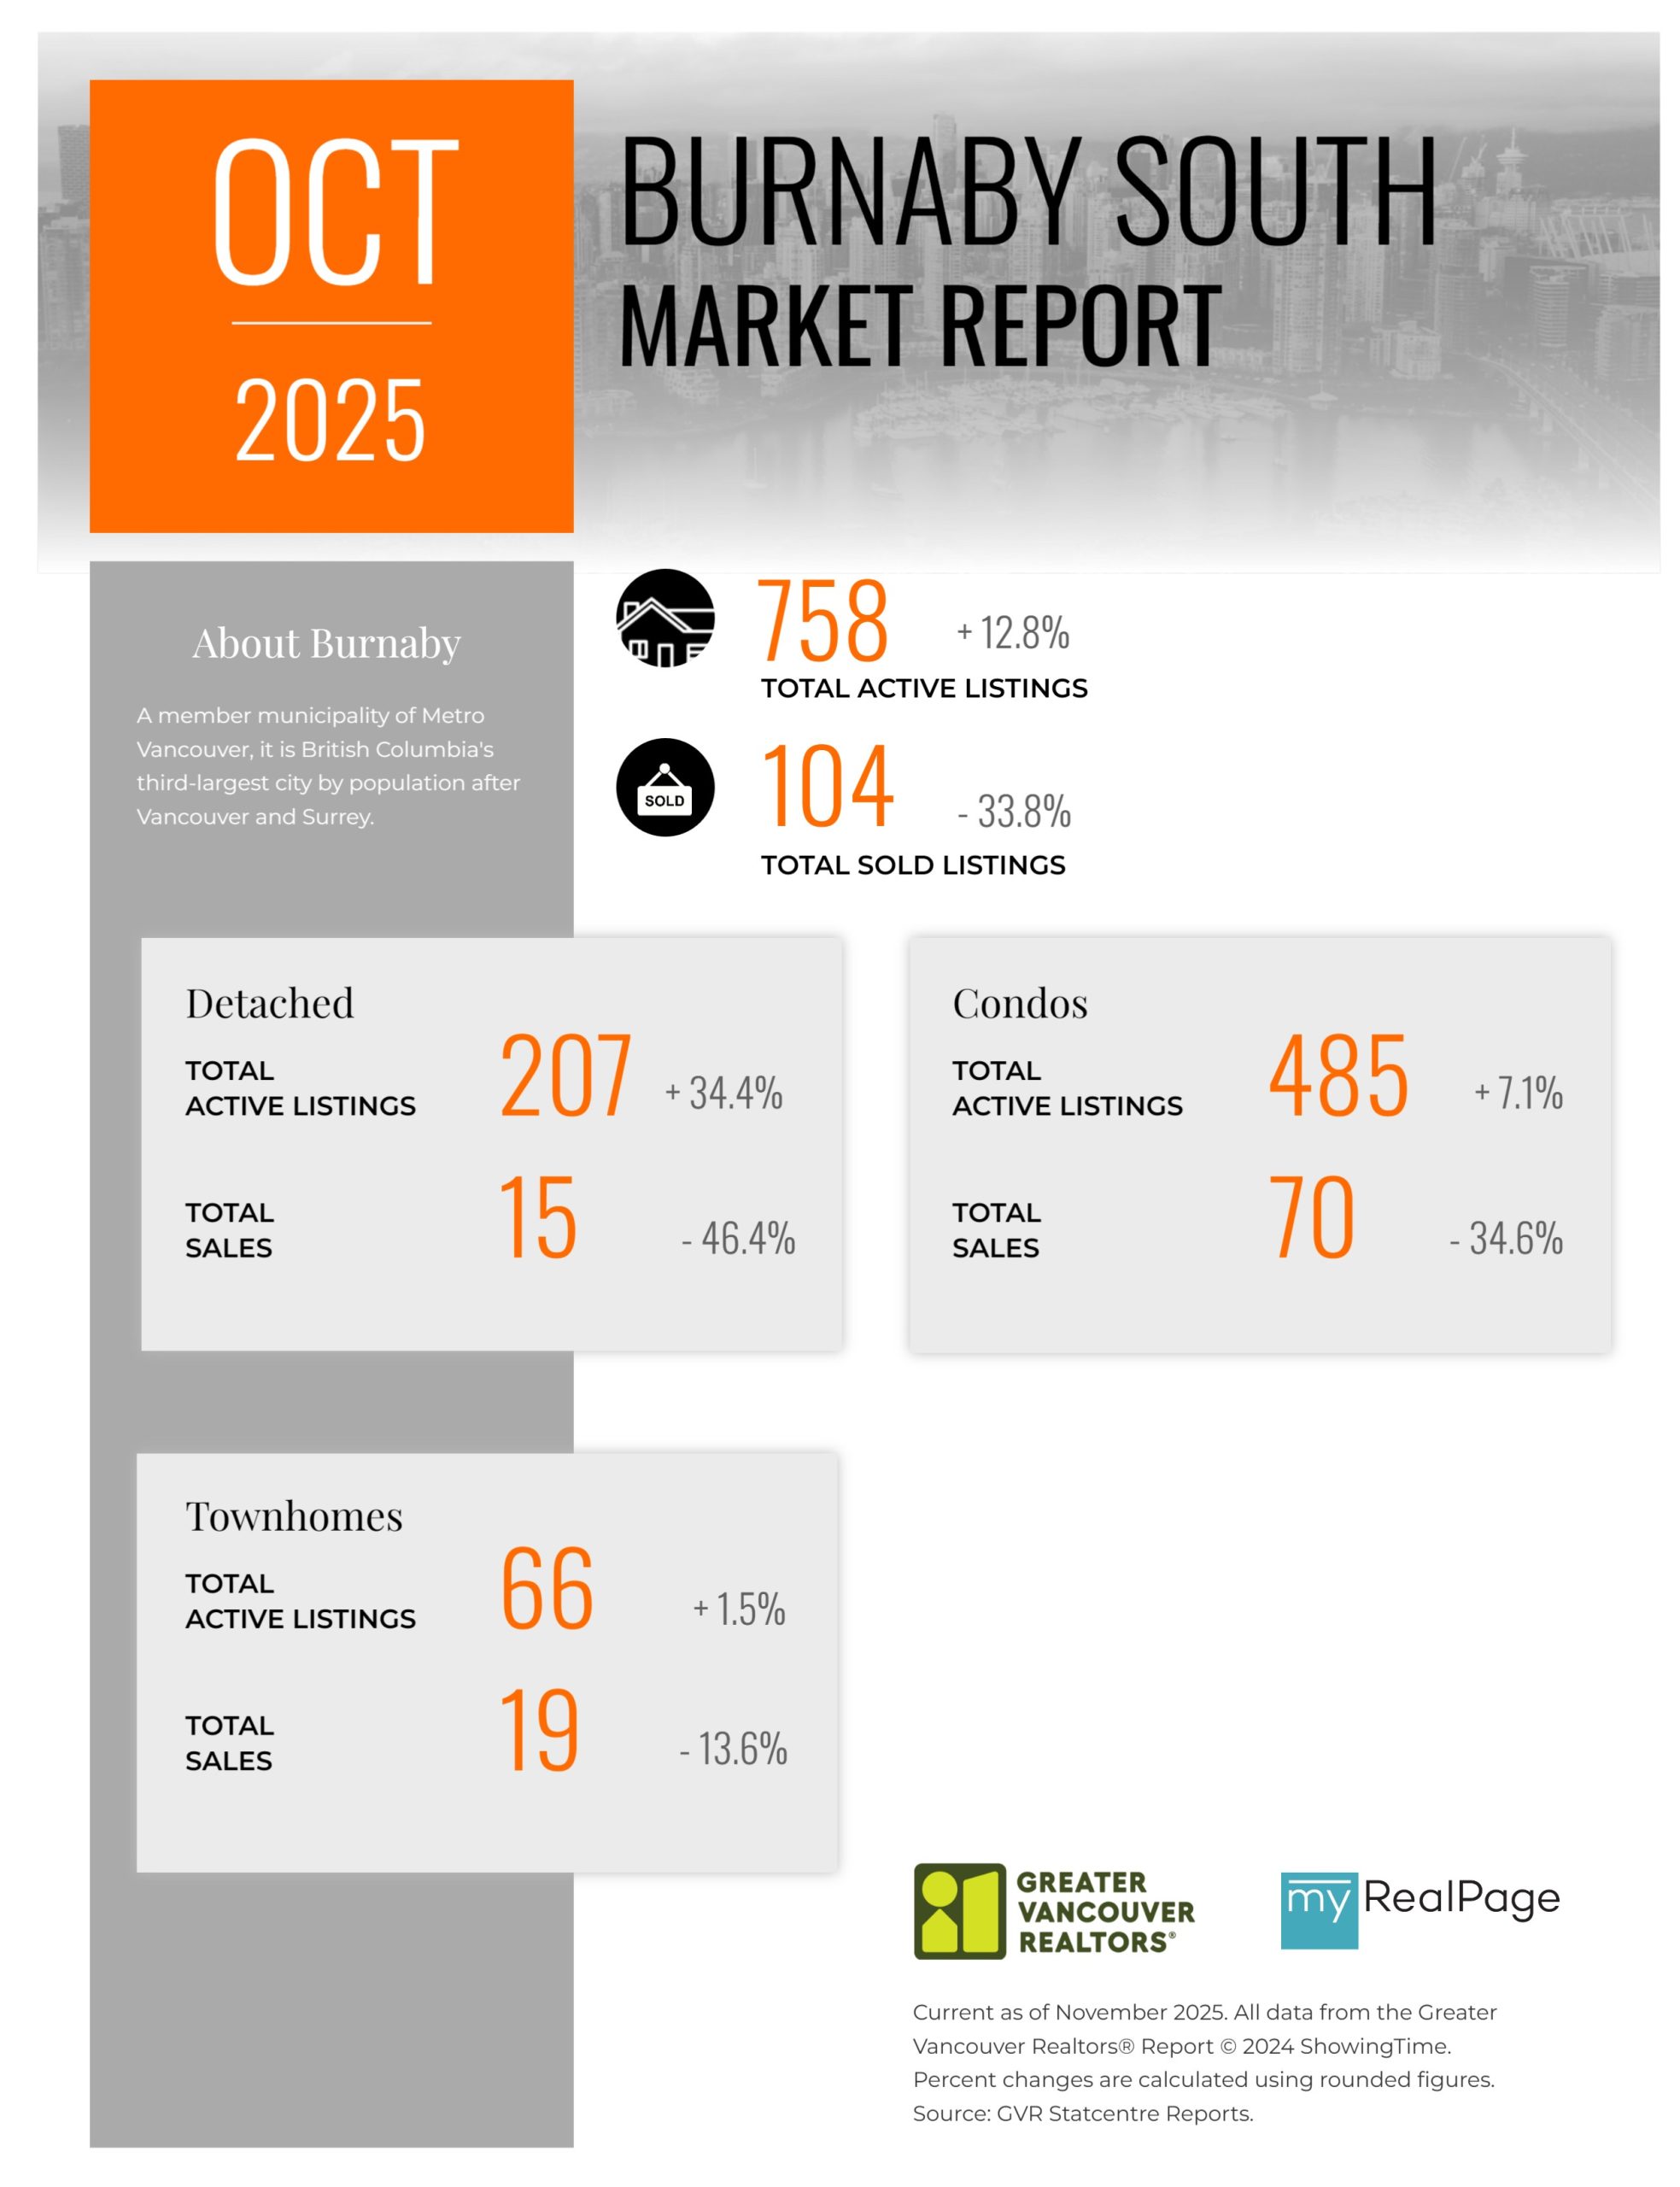
Printable Version – GVR October 2025 Data Infographics Report Burnaby South
Printable Version – GVR October 2025 Data Infographics Report Burnaby East
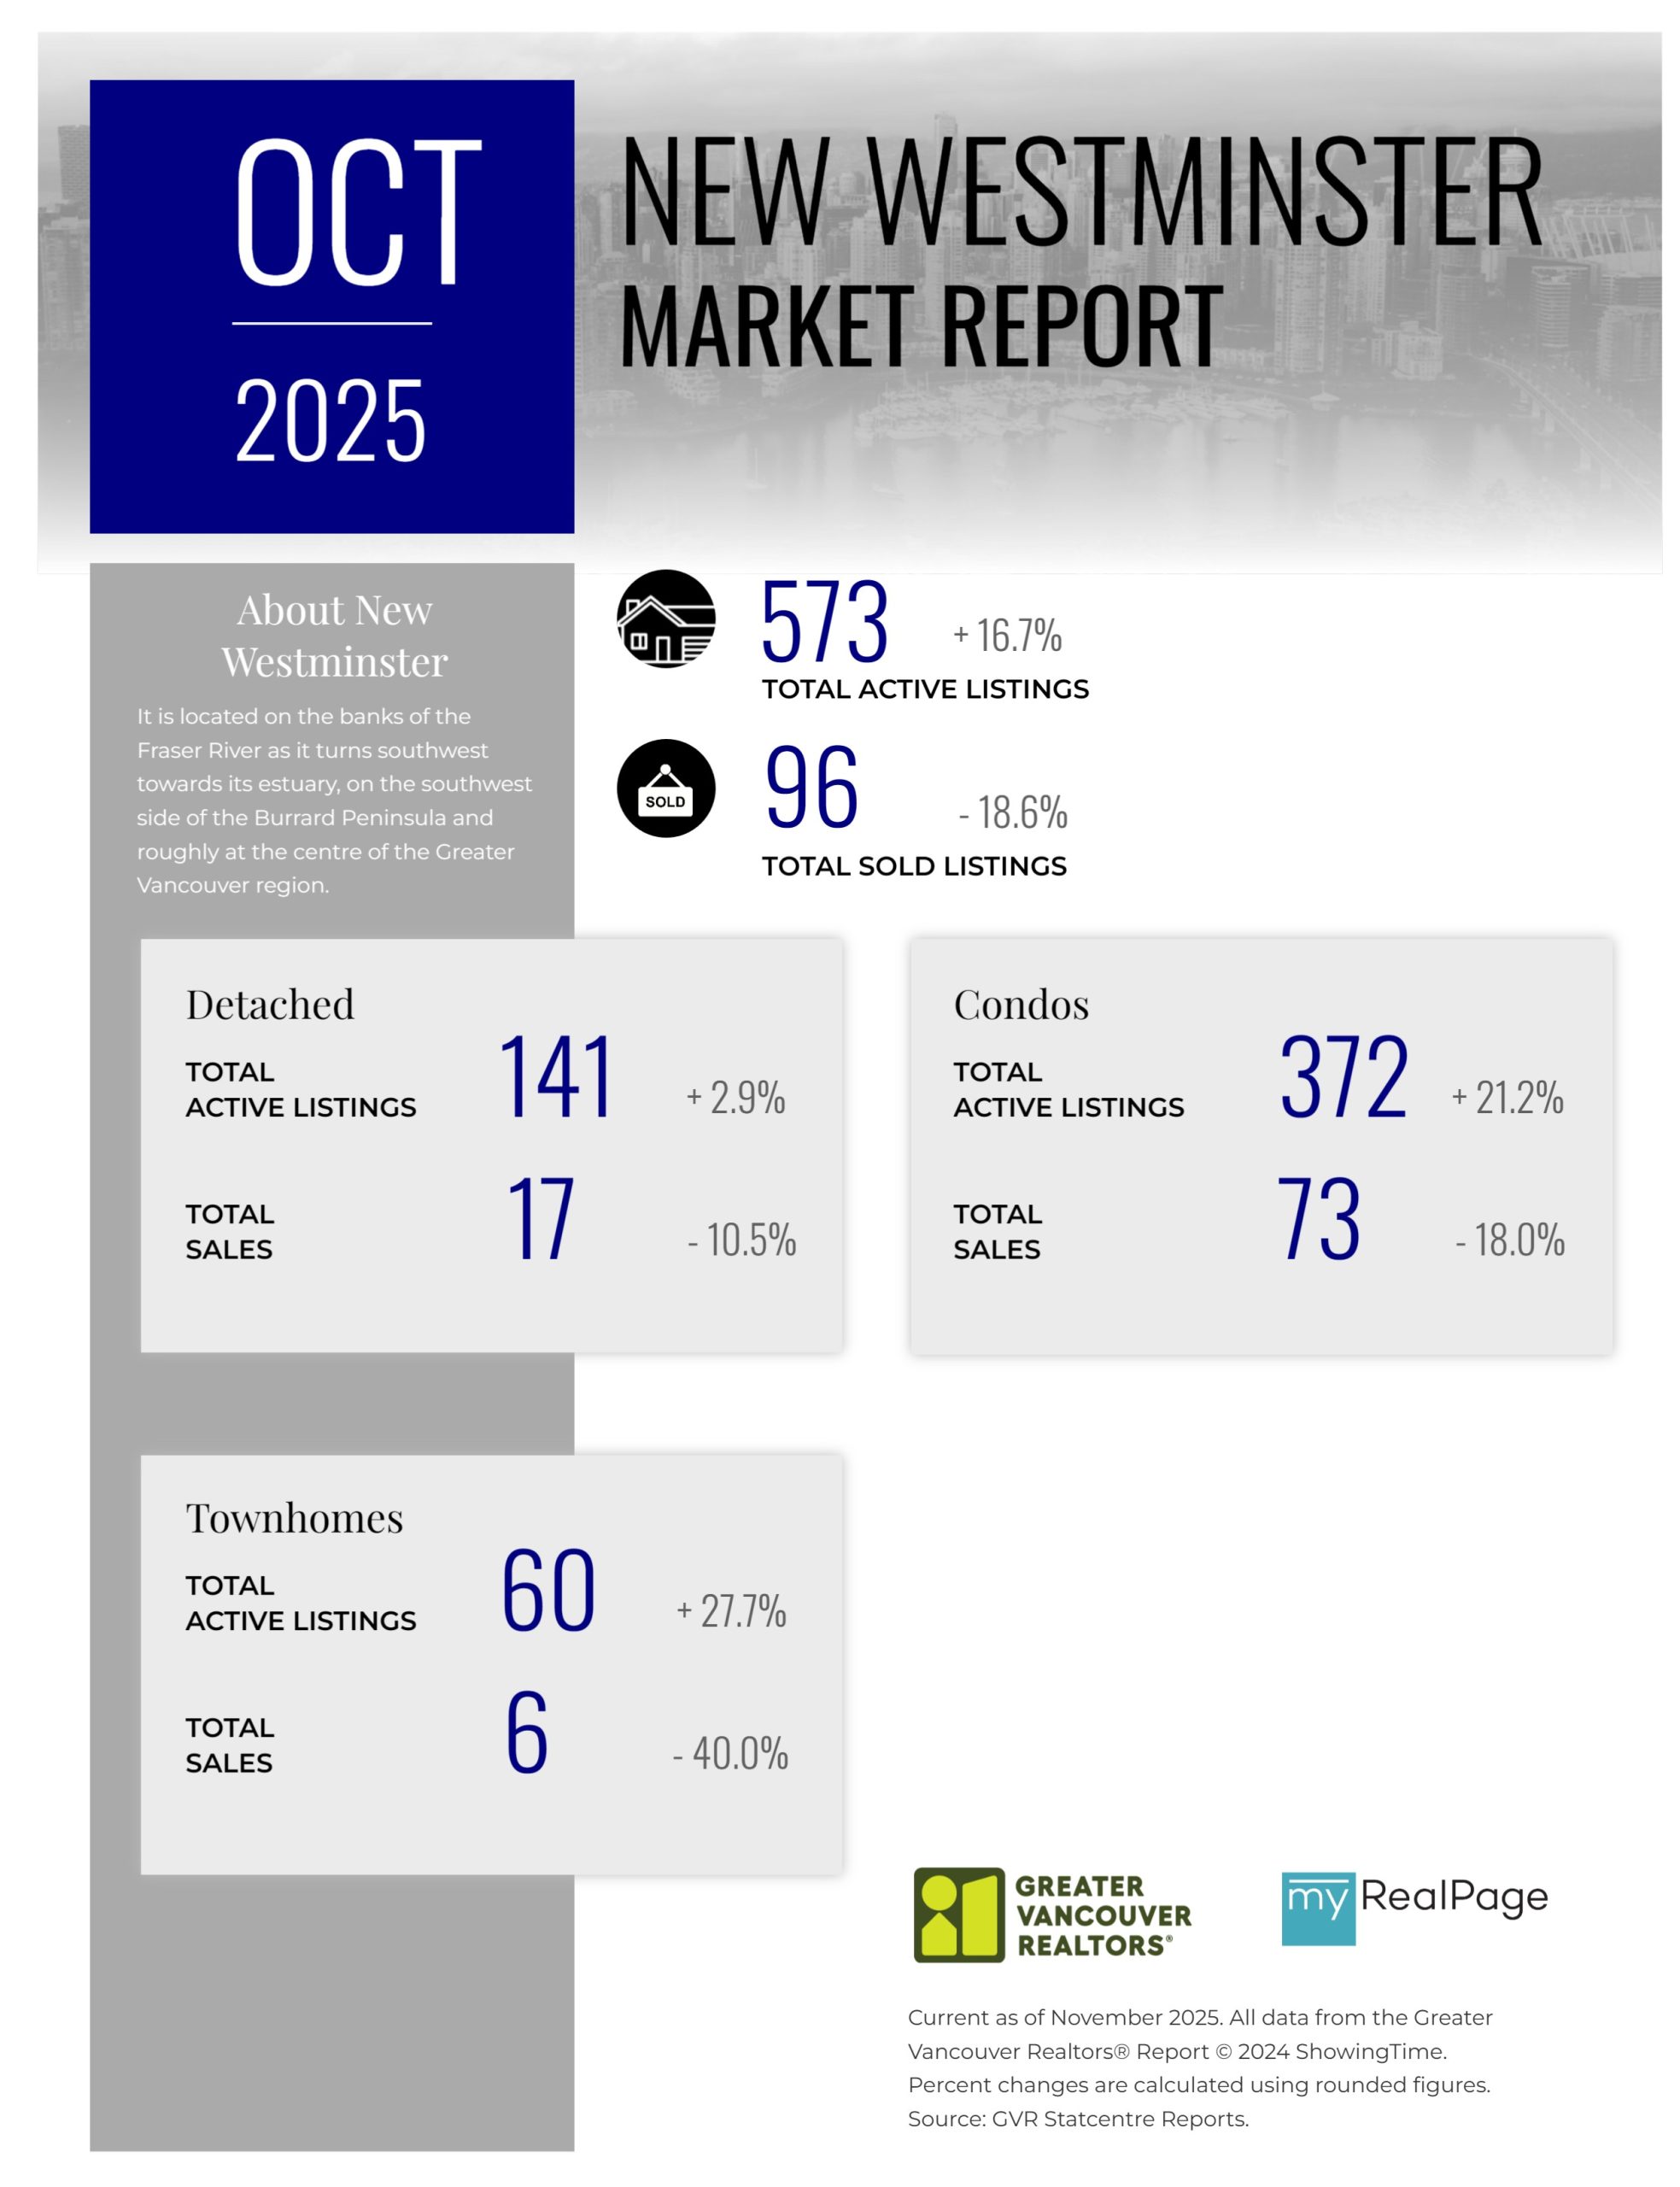
Printable Version – GVR October 2025 Data Infographics Report New Westminster
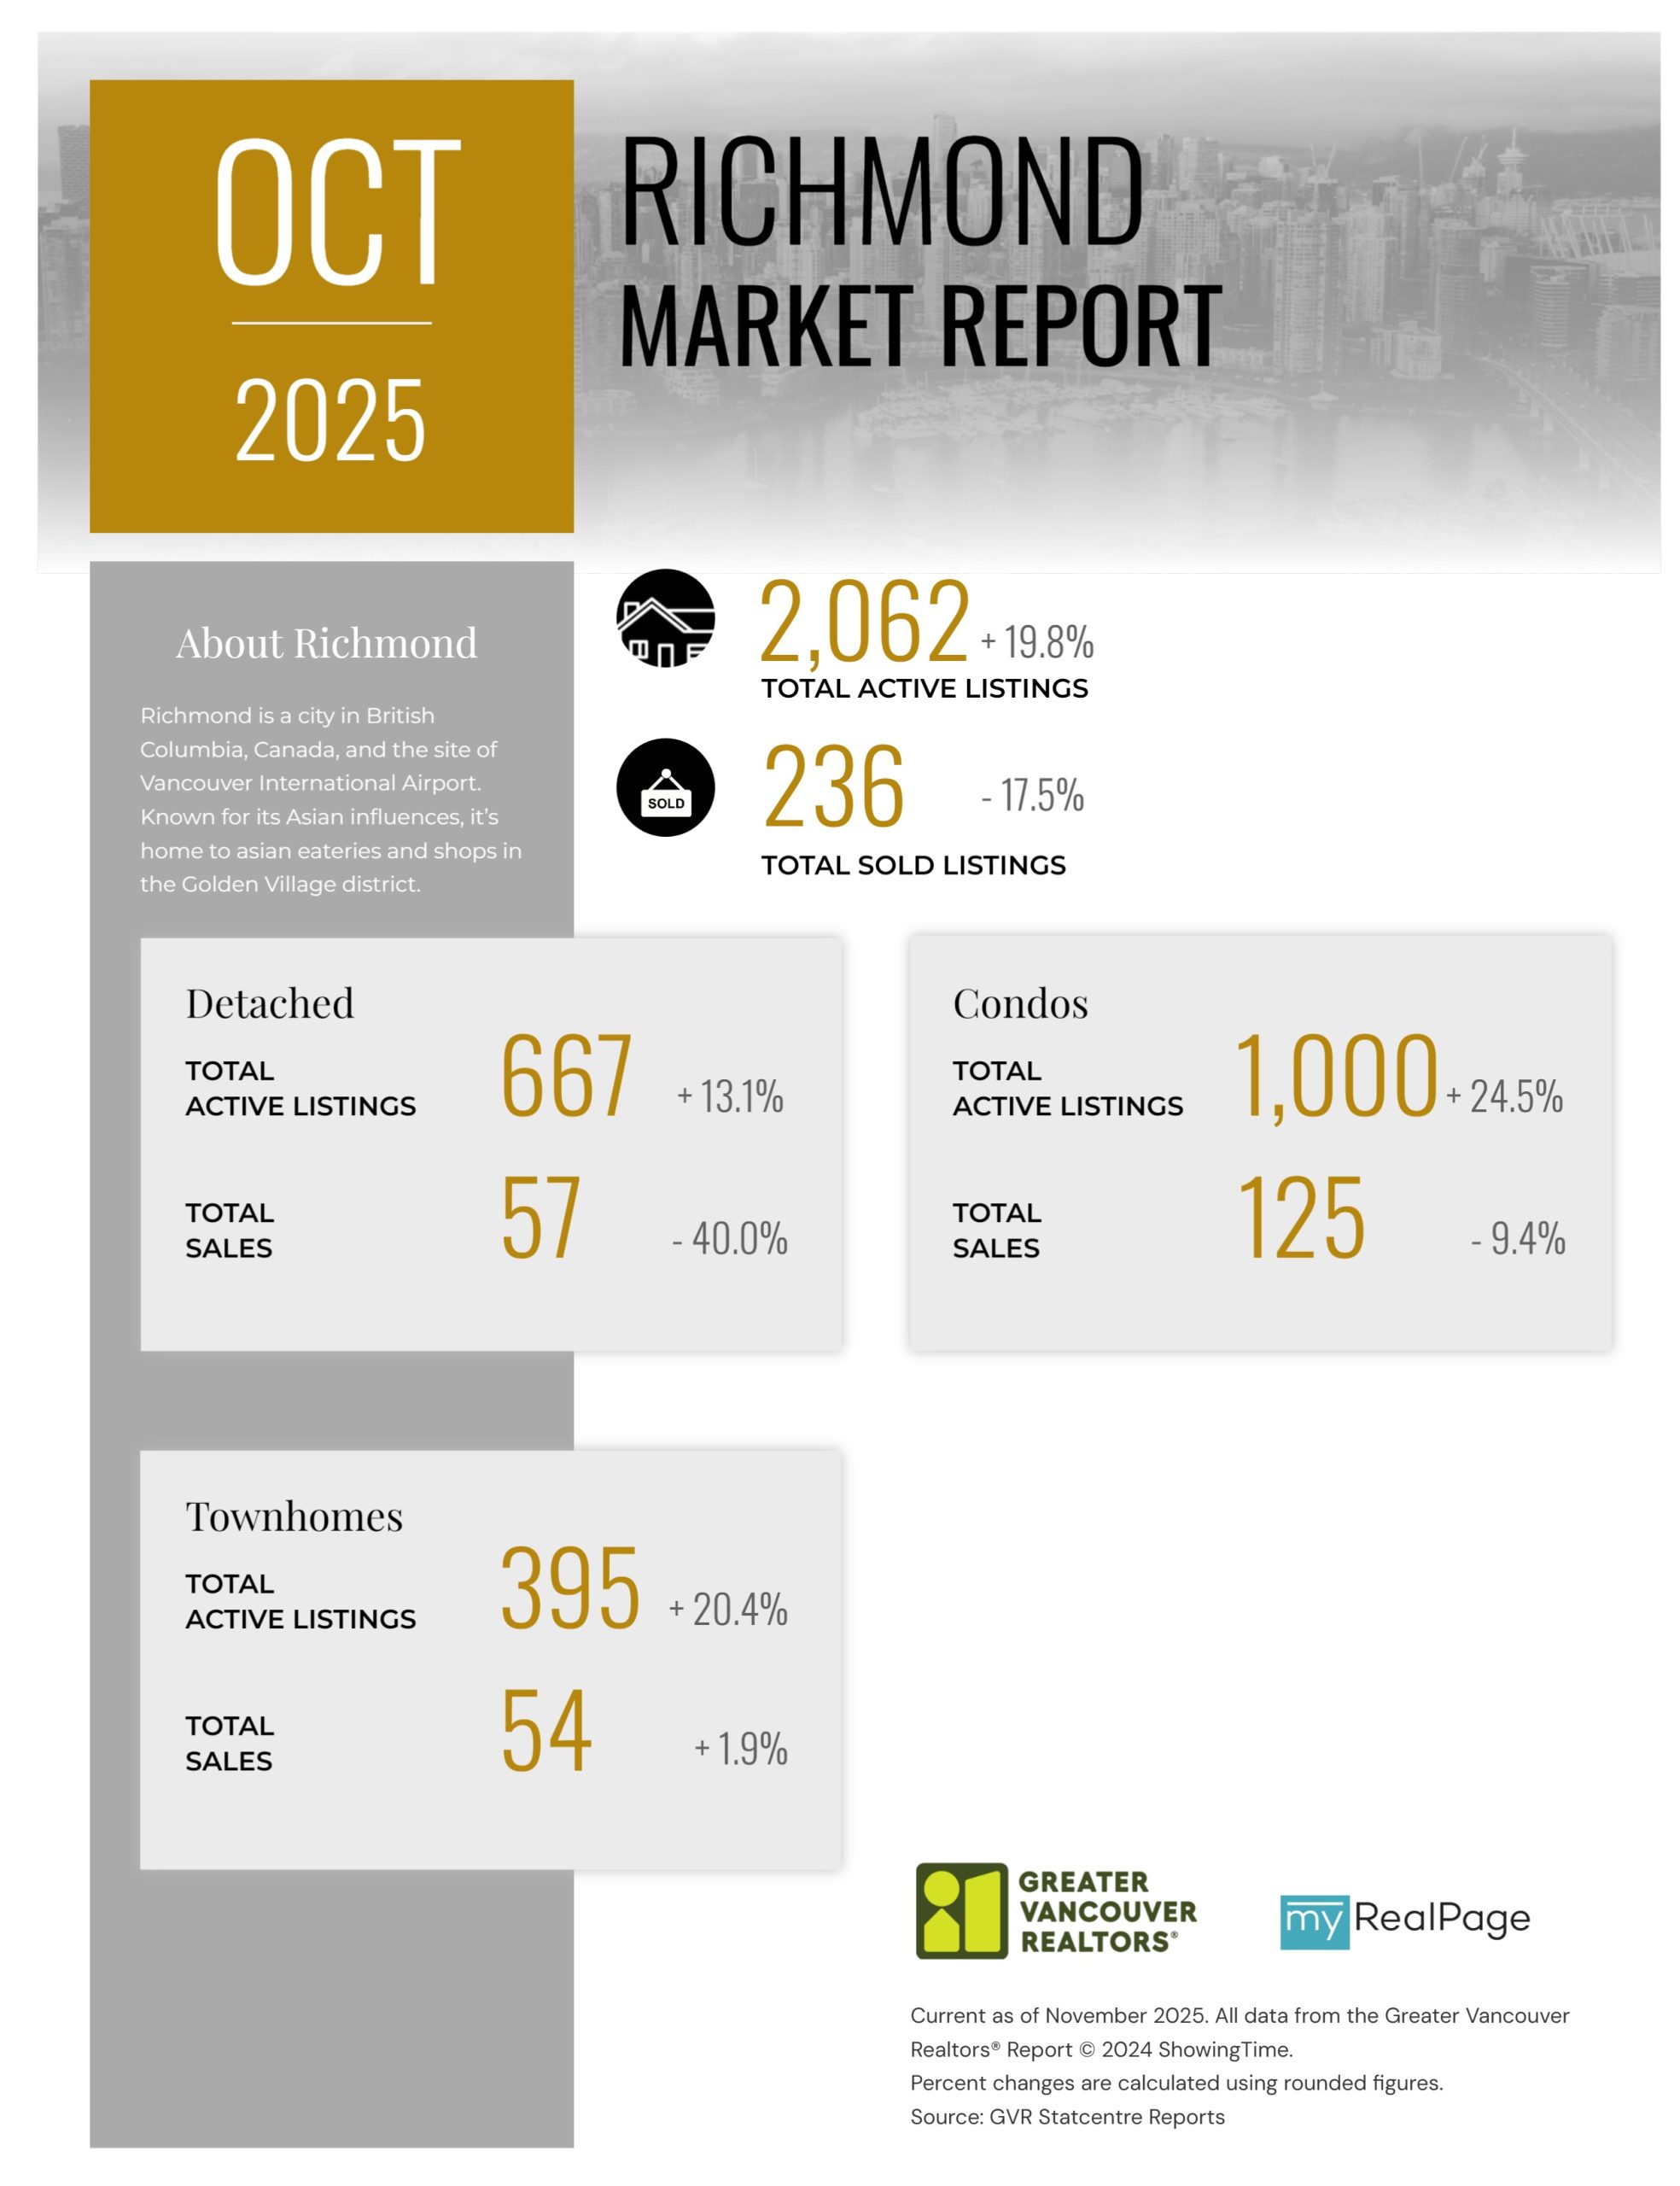
Printable Version – GVR October 2025 Data Infographics Report Richmond
Printable Version – GVR October 2025 Data Infographics Report Squamish


INFOGRAPHICS: September 2025 GVR Greater Vancouver Market Reports
Fall market favours buyers
Another Bank of Canada rate cut and easing prices helped home sales registered on the MLS® in Metro Vancouver edge higher relative to September last year.
The Greater Vancouver REALTORS® (GVR) reports that residential sales in the region totalled 1,875 in September 2025, a 1.2 per cent increase from the 1,852 sales recorded in September 2024. This was 20.1 per cent below the 10-year seasonal average (2,348).
“With another cut to Bank of Canada’s policy rate behind us, and markets pricing in at least one more cut by the end of the year, Metro Vancouver homebuyers have reason to be optimistic about the fall market. Easing prices, near-record high inventory levels, and increasingly favourable borrowing costs are offering those looking to purchase a home this fall with plenty of opportunity.” said Andrew Lis, GVR director of economics and data analytics
Read the full report on the REBGV website!
The following data is a comparison between September 2025 and September 2024 numbers, and is current as of October of 2025. For last month’s update, you can check out our previous post!
Or follow this link for all our GVR Infographics!
These infographics cover current trends in several areas within the Greater Vancouver region. Click on the images for a larger view!
Printable Version – GVR September 2025 Data Infographic Report North Vancouver
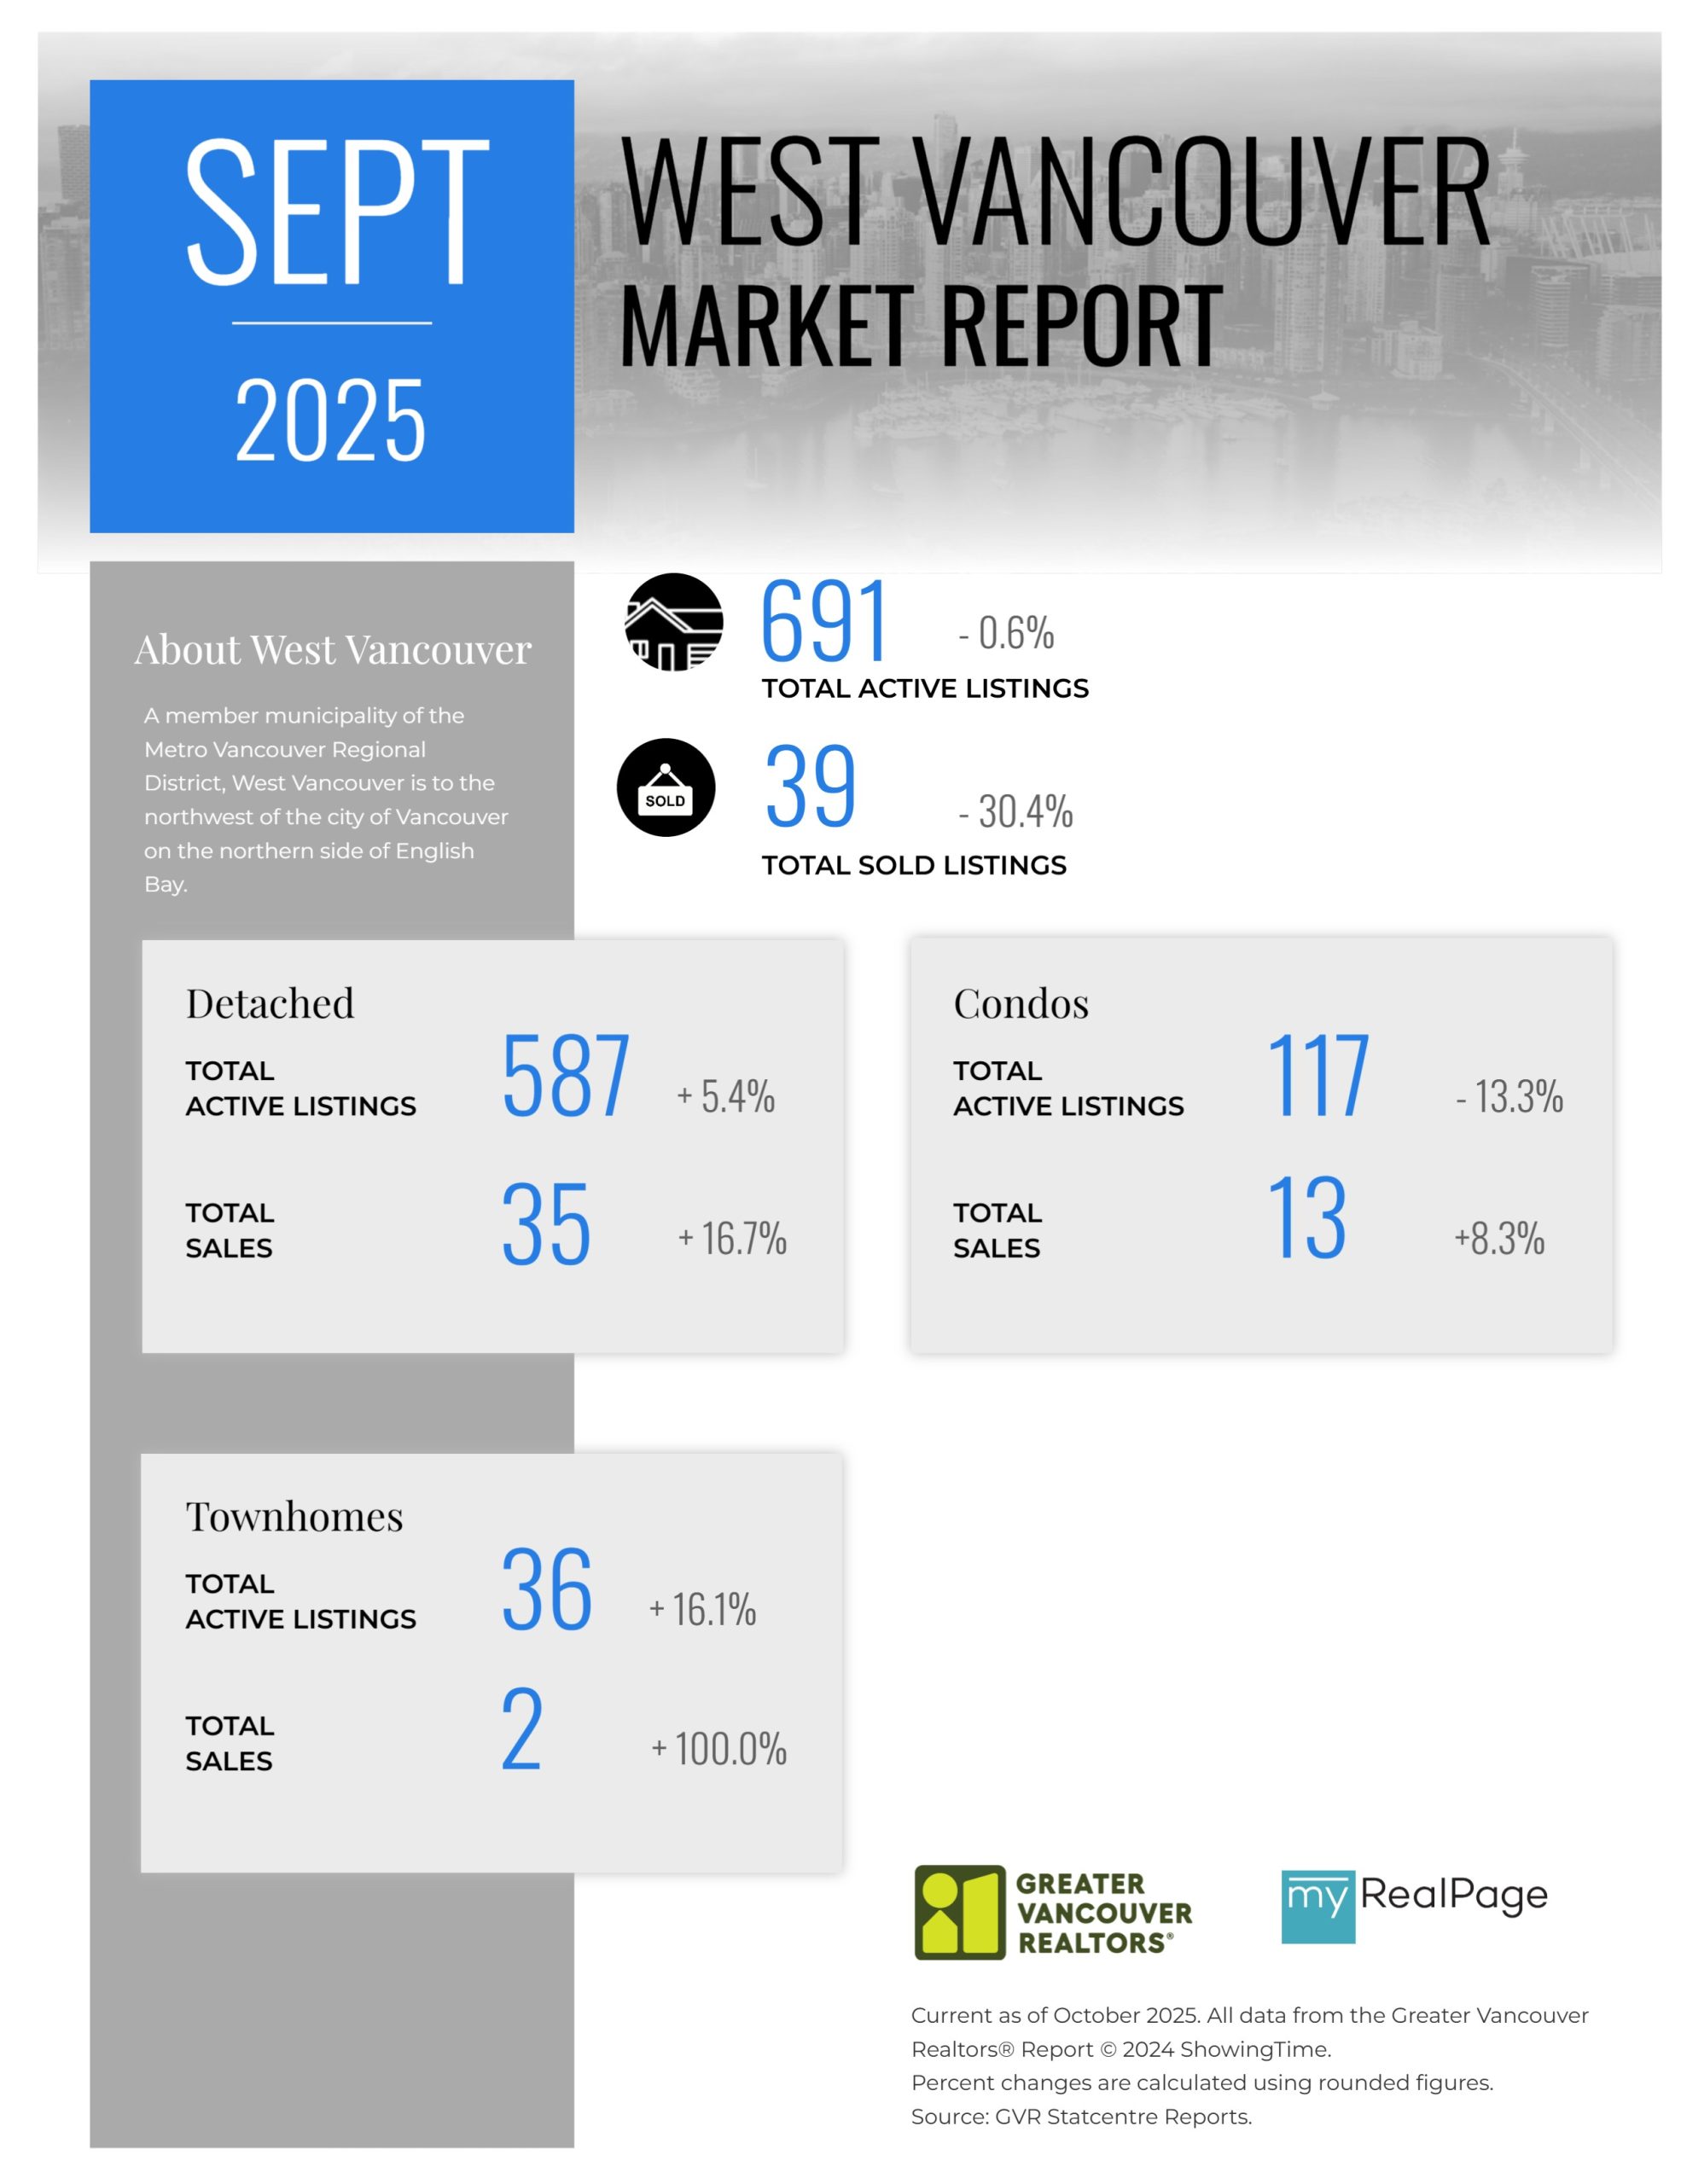
Printable Version – GVR September 2025 Data Infographics Report West Vancouver
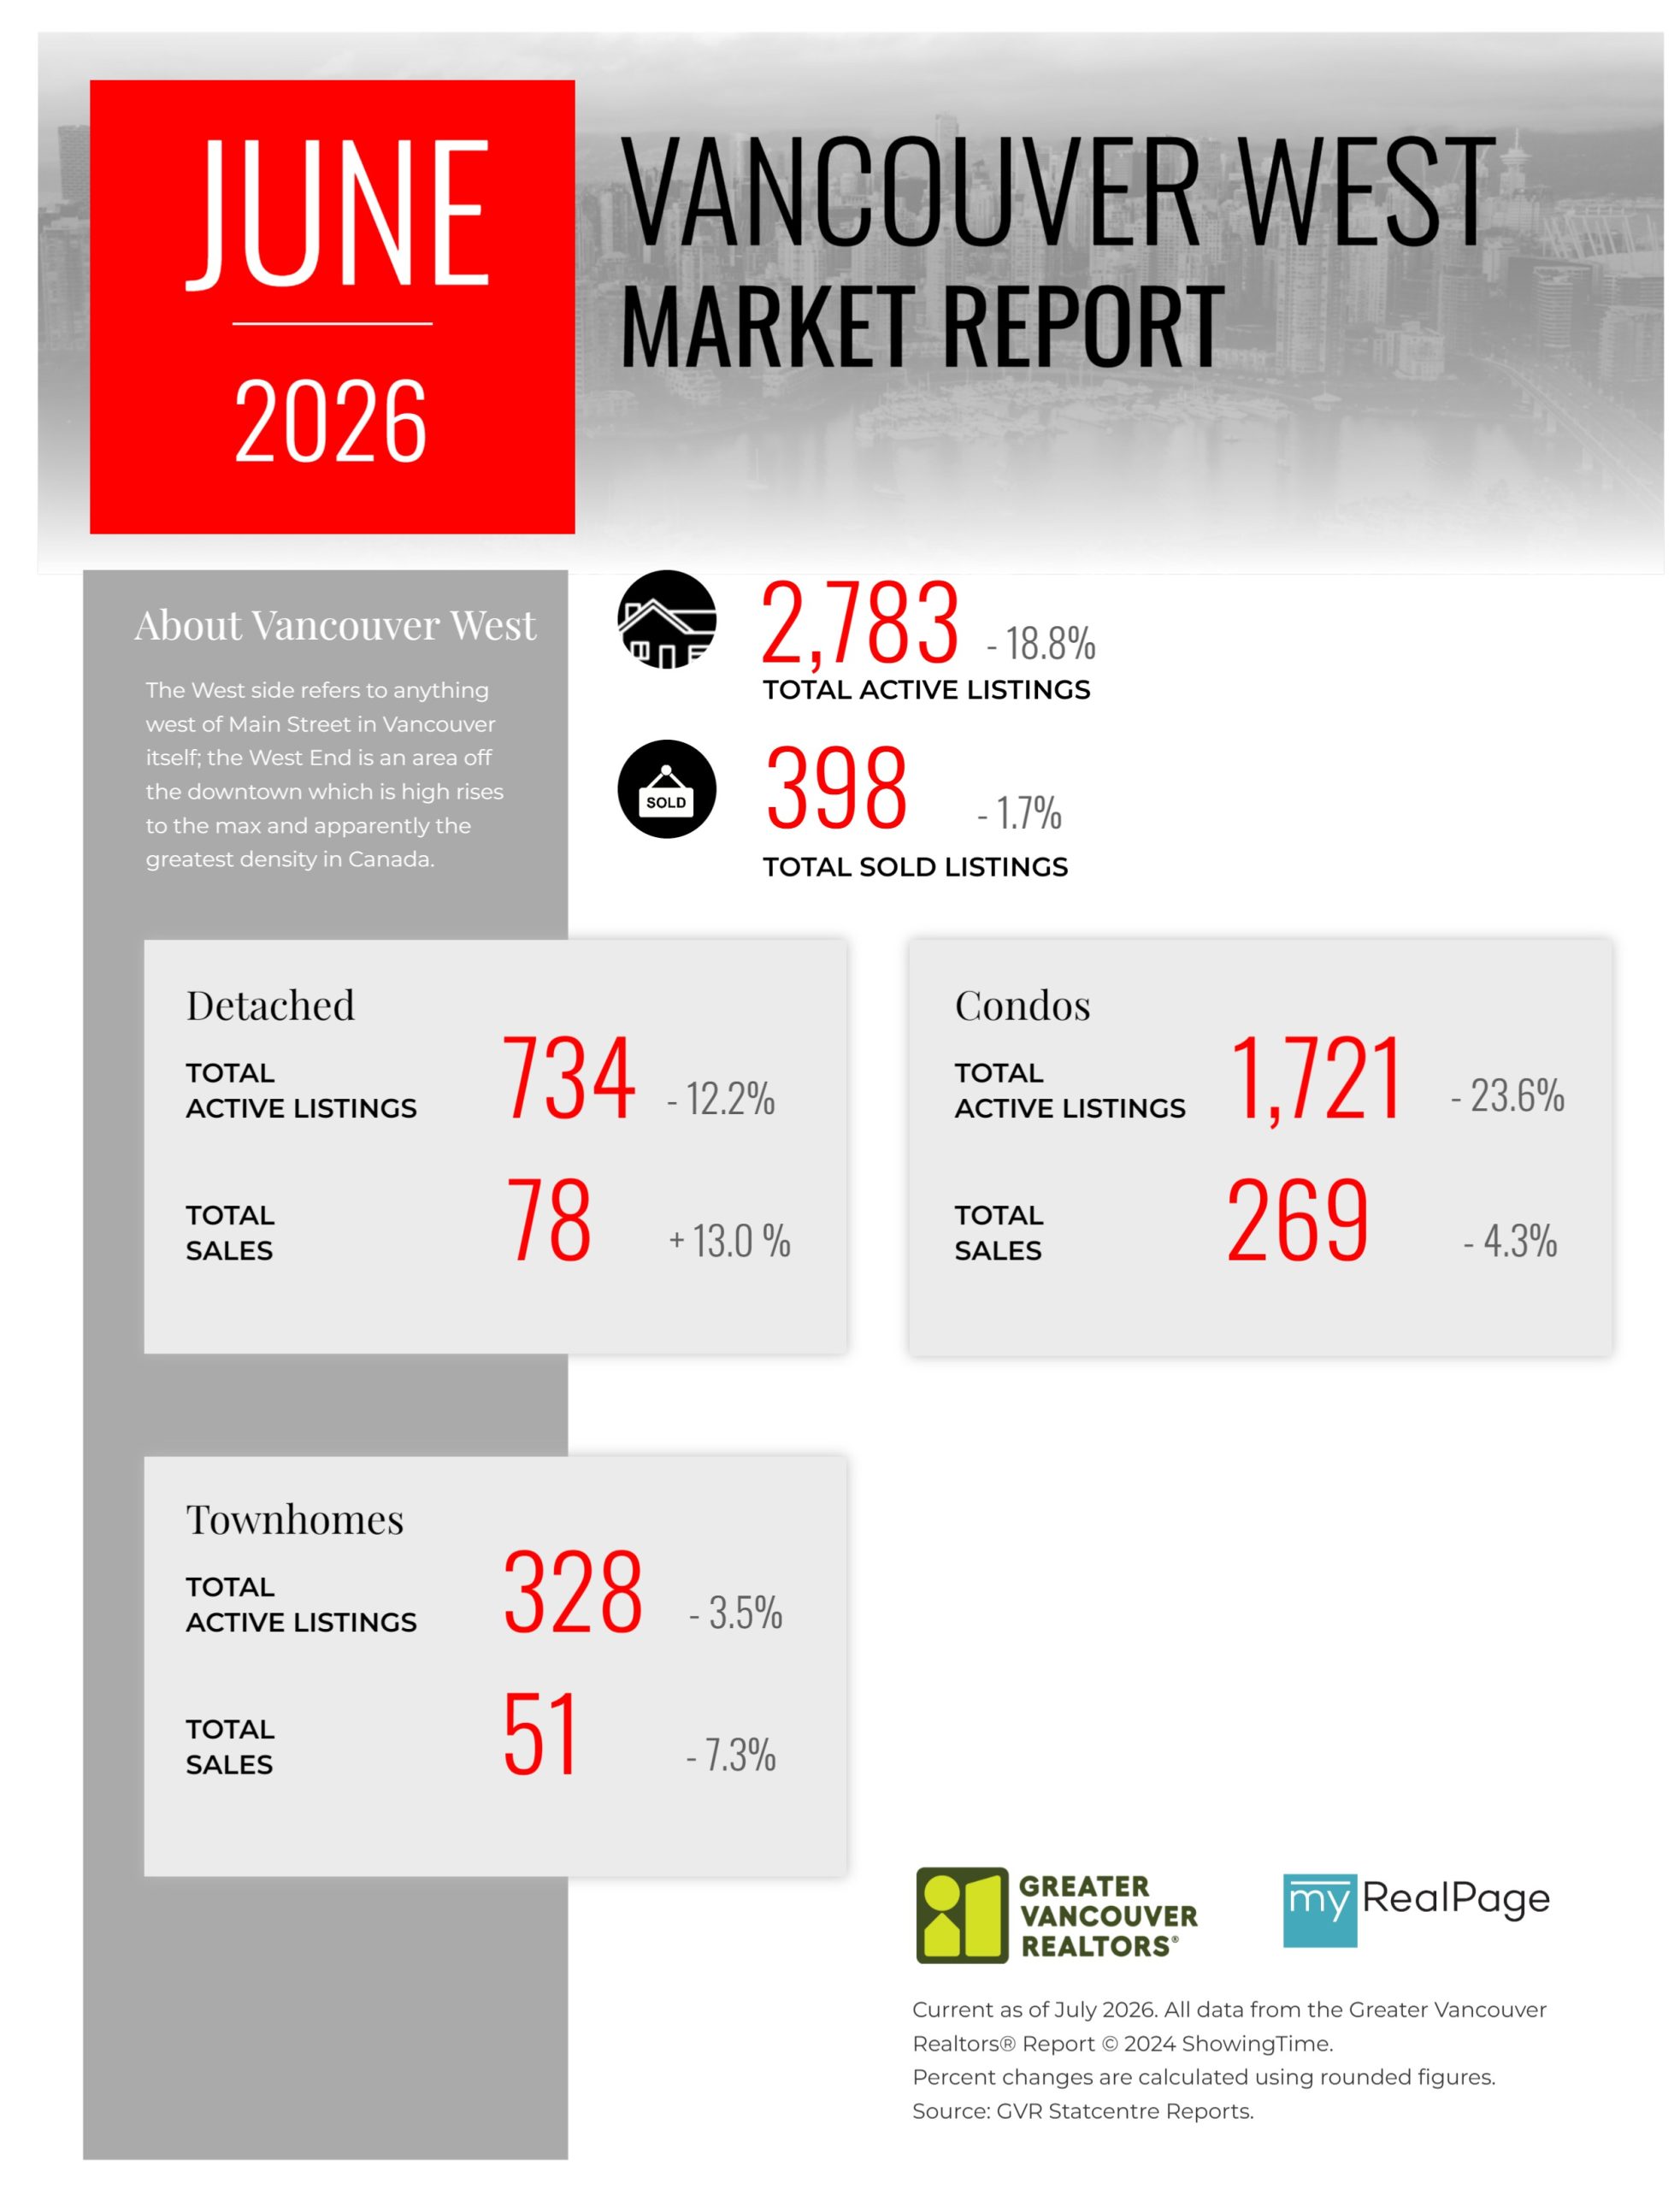
Printable Version – GVR September 2025 Data Infographics Report Vancouver West
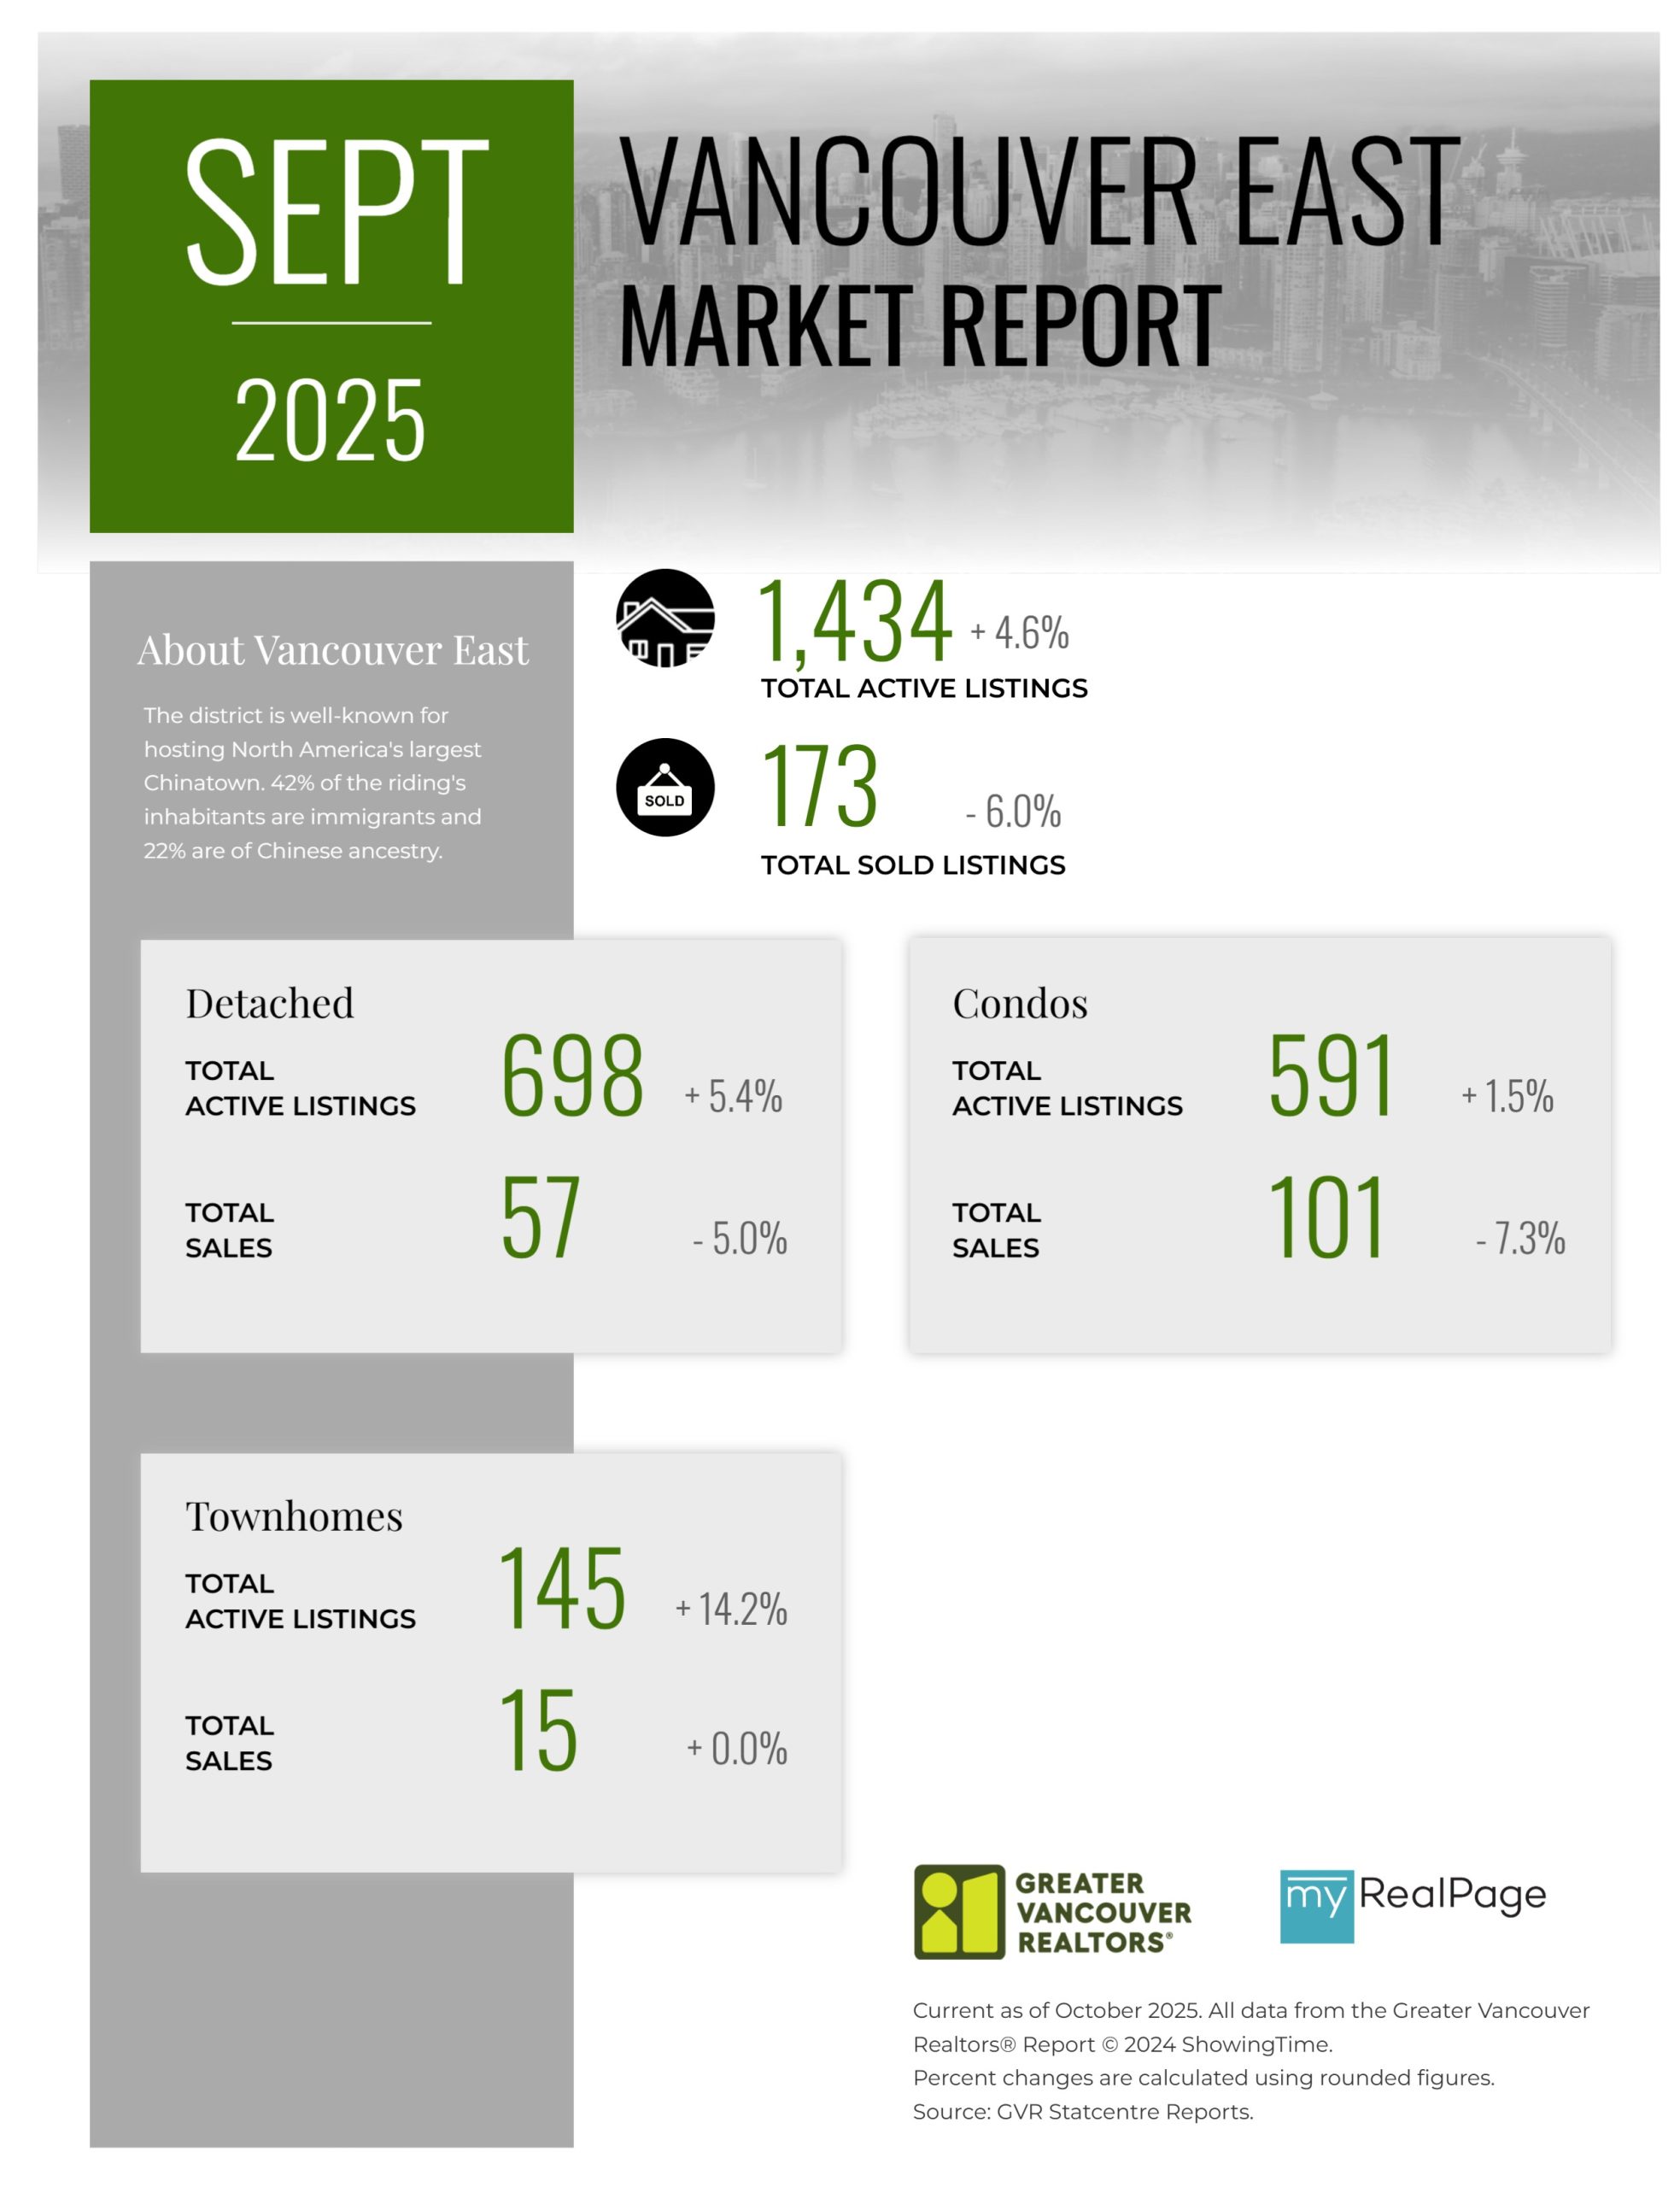
Printable Version – GVR September 2025 Data Infographics Report Vancouver East
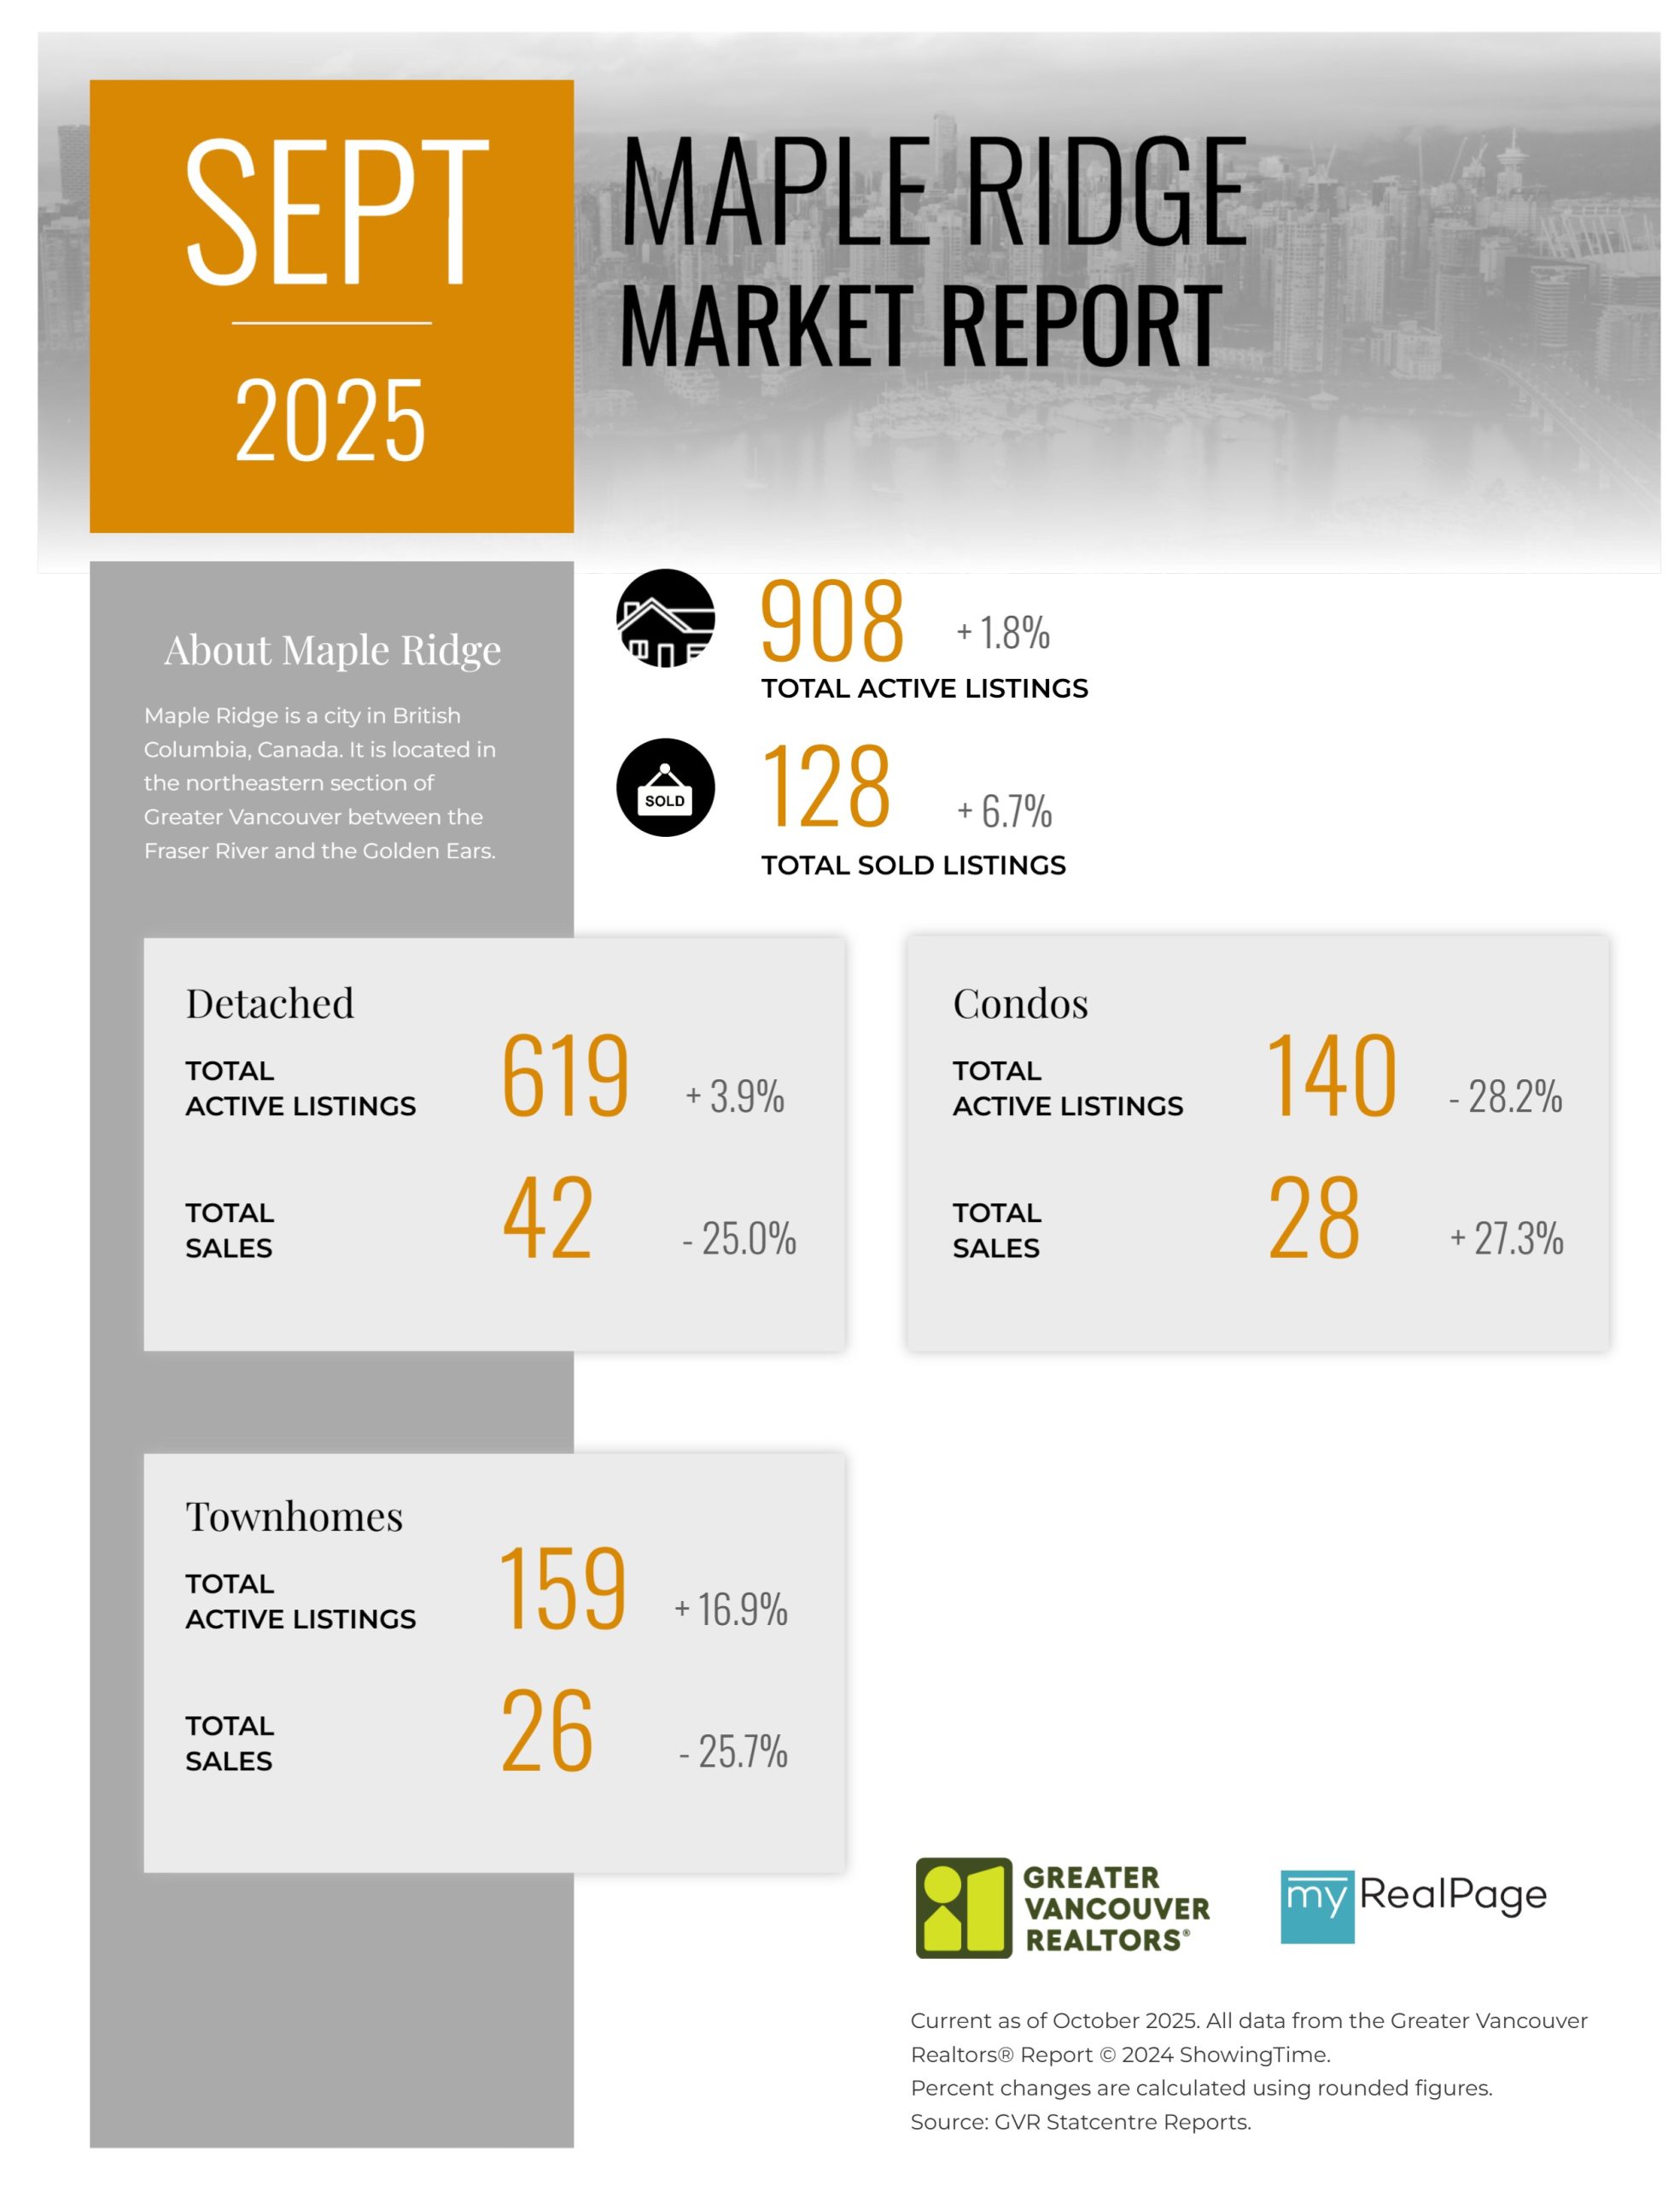
Printable Version – GVR September 2025 Data Infographic Report Maple Ridge
Printable Version – GVR September 2025 Data Infographics Report Pitt Meadows
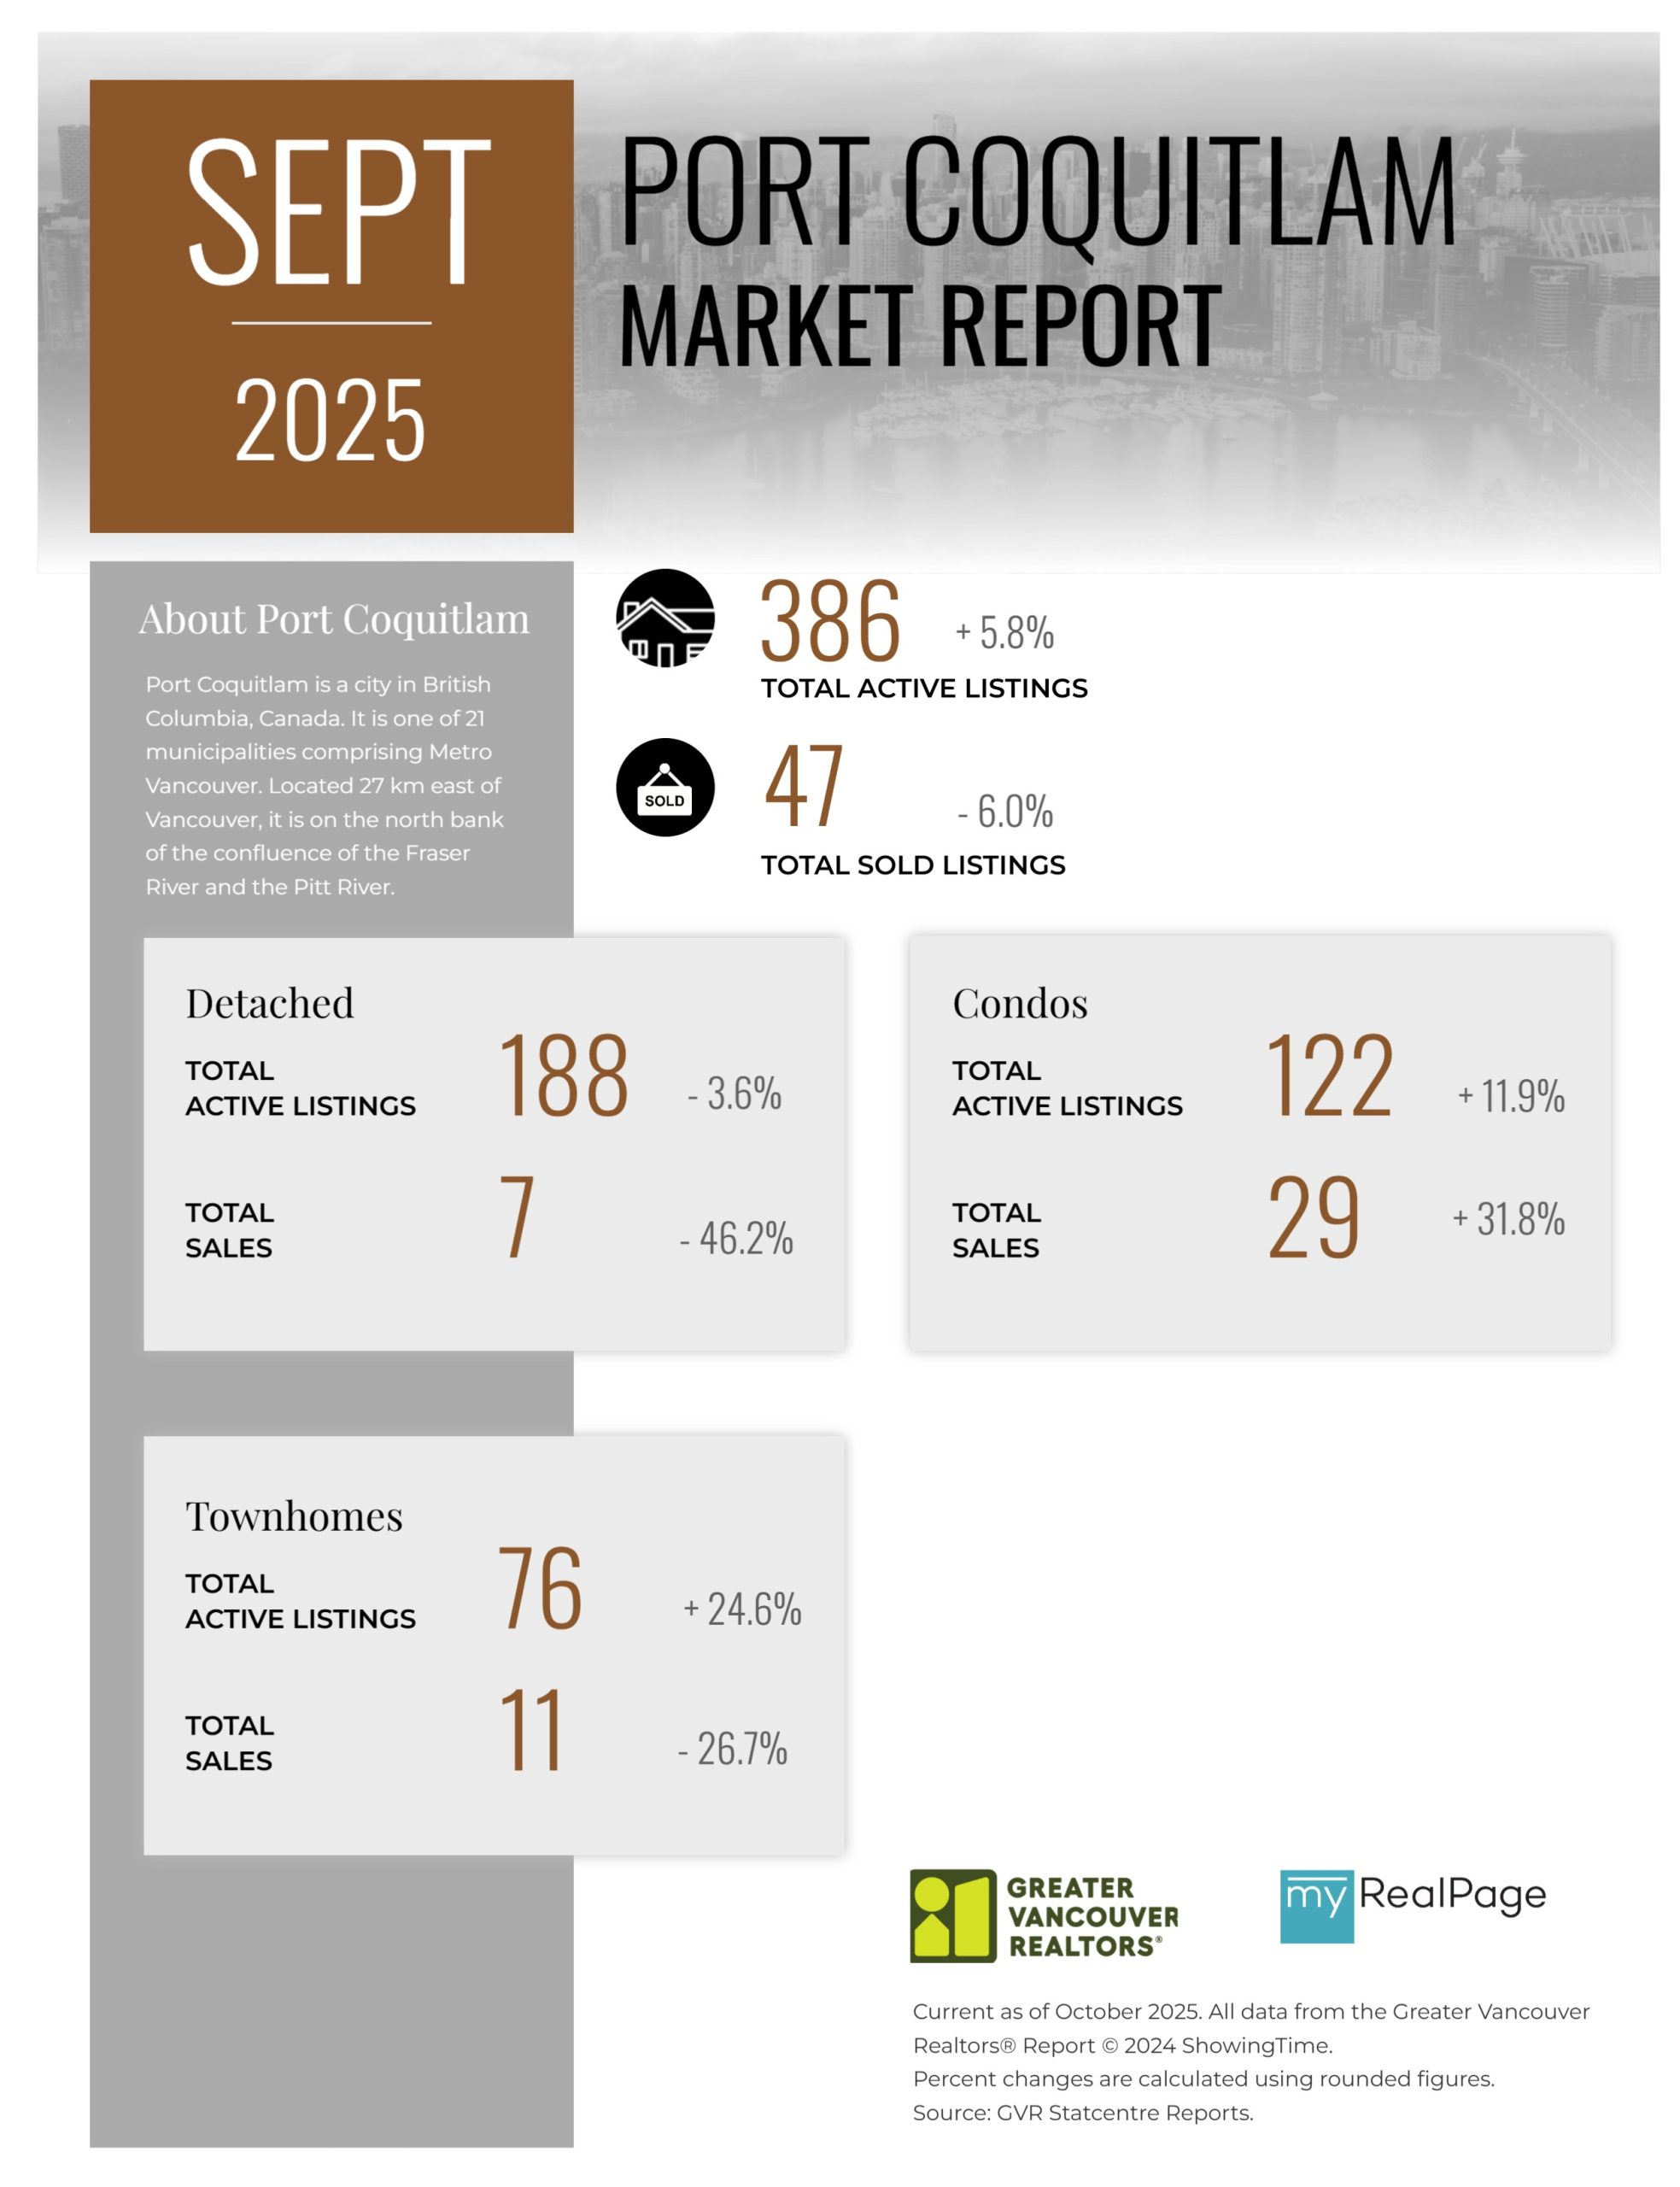
Printable Version – GVR September 2025 Data Infographics Report Port Coquitlam
Printable Version – GVR September 2025 Data Infographics Report Coquitlam
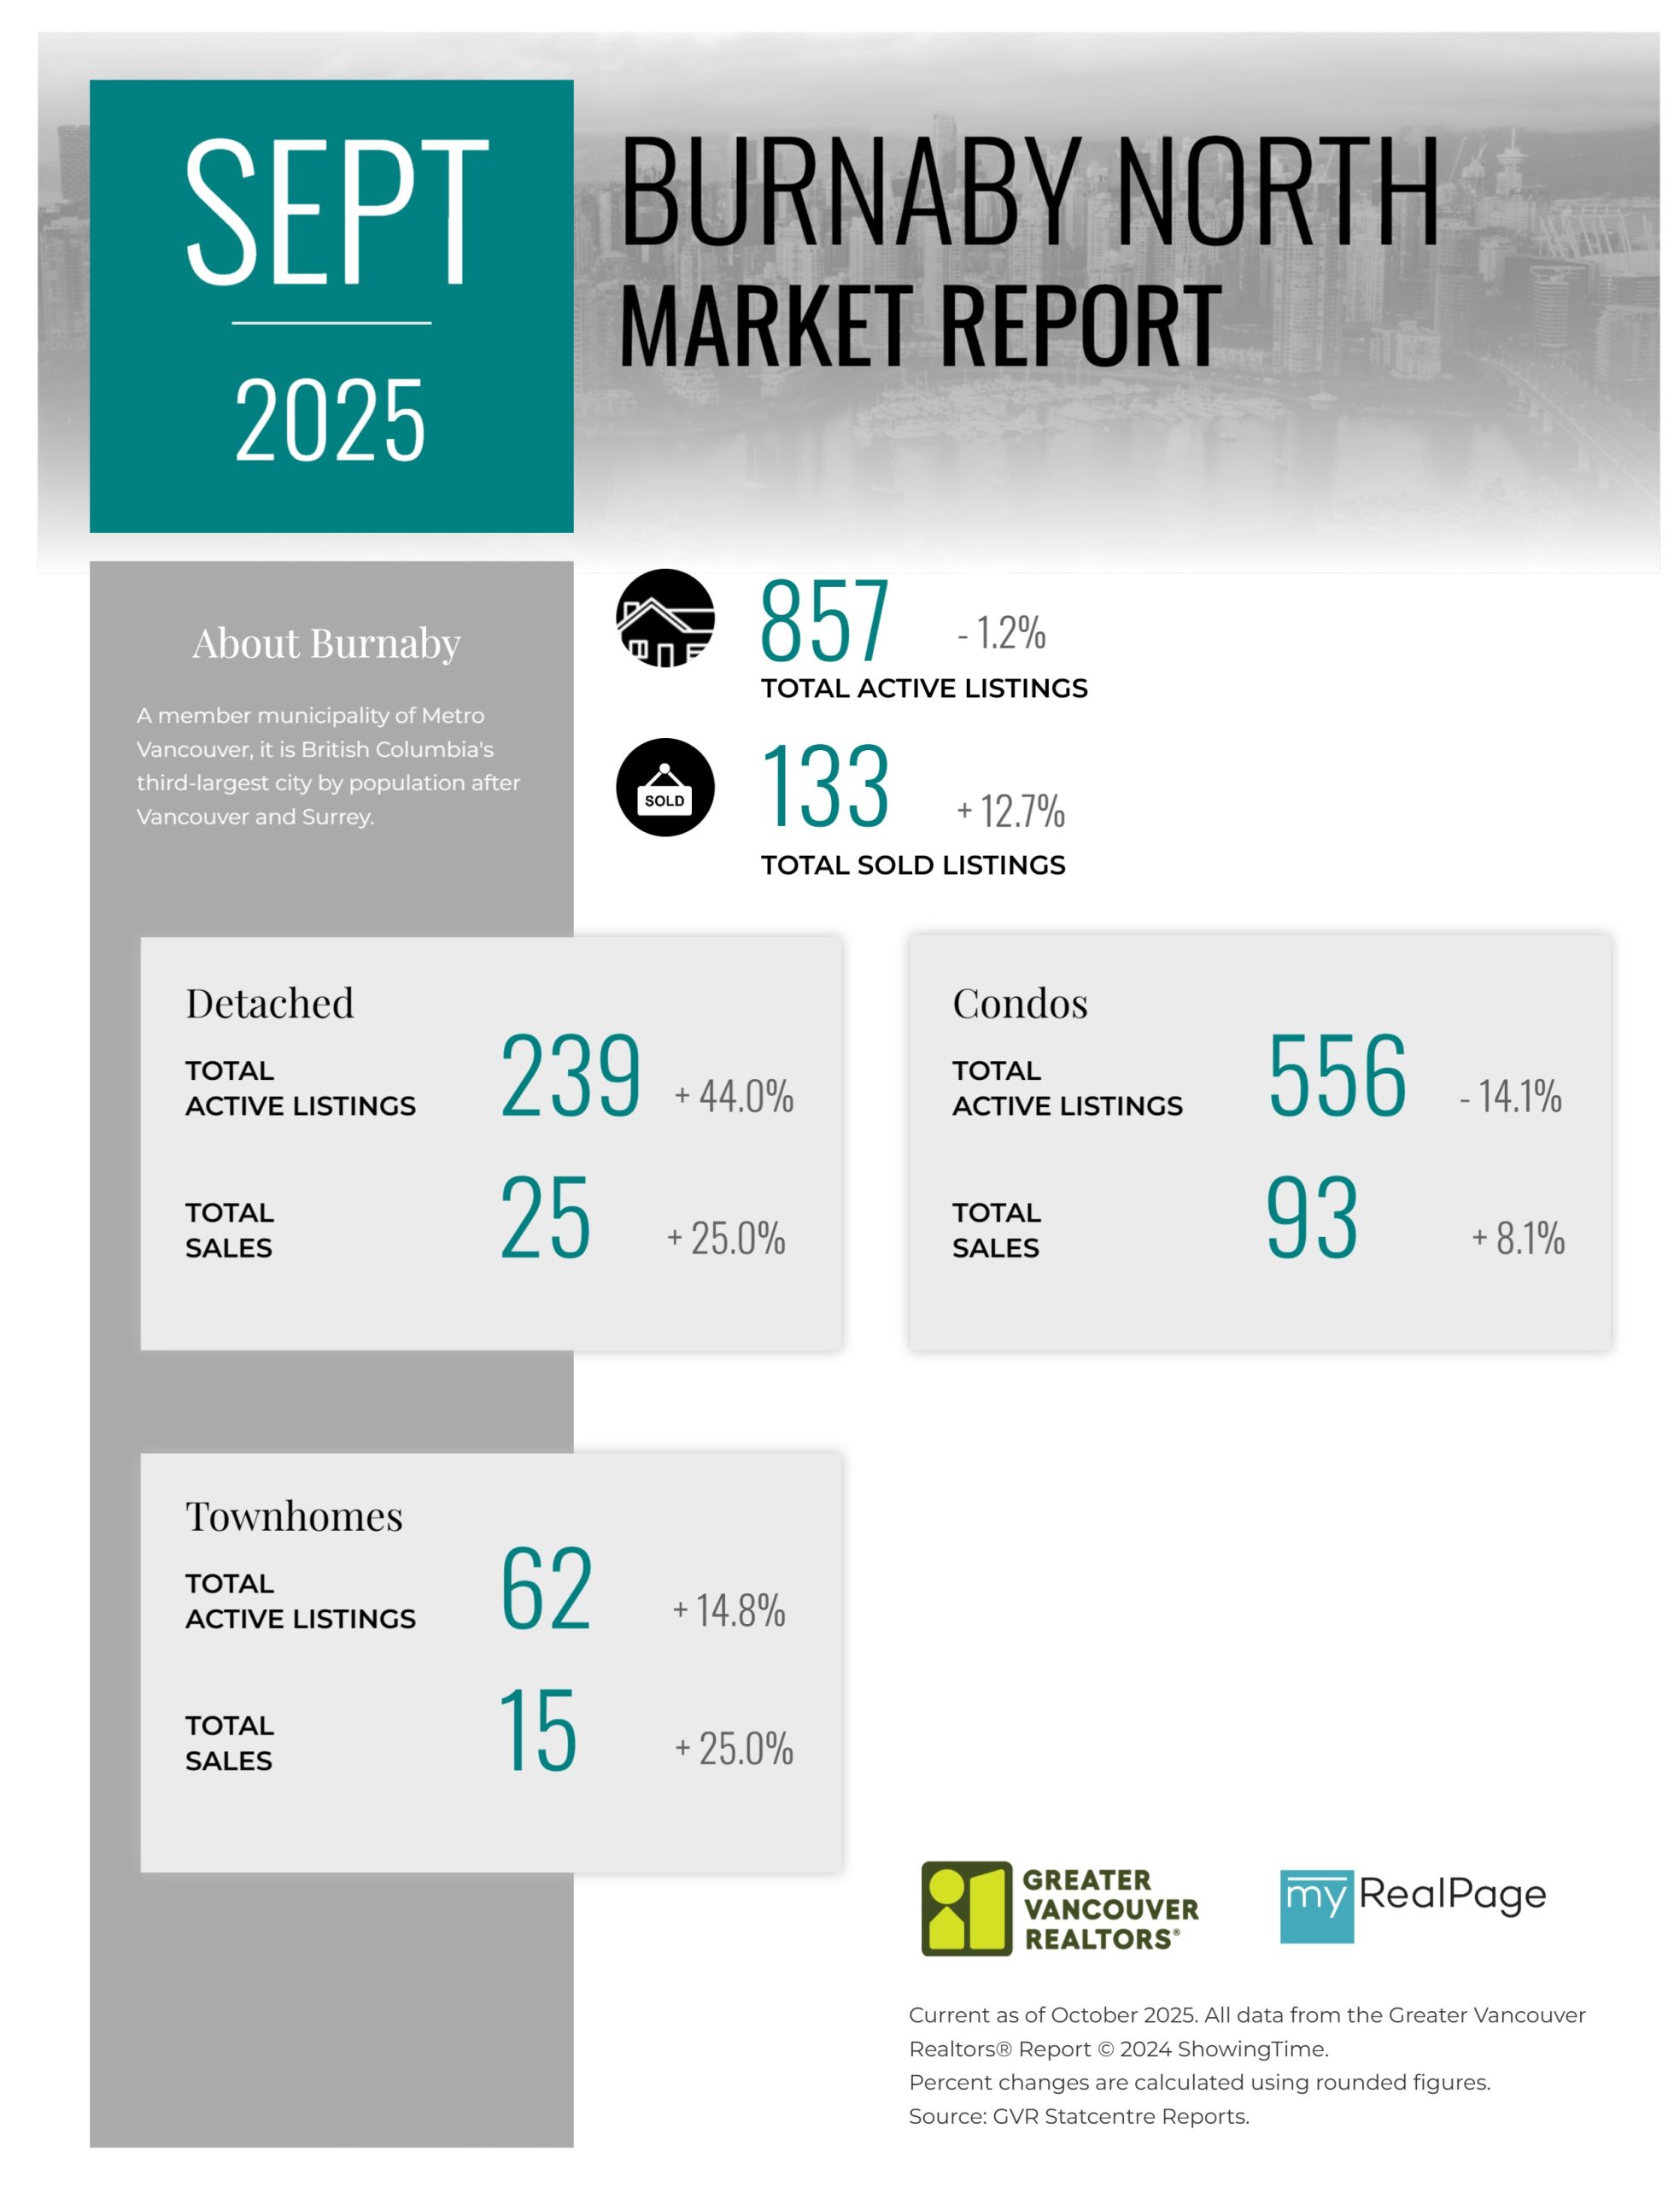
Printable Version – GVR September 2025 Data Infographic Report Burnaby North
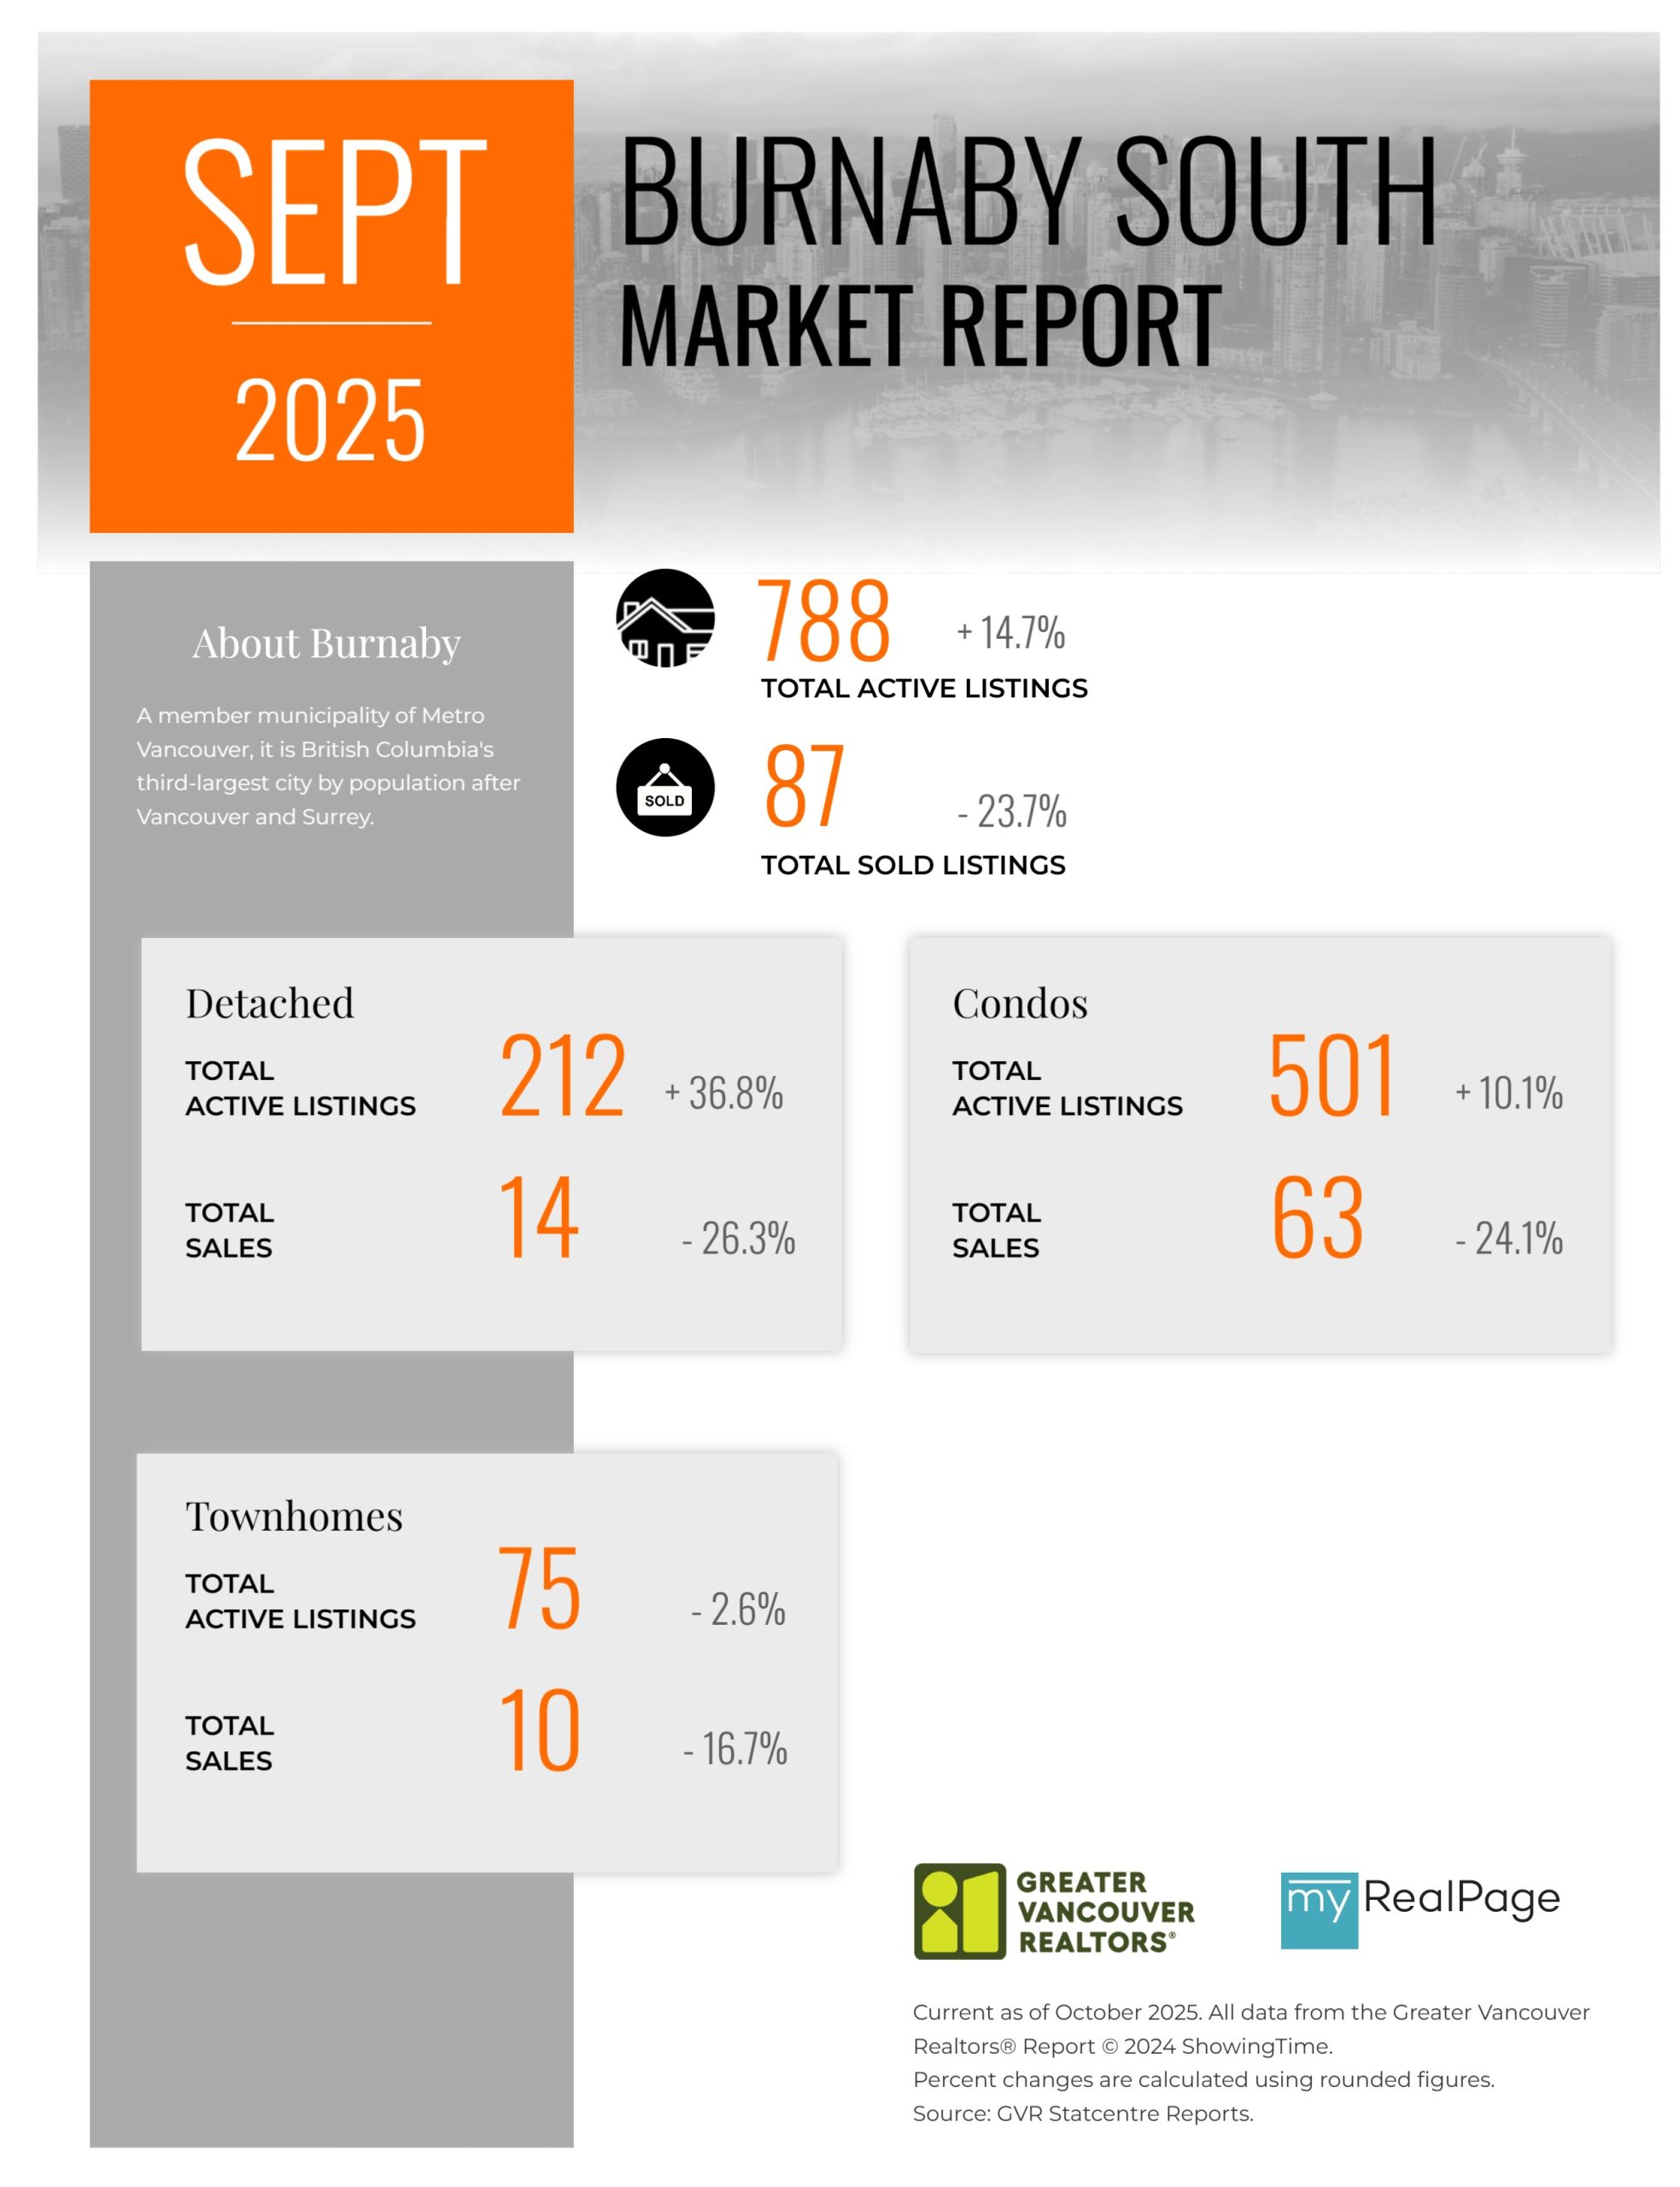
Printable Version – GVR September 2025 Data Infographics Report Burnaby South
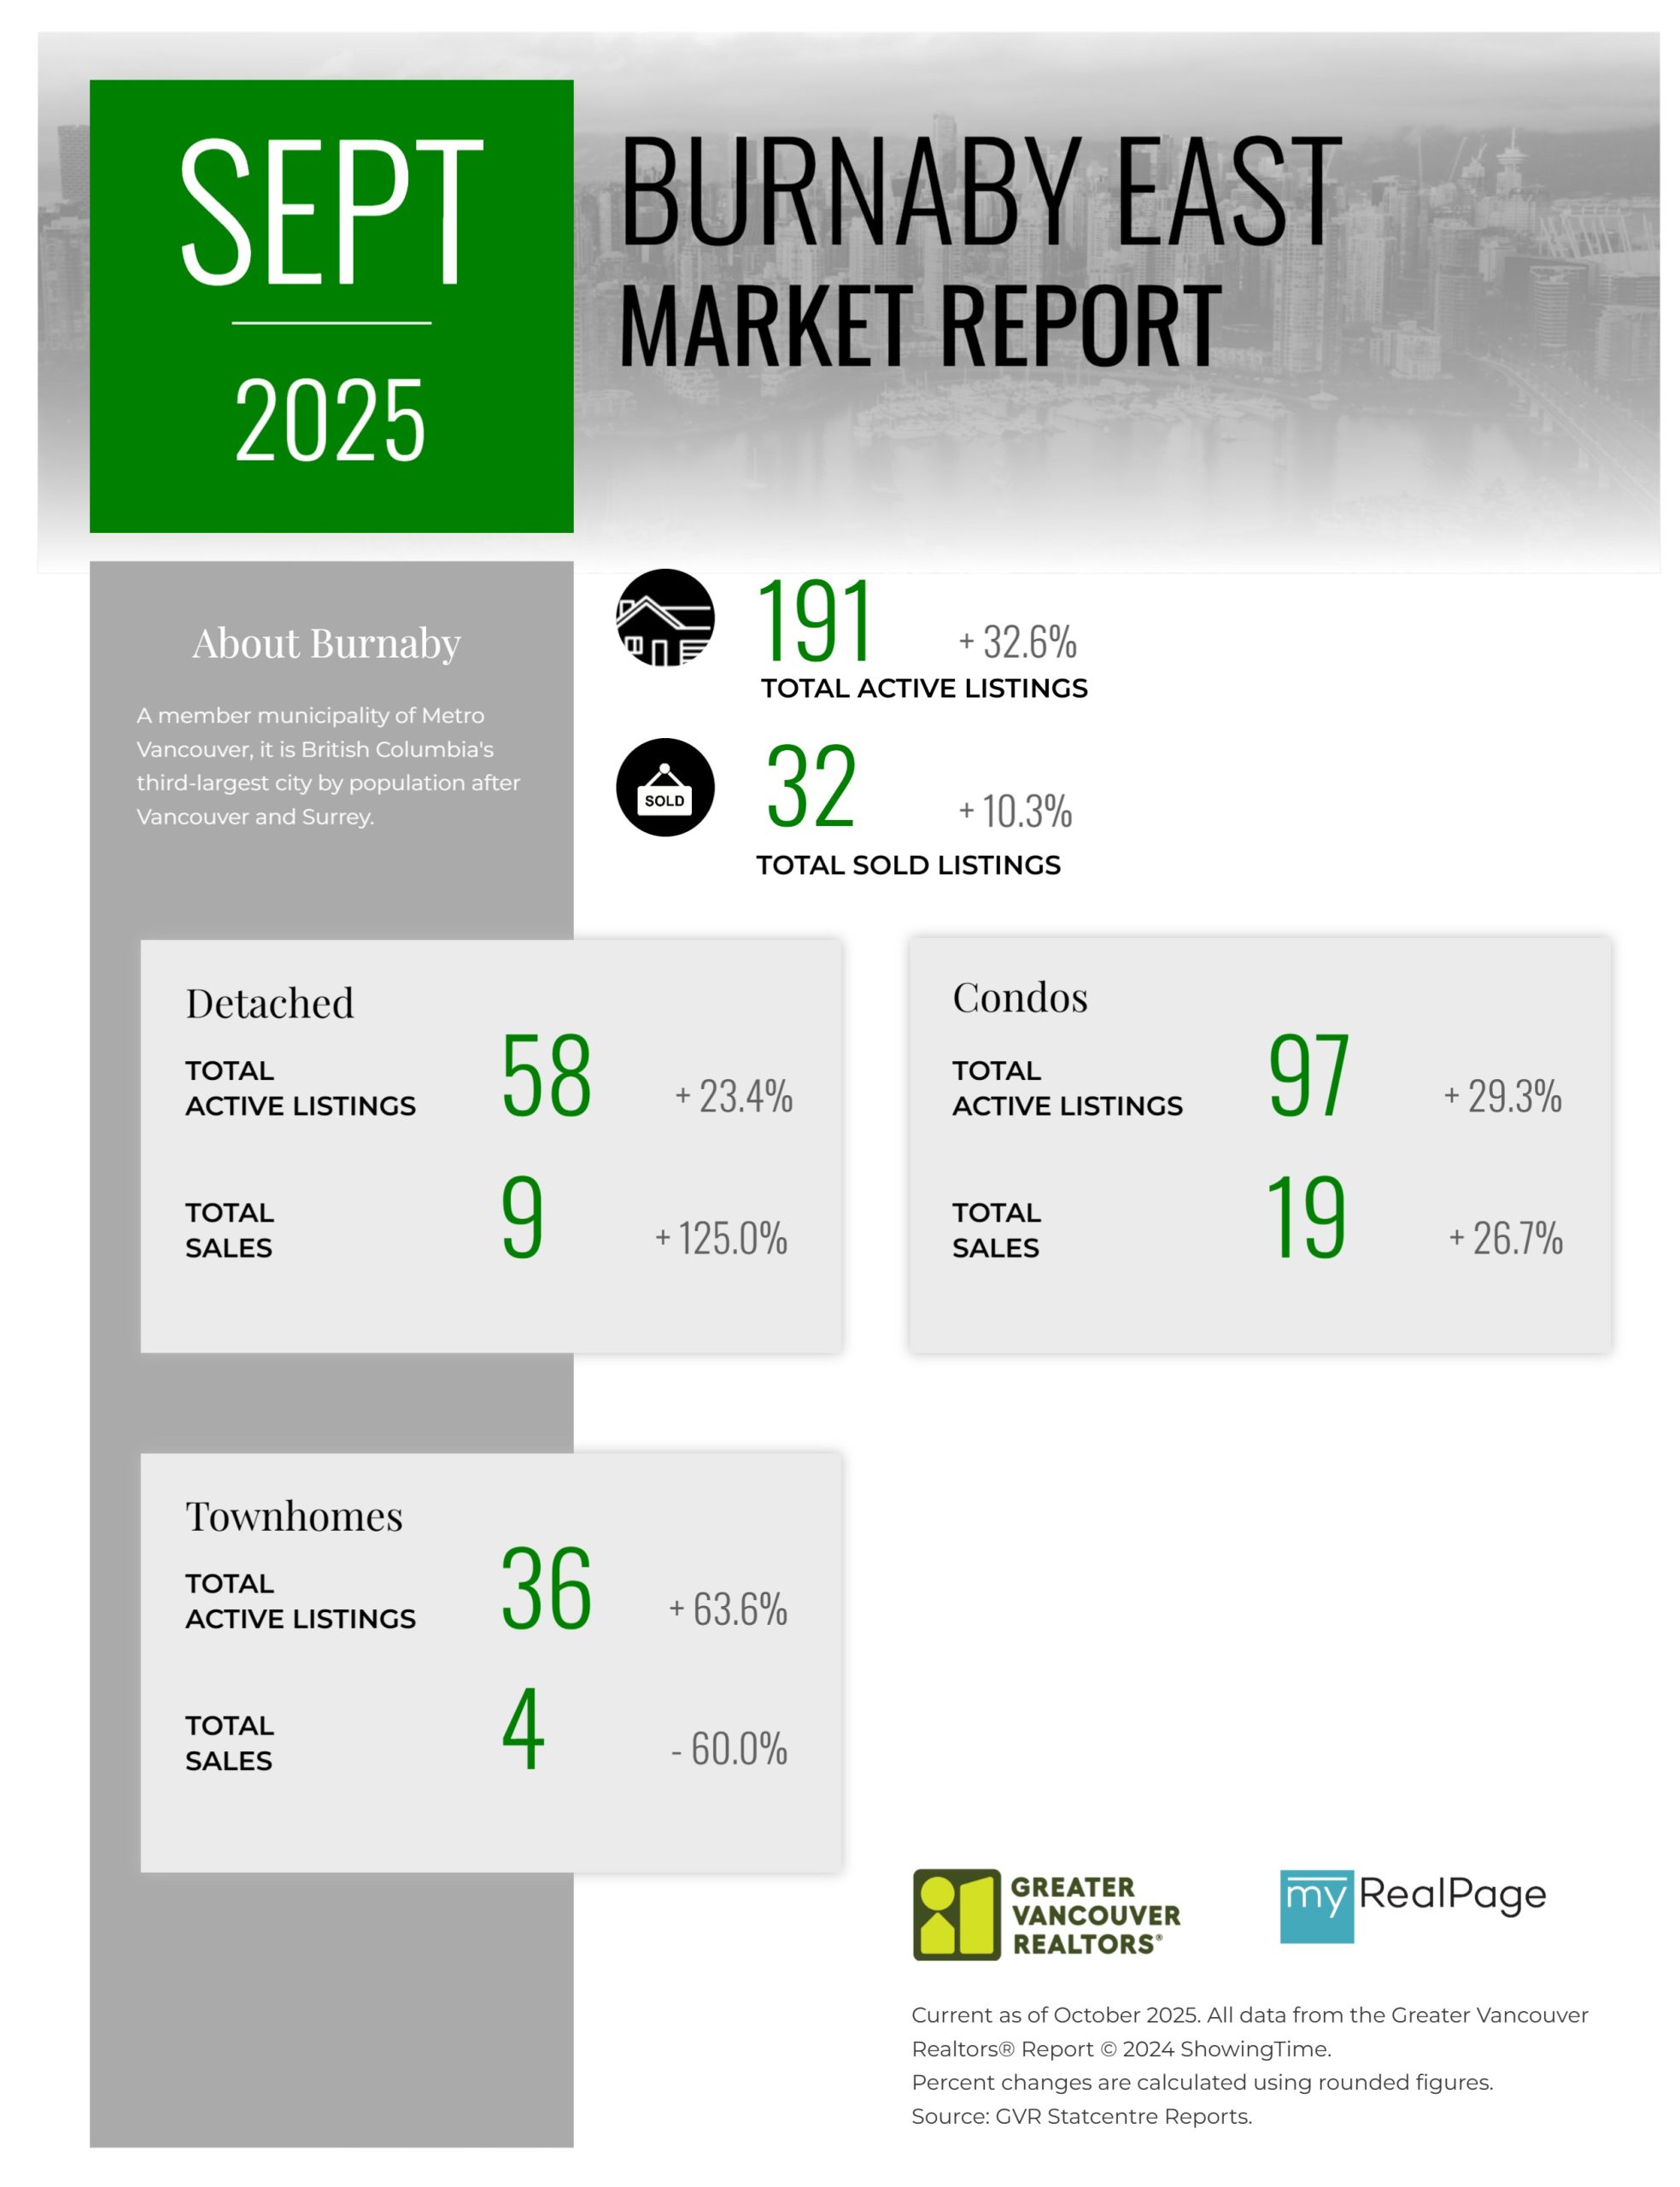
Printable Version – GVR September 2025 Data Infographics Report Burnaby East
Printable Version – GVR September 2025 Data Infographics Report New Westminster
Printable Version – GVR September 2025 Data Infographics Report Richmond
Printable Version – GVR September 2025 Data Infographics Report Squamish